Rwanda Telecom MNO Market Size and Share
Market Overview
| Study Period | 2019 - 2030 |
|---|---|
| Forecast Data Period | 2025 - 2030 |
| Historical Data Period | 2019 - 2023 |
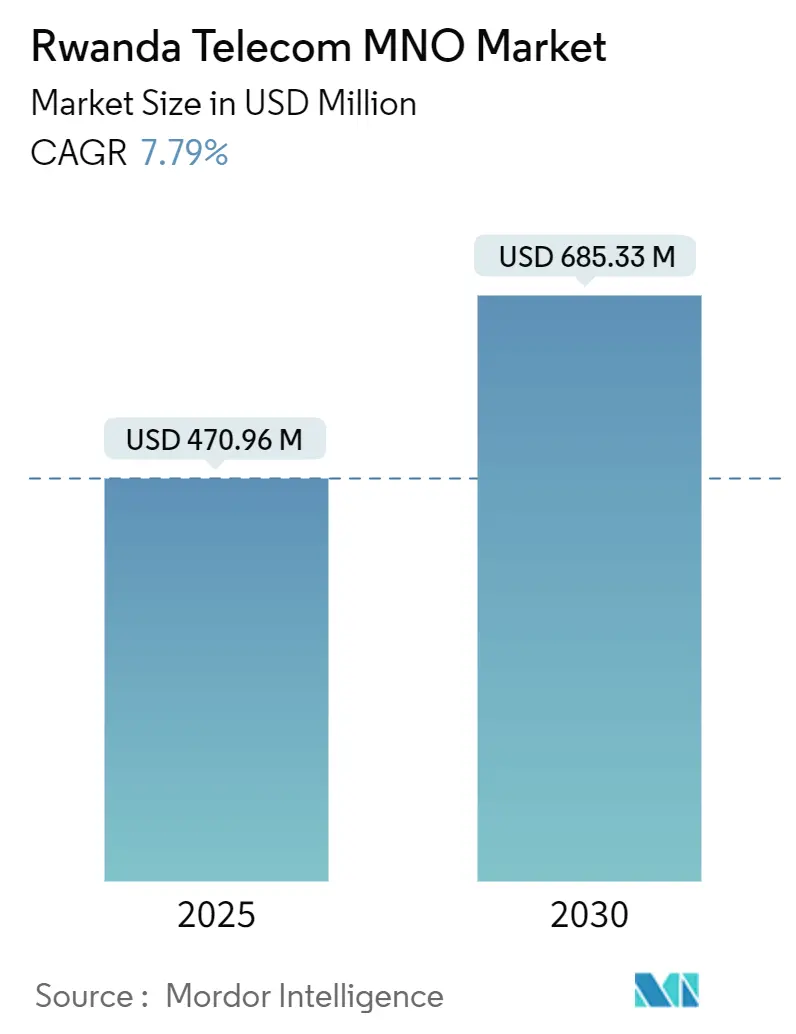
| Market Size (2025) | USD 470.96 Million |
| Market Size (2030) | USD 685.33 Million |
| Growth Rate (2025 - 2030) | 7.79% CAGR |
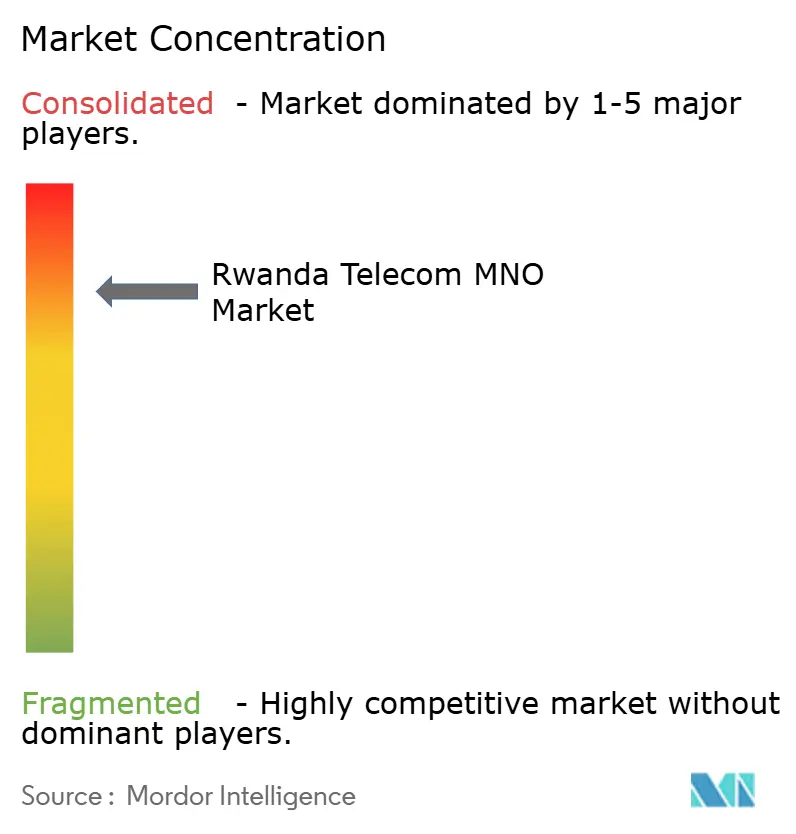
| Market Concentration | High |
Major Players *Disclaimer: Major Players sorted in no particular order Image © Mordor Intelligence. Reuse requires attribution under CC BY 4.0. | |
Rwanda Telecom MNO Market Analysis by Mordor Intelligence
The Rwanda Telecom MNO Market size is estimated at USD 470.96 million in 2025, and is expected to reach USD 685.33 million by 2030, at a CAGR of 7.79% during the forecast period (2025-2030). In terms of subscriber volume, the market is expected to grow from 13.20 subscribers in 2025 to 17.60 subscribers by 2030, at a CAGR of 5.94% during the forecast period (2025-2030).
Growth now reflects monetization of an almost nation-wide 4G footprint, rising smartphone penetration, and the first signs of 5G spectrum planning. Operators focus on boosting data average revenue per user through richer bundles that mix connectivity with mobile money and entertainment. Enterprise digitalization, smart-city pilots, and regional fiber transit services add incremental demand layers. Meanwhile, looming value-added tax on connectivity, low disposable income outside Kigali, and continuing tower cost pressures create a counter-balance that keeps expansion moderate.
Key Report Takeaways
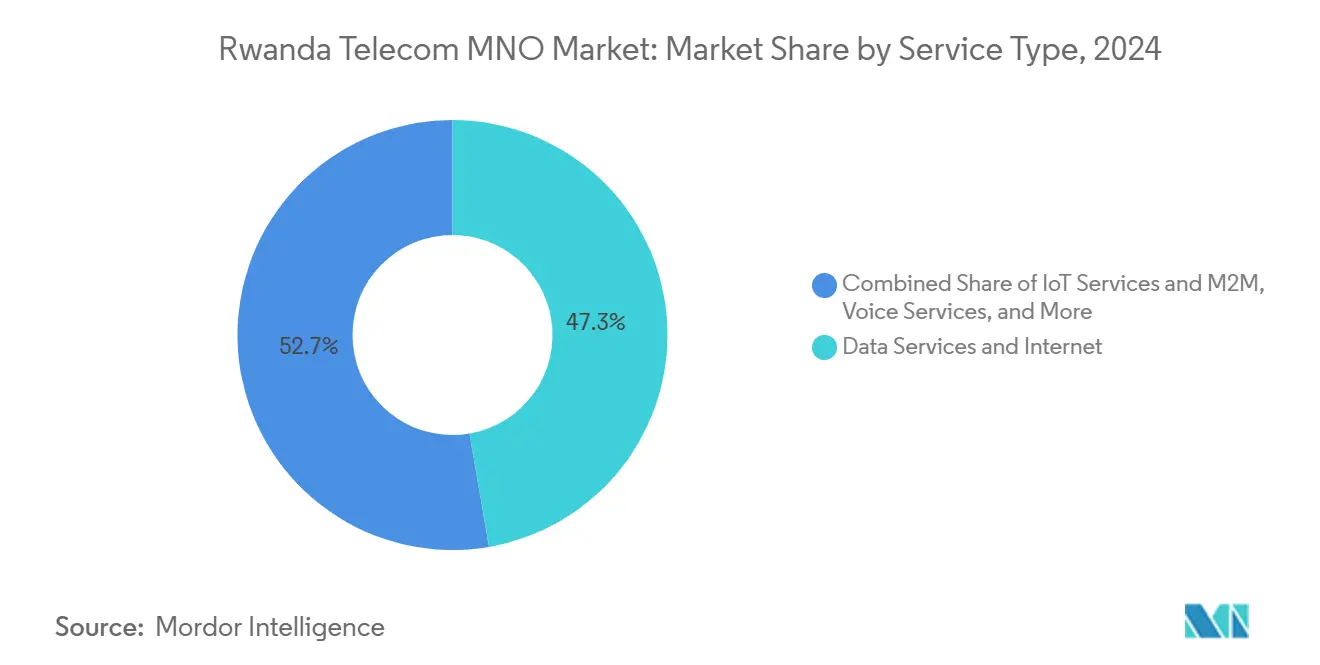
- By service type, data and internet services led with a 47.29% revenue share in 2024, while IoT and M2M services are forecast to grow at 7.93% CAGR to 2030.
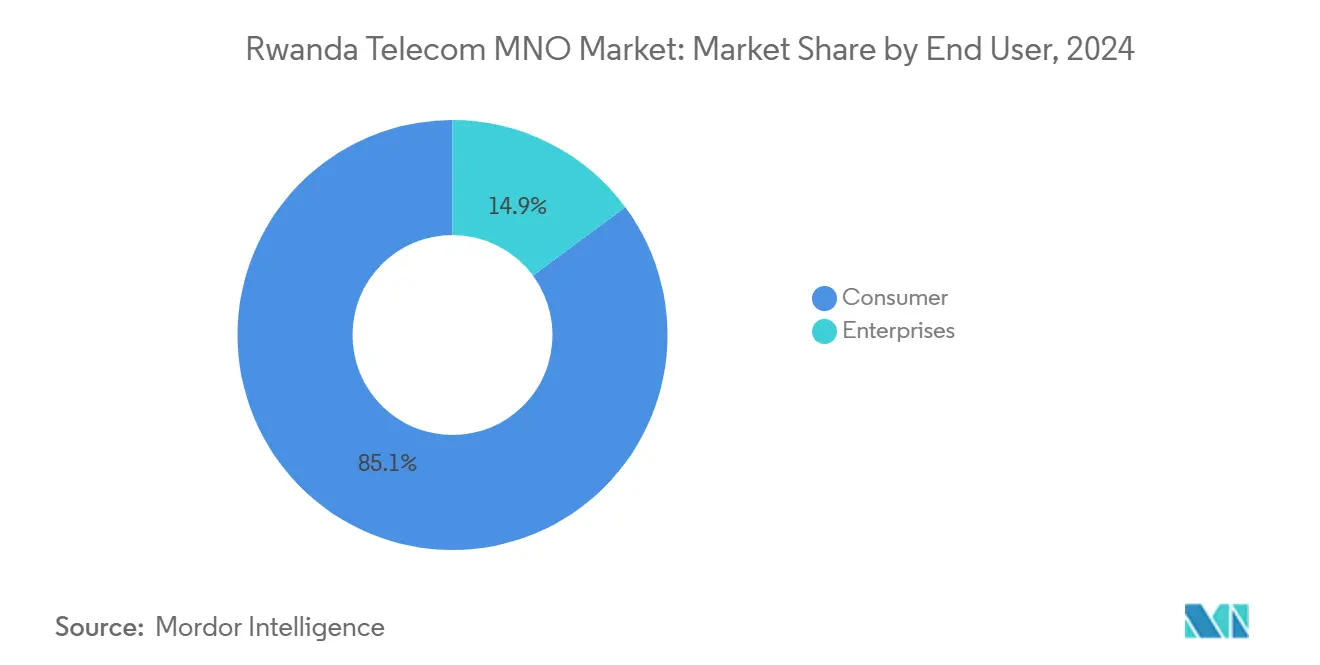
- By end user, the consumer segment held 85.14% of Rwanda telecom MNO market share in 2024, yet enterprise services post the highest projected CAGR of 8.90% through 2030.
Rwanda Telecom MNO Market Trends and Insights
Drivers Impact Analysis*
| Driver | (~) % Impact on CAGR Forecast | Geographic Relevance | Impact Timeline |
|---|---|---|---|
| Aggressive 4G rollout & imminent 5G licensing under Rwanda 5G Roadmap | +0.8% | National, with early deployment in Kigali and major urban centers | Medium term (2-4 years) |
| Smart-phone adoption driving mobile-data traffic & ARPU uplift | +0.6% | National, with stronger impact in urban areas | Short term (≤ 2 years) |
| Mobile-money & fintech services bundling increases service stickiness | +0.4% | National, particularly rural areas with limited banking infrastructure | Long term (≥ 4 years) |
| Growing enterprise demand for cloud, SD-WAN & dedicated Internet | +0.3% | Urban centers, particularly Kigali and secondary cities | Medium term (2-4 years) |
| Kigali Innovation City & Smart City pilots accelerating IoT connectivity | +0.2% | Kigali metropolitan area with gradual national expansion | Long term (≥ 4 years) |
| Cross-border fiber corridors positioning Rwanda as regional IP transit hub | +0.1% | National backbone with regional spillover effects | Long term (≥ 4 years) |
| Source: Mordor Intelligence | |||
Aggressive 4G rollout and imminent 5G licensing
Rwanda reports 99% 4G population coverage, placing operators in a harvest phase rather than build-out. The national 5G roadmap promises spectrum sharing provisions that keep capital expenditure in check while targeting 11.17% 5G population reach by 2030, more than double the continental average. MTN’s recent 5G launches in neighboring markets signal that Rwanda will join the group once commercial terms settle. The policy stance on infrastructure collaboration helps smaller players access next-generation capacity without duplicating towers. This measured approach should lift service quality, open new enterprise use cases, and nudge the Rwanda telecom MNO market toward higher-value tiers.
Smartphone adoption lifting mobile data ARPU
MTN Rwanda posted 33.6% data-traffic growth in Q1 2025 while data subscribers dipped, revealing heavier usage per customer and improving yields.[1]Telecom Lead, “MTN Rwanda Q1 2025 Results,” telecomlead.com Subsidized student bundles ranging from 500 MB daily to 15 GB monthly nurture early digital habits. Mobile internet penetration hit 70.6% in 2024 as national digital-identity integration simplified SIM on-boarding. Mass biometric registration shrank fraud and allowed operators to market premium plans confidently. As video streaming and cloud gaming spread, per-user data consumption will keep climbing, and with it, the Rwanda telecom MNO market ARPU.
Mobile money and fintech bundling
Airtel’s MoMo Rwanda and Mastercard now issue virtual cards linked to wallets, enabling global e-commerce payments.[2]Developing Telecoms, “MoMo Rwanda and Mastercard Partner,” developingtelecoms.com Transaction values across Airtel Africa markets touched USD 128 billion, proving telecom-led finance is mainstream. Rwanda’s eKash switch, based on Mojaloop, further deepens interoperability, while the central bank pilots a USD 35 million retail CBDC that could route through operator channels. Bundled wallets reduce churn, raise stickiness, and create fee-based revenue in addition to data. The model helps operators diversify just as voice declines, strengthening long-term growth prospects for the Rwanda telecom MNO market.
Enterprise demand for cloud and SD-WAN
Kigali Innovation City anchors USD 300 million of technology investments aimed at export-oriented digital services. Local firms seek managed connectivity, cybersecurity, and software-defined networks that guarantee performance. Operators leverage their national fiber to sell differentiated service-level agreements at margins far above consumer data bundles. Government tenders for e-health and e-education also specify dedicated internet links, expanding the addressable enterprise base. This demand layer, though smaller in volume, supports faster revenue growth than the saturated consumer segment.
Restraints Impact Analysis*
| Restraint | (~) % Impact on CAGR Forecast | Geographic Relevance | Impact Timeline |
|---|---|---|---|
| Low disposable income constrains average spend per SIM | -0.5% | National, with stronger impact in rural areas | Short term (≤ 2 years) |
| High rural tower CAPEX/OPEX despite Universal Access targets | -0.3% | Rural areas and secondary cities | Medium term (2-4 years) |
| Single-wholesale-network model limits retail 4G competition | -0.2% | National infrastructure sharing limitations | Medium term (2-4 years) |
| OTT-service taxation uncertainty could suppress data usage elasticity | -0.1% | National, particularly affecting digital services consumption | Short term (≤ 2 years) |
| Source: Mordor Intelligence | |||
Low disposable income limits spend per SIM
Rwanda posted 8.9% economic growth in 2024, but telecom ARPU stalled as many citizens allocate earnings to essentials[3]World Bank Group, “Rwanda Economic Update December 2024,” worldbank.org, and the newly applied value-added tax on telecom services raises end-user prices and could dampen elasticity. Operators answer with micro-recharge options and loyalty airtime-to-data swaps, but margin pressure persists. Unless real wages rise faster, the Rwanda telecom MNO market will struggle to lift revenue faster than inflation in low-income provinces.
Legacy wholesale-only 4G arrangements
Although the single wholesale network was formally dropped, past contracts still shape coverage and pricing. With just MTN and Airtel controlling roughly 88% of SIMs, competitive energy remains muted. Infrastructure seller IHS Towers exited the country for USD 275 million, citing unfavorable returns. Limited rivals and shared towers cap service differentiation, which slows migration to premium plans. The result is restrained upside for the Rwanda telecom MNO market until fresh entrants or small cell solutions loosen this structural bottleneck.
*Our forecasts treat driver/restraint impacts as directional, not additive. The impact forecasts reflect baseline growth, mix effects, and variable interactions.
Segment Analysis
By Service Type: Data and Internet services drive revenue transformation
Data and internet services held 47.29% of 2024 revenue while also rising fastest at 8% CAGR. This dominance arises from 70.6% mobile-internet penetration and nation-wide 4G, propelling the Rwanda telecom MNO market size for data towards USD 122 million by 2030. Mobile-first habits, cheap Android handsets, and government e-learning programs funnel traffic to operator networks. IoT gains momentum through smart agriculture pilots and utility metering that rely on narrow-band connections rather than high bandwidth. Voice, though mature, still underpins rural communication and emergency calls but faces substitution from messaging apps. Financial-service overlays now blur the line between connectivity and payments, expanding the value captured per gigabyte. Satellite backhaul, tested in 40 rural clinics, suggests a hybrid model where terrestrial and non-terrestrial networks co-exist.
The Rwanda telecom MNO market responds by segmenting data offers. Operators package unlimited social media nights, work-from-home weekdays, and enterprise cloud connectivity with service-level guarantees. Content partnerships with global streaming firms further anchor customers. IoT platforms bundle sensor management, analytics, and connectivity under a single fee. Such tiering enlarges average spend in Kigali without alienating price-sensitive users outside the capital. As uptake broadens, data services are expected to represent close to 47.85% of Rwanda telecom MNO market share by 2030.


By End User: Enterprise digitalization accelerates growth
Consumers still represent 85.14% of revenue, yet enterprise lines grow at 8.90% CAGR, quicker than any other slice. Kigali Innovation City incubates tech start-ups that need gigabit links and cloud on-ramps. Banks shift core systems to data centers connected by SD-WAN, boosting demand for dedicated capacity. Government budget of RWF 3.393 trillion for economic transformation channels ICT procurement towards private carriers. The Rwanda telecom MNO market size for enterprise services is forecast to climb from USD 62 million in 2025 to USD 74 million by 2030, a distinct pocket of resilience.
Consumer volumes plateau as SIM penetration approaches the active population limit enforced by biometric caps. For households, bundle differentiation pivots on entertainment and micro-loans rather than plain minutes. Enterprises however request security, multi-cloud routing, and service credits for downtime. Operators thus invest in metro fiber, edge data rooms, and managed firewalls. These higher-margin offerings shift the growth narrative from subscriber addition to solution expansion, smoothing revenue volatility inherent in the consumer prepaid base.
Geography Analysis
National coverage stands at 99.39% for 3G and 99% for 4G, remarkable given Rwanda’s mountainous terrain. Kigali dominates usage and revenue with high device penetration, dense fiber, and a growing expatriate base that demands premium packages. Secondary cities like Huye and Musanze benefit from backbone spurs that ride the East Africa 100 G ring, enabling similar offers albeit with lower volumes. Rural connectivity still relies on macro-towers powered by solar-hybrid systems to trim operating costs. Satellite backhaul fills voids where valley topology blocks line-of-sight to towers.
The Rwanda telecom MNO market strategically leverages its land-locked position by acting as a data-transit point between Uganda, Tanzania, and onward submarine cables. Liquid’s regional ring and the forthcoming Umoja cable to Australia route through Kigali, earning transit fees and boosting international bandwidth supply capacitymedia.com. Closer integration within the East African Community simplifies roaming and cross-border mobile money, expanding addressable usage for operators. Government electrification now covers 75% of households, removing a historic barrier to tower deployment and in-home charging.
Urban-rural digital divide persists in disposable income, not in network reach. Operators curate ultra-low-denomination bundles for rural subscribers and promote community Wi-Fi hot-spots funded by the Universal Access Fund. The policy ambition to shift from voice to data-driven GDP contribution aligns with rising literacy and smartphone affordability. Consequently, the Kigali urban cluster drives advanced 5G and IoT pilots, while rural districts sustain basic revenue through mobile money cash-out and voice.
Competitive Landscape
The Rwanda telecom MNO market is effectively a duopoly, with Airtel Rwanda at 46% and MTN Rwanda at 42% ownership of active connections. KT Rwanda Networks supplies LTE wholesale coverage to 96.4% of the population, supporting both retail rivals without directly chasing retail share. Such concentration grants pricing power and smoother cash flow, yet restrains breakneck competition. Strategic focus shifts toward value-add: Airtel scales MoMo and prepares satellite bundles via its SpaceX deal, whereas MTN links its fintech platform to virtual cards and remittance corridors.
Starlink’s February 2023 commercial launch changed speed benchmarks, reaching 85.5 Mbps median downloads by Q1 2025. This forces incumbents to differentiate on bundle features and ecosystem perks, not raw throughput. Tower ownership transitions after IHS’s USD 275 million asset sale reshape leasing rates and may open tower-cos to smaller 4G+ and 5G tenants. Network-sharing memoranda signed by MTN and Airtel in Uganda and Nigeria show willingness to pool passive and active gear when regulators approve.
Future rivalry will likely revolve around enterprise cloud connect, regional IP transit, and fintech ecosystems rather than subscriber grabs. Operators explore open-radio architectures to cut radio cost and fast-track rural small cells. Policy aims to license mobile virtual network operators under flexible terms, potentially adding segment-specific challengers. Yet without drastic spectrum or license changes, the incumbent pair should keep revenue dominance while experimenting with adjacent services such as insurance and micro-credit.
Rwanda Telecom MNO Industry Leaders
Airtel Rwanda
MTN Rwanda
- *Disclaimer: Major Players sorted in no particular order

Recent Industry Developments
- May 2025: Airtel Africa partnered with SpaceX to extend Starlink internet across the continent including Rwanda, combining terrestrial and satellite reach.
- March 2025: MTN and Airtel agreed on network-sharing in Uganda and Nigeria, a model that could migrate to Rwanda.
- February 2025: Rwanda introduced VAT on telecom and tech services within broad tax reforms, signaling a shift toward revenue harvest.
- December 2024: MTN earmarked USD 300 million for Cameroon while confirming planned efficiency gains in Rwanda.


Rwanda Telecom MNO Market Report Scope
| Voice Services |
| Data and Internet Services |
| Messaging Services |
| IoT and M2M Services |
| OTT and PayTV Services |
| Other Services (VAS, Roaming and International Services, Enterprise and Wholesale Services, etc.) |
| Enterprises |
| Consumer |
| Service Type | Voice Services |
| Data and Internet Services | |
| Messaging Services | |
| IoT and M2M Services | |
| OTT and PayTV Services | |
| Other Services (VAS, Roaming and International Services, Enterprise and Wholesale Services, etc.) | |
| End-user | Enterprises |
| Consumer |


Key Questions Answered in the Report
What is the current value of the Rwanda telecom MNO market?
The Rwanda telecom MNO market stands at USD 470.96 million in 2025 and is set to grow at 7.79% CAGR.
How large will the Rwanda telecom MNO market size be by 2030?
Forecasts place the Rwanda telecom MNO market size at USD 685.33 million by 2030, reflecting ongoing data monetization and enterprise uptake.
Which service line is growing fastest in the Rwanda telecom MNO market?
Data and internet services post the highest forecast CAGR at 8%, leveraging smart-city and enterprise projects.
How extensive is Rwanda’s 4G and 5G coverage?
4G already reaches 99% of the population, and the 5G roadmap targets 11.17% coverage by 2030.
What role does mobile money play in Rwanda’s telecom sector?
Bundled mobile-money offerings raise customer stickiness and add fee-based income, with transaction values supporting sector growth even as voice revenues taper.
Page last updated on:


