Defense NDT Market Size and Share
Market Overview
| Study Period | 2019 - 2030 |
|---|---|
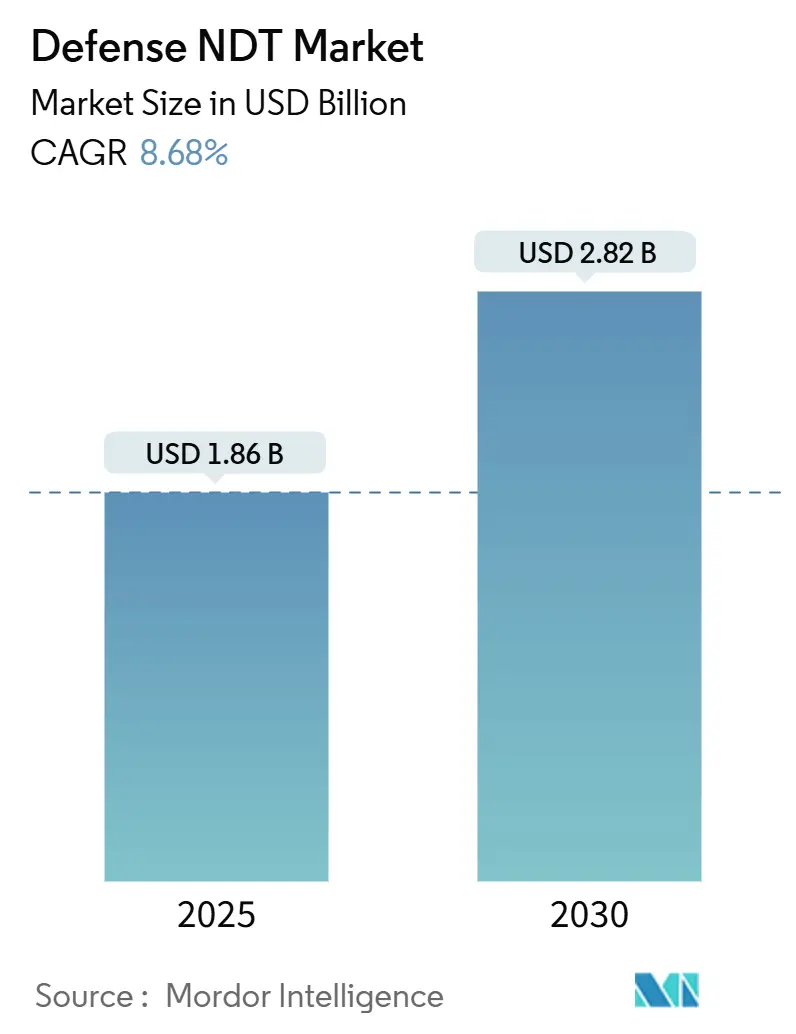
| Market Size (2025) | USD 1.86 Billion |
| Market Size (2030) | USD 2.82 Billion |
| Growth Rate (2025 - 2030) | 8.68% CAGR |
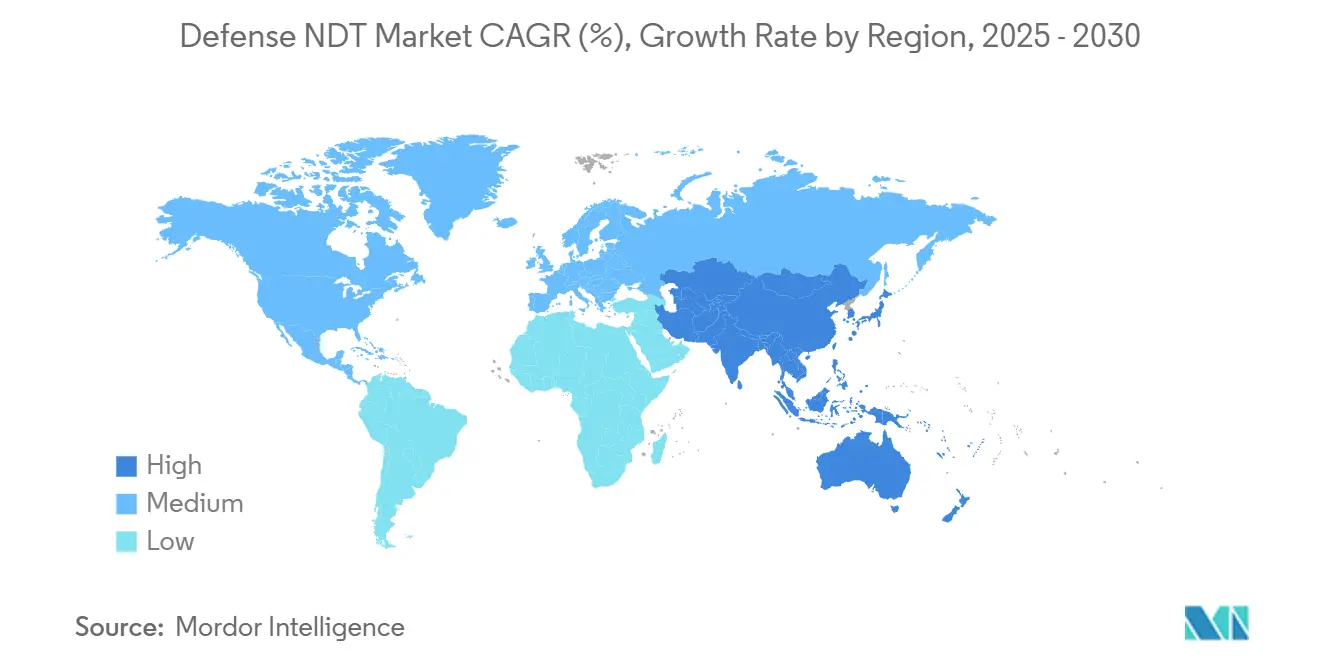
| Fastest Growing Market | Asia Pacific |
| Largest Market | Asia Pacific |
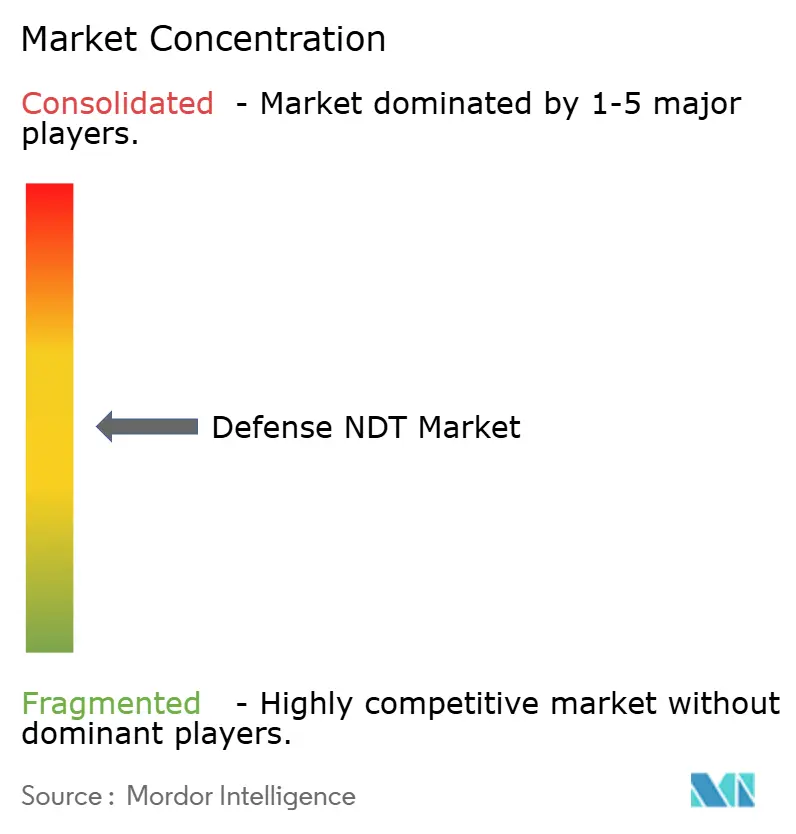
| Market Concentration | Medium |
Major Players *Disclaimer: Major Players sorted in no particular order Image © Mordor Intelligence. Reuse requires attribution under CC BY 4.0. | |
Defense NDT Market Analysis by Mordor Intelligence
The Defense NDT market size is valued at USD 1.86 billion in 2025 and is projected to reach USD 2.82 billion by 2030, advancing at an 8.68% CAGR over the forecast period. Heightened defense-modernization programs, a widening backlog of aging aircraft, and surging demand for cyber-secure inspection platforms collectively accelerate spending on ultrasonic and radiographic solutions. Uptake is especially strong in the Asia-Pacific, where territorial tensions, hypersonic weapons research, and indigenization policies continue to stimulate large-scale deployments. Certified-service outsourcing dominates procurement as armed forces face a persistent shortage of security-cleared technicians, while AI-enabled analytics platforms expand remote inspection capacity and ease talent bottlenecks. Competitive intensity remains moderate, with leading suppliers leveraging technology differentiation, export control compliance, and long-standing relationships with prime contractors to protect their share amid ongoing sector consolidation.
Key Report Takeaways
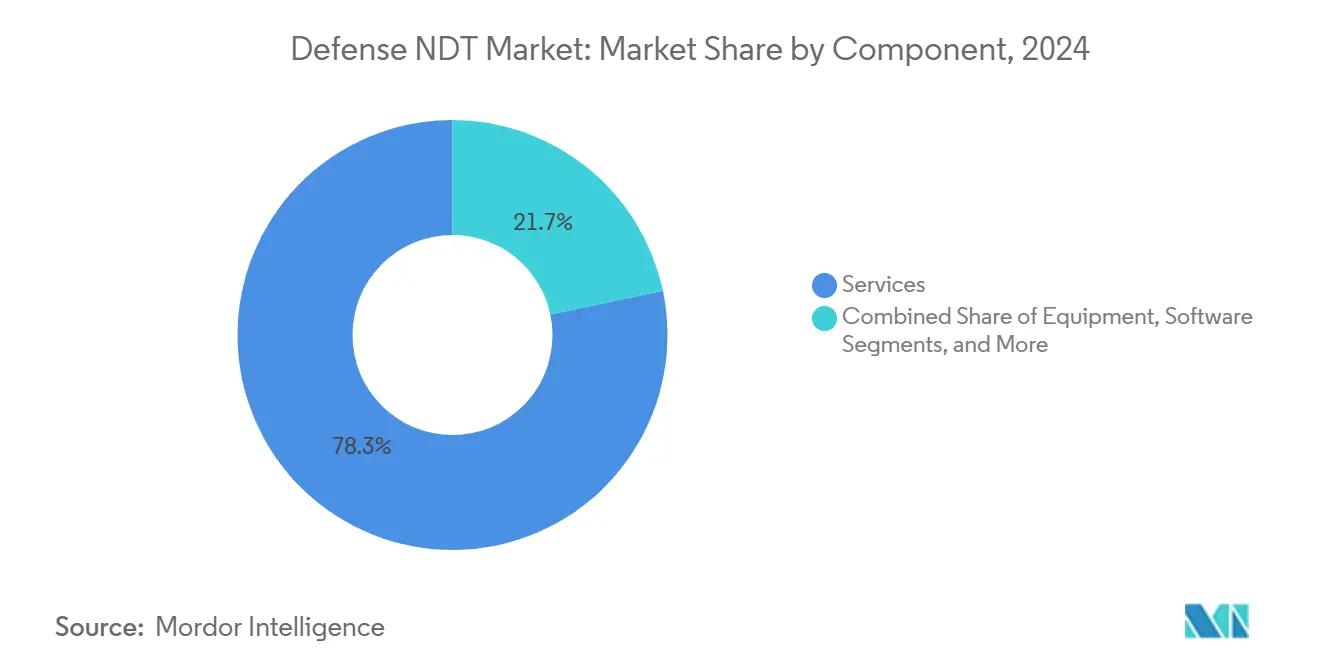
- By component, services commanded 78.3% of the Defense NDT market share in 2024, whereas software is forecast to register a 12.2% CAGR through 2030, fueled by AI-enabled analytics.
- By testing method, ultrasonic testing led the Defense NDT market, accounting for a 27.2% revenue share in 2024, while eddy-current testing is projected to grow at a 9.2% CAGR through 2030.
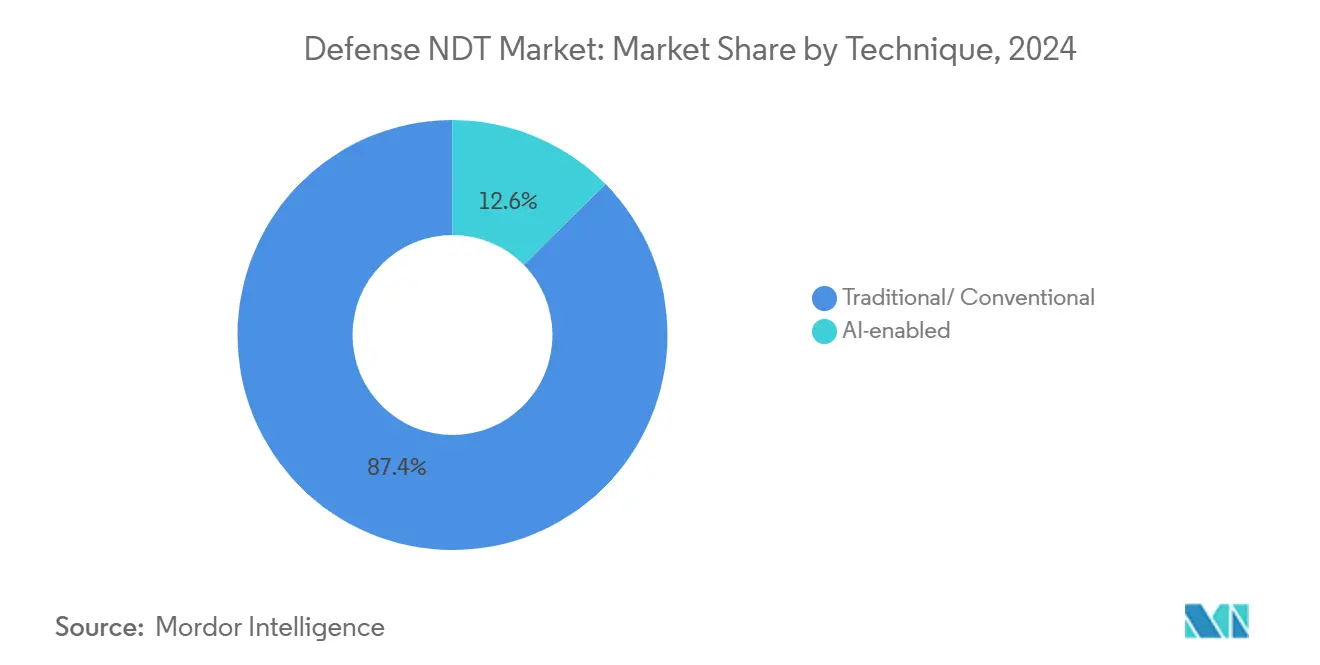
- By technique, traditional approaches retained 87.4% share of the Defense NDT market size in 2024; AI-enabled techniques are expanding at 15.3% CAGR as automated defect detection gains military qualification.
- By geography, the Asia-Pacific region held a 36.2% share of the Defense NDT market in 2024 and is expected to grow at a 9.3% CAGR through 2030, reflecting robust indigenous manufacturing programs and higher defense budgets.
Global Defense NDT Market Trends and Insights
Drivers Impact Analysis*
| Driver | (~) % Impact on CAGR Forecast | Geographic Relevance | Impact Timeline |
|---|---|---|---|
| Defense modernization programs are accelerating ultrasonic and radiographic adoption | +2.1% | Global, concentrated in North America and the Asia-Pacific | Medium term (2-4 years) |
| Aging military aircraft fleets necessitate frequent structural integrity checks | +1.8% | North America and Europe core, expanding to Asia-Pacific | Long term (≥ 4 years) |
| Growing missile stockpile maintenance cycles in post-conflict scenarios | +1.3% | Global, emphasis on NATO countries and conflict-adjacent regions | Short term (≤ 2 years) |
| Cyber-secure software upgrades enabling remote NDT data analytics | +1.5% | Global, led by North America and Europe | Medium term (2-4 years) |
| Shift to additive-manufactured parts in defense platforms | +0.9% | North America and Europe, spillover to the Asia-Pacific | Long term (≥ 4 years) |
| NATO standardization of NDT qualification for ordnance recycling | +0.7% | NATO countries with influence on allied nations | Medium term (2-4 years) |
| Source: Mordor Intelligence | |||
Defense-Modernization Programs Accelerating Ultrasonic and Radiographic Adoption
Global modernization initiatives allocate higher budgets for sophisticated inspection protocols that match the requirements of next-generation weapons and infrastructure. Japan has raised its fiscal 2024 defense budget to JPY 7.95 trillion (USD 53.2 billion), earmarking funds for quality assurance upgrades that comply with stricter military standards.[1]Ministry of Defense Japan, “Defense Budget Overview,” MOD.go.jp The United States prioritizes hypersonic and stealth systems that depend on precision ultrasonic and radiographic validation, while India’s Atmanirbhar Bharat campaign boosts domestic demand for certified solutions. These programs anchor steady orders for ultrasonic flaw detectors, portable radiographic units, and cyber-secure acquisition software, reinforcing the growth trajectory of the Defense NDT market.
Aging Military Aircraft Fleets Necessitating Frequent Structural Integrity Checks
The average age of U.S. Air Force aircraft reached 32 years in 2024, necessitating increased inspection frequency and complexity. Ultrasonic thickness gauges, eddy-current probes, and digital radiography systems are used to detect fatigue, corrosion, and hidden cracks in aging airframes. NATO operators facing similar legacy fleets are expanding life-extension programs, thereby amplifying recurring NDT demand. Composite-rich structures in modern fighters introduce additional inspection challenges, driving the adoption of thermography and computed tomography systems that can image subsurface delamination. Sustained aircraft life-cycle support directly supports rising Defense NDT market revenues over the long term.
Growing Missile Stockpile Maintenance Cycles Post-Conflict Scenarios
Following recent conflicts, NATO directives mandate rigorous inspections of aging ordnance and missile systems under AC/310 munitions safety protocols.[2]NATO Standardization Office, “AC/310 Munitions Safety Standards,” NSO.nato.int Stockpile attrition in active theaters, such as Ukraine, accelerated demand for replenishment and refurbishment, each of which requires non-destructive weld integrity verification and propellant grain analysis. Post-conflict remediation provides a short-term boost by necessitating field-deployable ultrasonic and radiographic solutions to requalify recovered or weather-exposed munitions. Contract volumes are highest in Europe but ripple globally as allies harmonize standards, fortifying the Defense NDT market.
Cyber-Secure Software Upgrades Enabling Remote NDT Data Analytics
Armed forces integrate cloud-hosted NDT platforms hardened to NIST 800-171 and CMMC rules, enabling encrypted data exchange between deployed technicians and engineering hubs. The U.S. Navy’s cyber-physical additive-manufacturing program embeds inspection workflows linked to secure servers. Olympus Scientific Cloud and Waygate Technologies InspectionWorks Insight versions tailored for defense now include multi-factor authentication and on-premise data options. AI-driven algorithms accelerate flaw classification, easing technician shortages and enhancing maintenance scheduling accuracy, which underpins a medium-term CAGR uplift for the Defense NDT market.
Restraints Impact Analysis*
| Restraint | (~) % Impact on CAGR Forecast | Geographic Relevance | Impact Timeline |
|---|---|---|---|
| Scarcity of certified NDT technicians with defense clearance | -1.4% | Global, most acute in North America and Europe | Long term (≥ 4 years) |
| High acquisition cost of AI-enabled CT and phased-array systems | -1.1% | Global, greater impact on emerging markets | Medium term (2-4 years) |
| Radio-isotope sourcing restrictions impacting field radiography | -0.8% | Global, variable by regulation | Short term (≤ 2 years) |
| Data-sovereignty rules limiting cloud-based inspection platforms | -0.6% | Primarily Europe and the Asia-Pacific | Medium term (2-4 years) |
| Source: Mordor Intelligence | |||
Scarcity of Certified NDT Technicians With Defense Clearance
American Society for Nondestructive Testing pathways require extensive classroom and field hours, while Secret and Top Secret clearances often take more than a year to obtain approval.[3]American Society for Nondestructive Testing, “Certification and Training Programs,” ASNT.org The dual requirement sharply narrows the labor pool and inflates wage bills, especially for aerospace overhaul depots and naval shipyards. The retirement of senior inspectors outpaces the onboarding of trainees, burdening existing crews and lengthening maintenance cycles. Defense agencies respond by contracting turnkey service firms and adopting automated scanners, but human skills gaps remain a significant drag on the Defense NDT market's expansion.
High Acquisition Cost of AI-Enabled CT and Phased-Array Systems
AI-equipped computed-tomography installations range from USD 500,000 to USD 2 million, whereas portable phased-array ultrasonic sets list between USD 100,000 and USD 500,000. Procurement approvals often span multiple budget years, limiting rapid refresh cycles and hindering smaller suppliers in emerging markets. Ongoing software subscriptions, calibration, and operator training expenses further elevate the total cost of ownership. Despite superior defect-resolution capabilities, fiscal constraints suppress broader adoption, tempering mid-term growth for the Defense NDT market.
*Our forecasts treat driver/restraint impacts as directional, not additive. The impact forecasts reflect baseline growth, mix effects, and variable interactions.
Segment Analysis
By Component: Services Dominate Through Specialized Expertise
Services captured 78.3% of the Defense NDT market share in 2024, illustrating the premium placed on certified, security-cleared personnel and turnkey project management. Outsourcing alleviates staffing shortages, ensures MIL-STD-410 compliance, and transfers liability to specialists. In contrast, equipment sales lag amid long contracting cycles, while consumables track inspection frequency. Software remains the fastest-growing component, with a 12.2% CAGR, driven by demand for AI-enabled analytics that unify data from ultrasonic, radiographic, and eddy-current probes into secure cyber dashboards. Fleet-wide predictive maintenance models reduce unplanned downtime and optimize spare parts budgets, supporting sustained software adoption.
Second-tier contractors are increasingly purchasing service bundles that combine field inspection, data analytics, and regulatory documentation, thereby expanding their average revenue per project. Major primes negotiate multi-year framework agreements that guarantee inspection capacity for large modernization programs, reinforcing service dominance within the Defense NDT market. As digital twins gain prominence, software licensing revenues further dilute equipment revenues, though specialized probes and fixtures maintain stable demand for aircraft and missile programs.


By Testing Method: Ultrasonic Leadership Amid Eddy-Current Acceleration
Ultrasonic testing generated 27.2% of 2024 revenues, underpinned by its versatility in measuring wall thickness and detecting sub-surface flaws across aircraft wings, naval hulls, and missile casings. Automated phased-array systems reduce inspection times and enhance defect localization, driving growth even in mature segments. Conversely, eddy-current testing is expected to record the highest 9.2% CAGR to 2030, as adoption rises for surface crack detection in additive-manufactured components and aluminum-lithium structures. Its compatibility with robotic scanners enables high throughput, appealing to depots facing technician shortages.
Radiographic testing remains vital for welds but faces isotope-licensing hurdles that elevate operational costs. Thermography, computed tomography, and acoustic-emission modalities are gaining traction for composite parts and hypersonic materials, creating niche growth opportunities. Hybrid inspection packages that combine ultrasonic, eddy-current, and high-resolution imaging ensure comprehensive coverage and align with evolving military qualification protocols. Consequently, diversified method portfolios bolster supplier resilience within the Defense NDT market.
By Technique: Traditional Methods Persist Amid AI-Enabled Growth
Conventional approaches still account for 87.4% of the Defense NDT market size in 2024, owing to extensive field validation and entrenched operator familiarity. Military airworthiness authorities mandate fully documented inspection histories, delaying wholesale shifts to algorithmic alternatives. Nevertheless, AI-enabled techniques are advancing at a 15.3% CAGR, especially for repetitive depot checks, where machine-learning models automate flaw recognition and trend analysis. The U.S. Army’s pilot program for AI-driven additive-manufacturing inspection underscores potential efficiency gains.[4]U.S. Army, “AI-Powered Additive Manufacturing Inspection Systems,” Army.mil
Defense primes begin by deploying AI solutions in non-critical structures, gathering evidence for eventual certification of core safety items. Standard-setting bodies, including ASTM, update guidelines to reflect digital imaging and algorithmic classification, paving the way for broader integration. As younger technicians trained on digital tools enter the workforce, cultural resistance diminishes, accelerating the blend of traditional rigor with data-rich AI-assisted workflows across the Defense NDT market.
Geography Analysis
The Asia-Pacific’s 36.2% share underscores its role as the largest Defense NDT market, with the region projected to grow at a 9.3% annual rate through 2030. China’s naval shipbuilding surge and India’s push for self-reliant defense equipment necessitate a comprehensive inspection of pressure vessels, armor plates, and composite airframes. Japan’s JPY 7.95 trillion (USD 53.2 billion) defense budget allocates substantial funds to sustainment activities requiring certified NDT contractors. Indigenous missile and drone programs across South Korea, Australia, and Taiwan further widen addressable demand for ultrasonic, eddy-current, and computed-tomography technologies.
North America, although holding a smaller share, holds technological leadership that shapes global standards. The U.S. Air Force invests heavily in digital radiography and automated phased-array scanning to manage its aging fleet, sustaining recurring service contracts. AI-enabled platforms developed by domestic suppliers feed a robust export pipeline, tightening integration across the allied supply chain. Canada’s fighter procurement and Mexico’s aerospace manufacturing corridor add incremental growth by demanding MIL-STD-410-compliant inspections.
Europe’s defense NDT market is accelerating as NATO members increase their budgets to counter regional instability. Germany’s fleet-service contracts for heavy-lift helicopters and France’s next-generation carrier program create steady demand for multi-modal inspection packages. EASA-driven harmonization of aerospace standards incentivizes suppliers to maintain dual civil-military certifications, raising entry barriers that favor established players. Smaller European states are increasingly outsourcing NDT services to meet ordnance life-extension mandates, thereby rounding out the region’s growth profile.

Competitive Landscape
The Defense NDT market is moderately concentrated. Olympus Corporation, Waygate Technologies, and Eddyfi Technologies anchor the top tier, capitalizing on proprietary probes, cyber-secure analytics suites, and global service networks. Their depth of export-control expertise and credentialed technician pools erect switching costs for prime contractors. Consolidation accelerated in 2024-2025: Eddyfi acquired NDT Global for pipeline and missile-casing synergies; Institut Dr. Foerster absorbed Prüftechnik NDT to strengthen eddy-current coverage; and Apave bought IRISNDT to widen radiographic capacity.
Strategic initiatives focus on AI-enabled platforms that address labor shortages and enhance detection accuracy. Olympus expanded its Scientific Cloud with hardened encryption, while Waygate added machine-learning classifiers to InspectionWorks Insight. Service providers such as Mistras Group and USA DeBusk secure multi-year maintenance contracts, reflecting customer preference for integrated inspection and data-management solutions. Emerging disruptors focus on niche applications, such as thermal-barrier coatings and hypersonic material testing, seeking collaborative agreements with primes for rapid qualification.
Government procurement guidelines increasingly mandate cyber-hardening and domestic sourcing, providing incumbents with in-country facilities an advantage. Meanwhile, joint ventures in the Asia-Pacific facilitate technology transfer under offset obligations, broadening competitive dynamics. Overall, suppliers that pair robust traditional offerings with AI-enhanced platforms and global clearance-ready workforces are best positioned to sustain share in the Defense NDT market.
Defense NDT Industry Leaders
Eddyfi Technologies
Mistras Group Inc
SGS SA
Bureau Veritas SA
Zetec Inc (Waygate Technologies)
- *Disclaimer: Major Players sorted in no particular order

Recent Industry Developments
- April 2025: Sonaspection underwent a management-led buyout, channeling fresh capital to expand aging-aircraft inspection solutions.
- March 2025: Institut Dr. Foerster bought Prüftechnik NDT GmbH to bolster eddy-current expertise for surface-crack detection in critical defense components.
- February 2025: USA DeBusk acquired CIMA Inspection Services, adding aerospace and military inspection expertise and extending coverage in the southeastern United States.
- January 2025: NDT Global was acquired by Eddyfi/NDT in a transaction exceeding USD 100 million, creating a combined pipeline and defense NDT services powerhouse with expanded ultrasonic and radiographic portfolios.


Global Defense NDT Market Report Scope
| Equipment |
| Software |
| Services |
| Consumables |
| Ultrasonic Testing |
| Radiographic Testing |
| Magnetic Particle Testing |
| Liquid Penetrant Testing |
| Visual Inspection Testing |
| Eddy-Current Testing |
| Acoustic Emission Testing |
| Thermography / Infrared Testing |
| Computed Tomography Testing |
| Traditional/Conventional |
| AI-enabled |
| North America | United States |
| Canada | |
| Mexico | |
| South America | Brazil |
| Argentina | |
| Rest of South America | |
| Europe | Germany |
| United Kingdom | |
| France | |
| Italy | |
| Spain | |
| Rest of Europe | |
| Asia Pacific | China |
| Japan | |
| India | |
| South Korea | |
| South-East Asia | |
| Rest of Asia Pacific | |
| Middle East | Saudi Arabia |
| United Arab Emirates | |
| Turkey | |
| Rest of Middle East | |
| Africa | South Africa |
| Nigeria | |
| Rest of Africa |
| By Component | Equipment | |
| Software | ||
| Services | ||
| Consumables | ||
| By Testing Method | Ultrasonic Testing | |
| Radiographic Testing | ||
| Magnetic Particle Testing | ||
| Liquid Penetrant Testing | ||
| Visual Inspection Testing | ||
| Eddy-Current Testing | ||
| Acoustic Emission Testing | ||
| Thermography / Infrared Testing | ||
| Computed Tomography Testing | ||
| By Technique | Traditional/Conventional | |
| AI-enabled | ||
| By Geography | North America | United States |
| Canada | ||
| Mexico | ||
| South America | Brazil | |
| Argentina | ||
| Rest of South America | ||
| Europe | Germany | |
| United Kingdom | ||
| France | ||
| Italy | ||
| Spain | ||
| Rest of Europe | ||
| Asia Pacific | China | |
| Japan | ||
| India | ||
| South Korea | ||
| South-East Asia | ||
| Rest of Asia Pacific | ||
| Middle East | Saudi Arabia | |
| United Arab Emirates | ||
| Turkey | ||
| Rest of Middle East | ||
| Africa | South Africa | |
| Nigeria | ||
| Rest of Africa | ||


Key Questions Answered in the Report
What is the current value of the Defense NDT market?
The Defense NDT market size is expected to reach USD 1.86 billion by 2025.
How fast is the Defense NDT market expected to grow?
The market is projected to post an 8.68% CAGR from 2025 to 2030.
Which region leads spending on nondestructive defense testing?
The Asia-Pacific region holds the largest share, at 36.2%, thanks to rising defense budgets and modernization programs.
Which testing method is the revenue leader in defense applications?
Ultrasonic testing accounts for 27.2% of 2024 revenues due to its versatility across aircraft, naval, and missile systems.
Why are services dominant in defense NDT procurement?
Services capture 78.3% share because certified technicians with security clearances are scarce, prompting armed forces to outsource inspections.
What technologies show the fastest adoption in defense NDT?
AI-enabled analytics platforms and eddy-current testing are recording the highest growth, driven by automated defect recognition and additive manufacturing inspections.
Page last updated on:


