Computer Aided Engineering Market Size and Share
Market Overview
| Study Period | 2020 - 2031 |
|---|---|
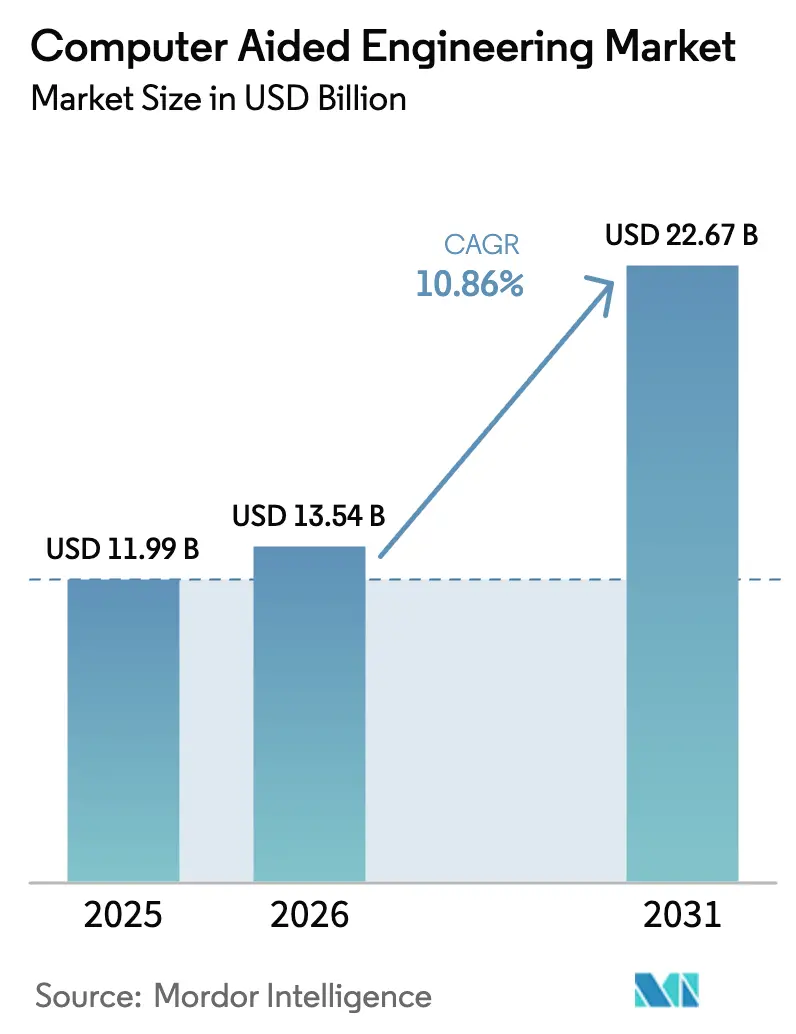
| Market Size (2026) | USD 13.54 Billion |
| Market Size (2031) | USD 22.67 Billion |
| Growth Rate (2026 - 2031) | 10.86% CAGR |
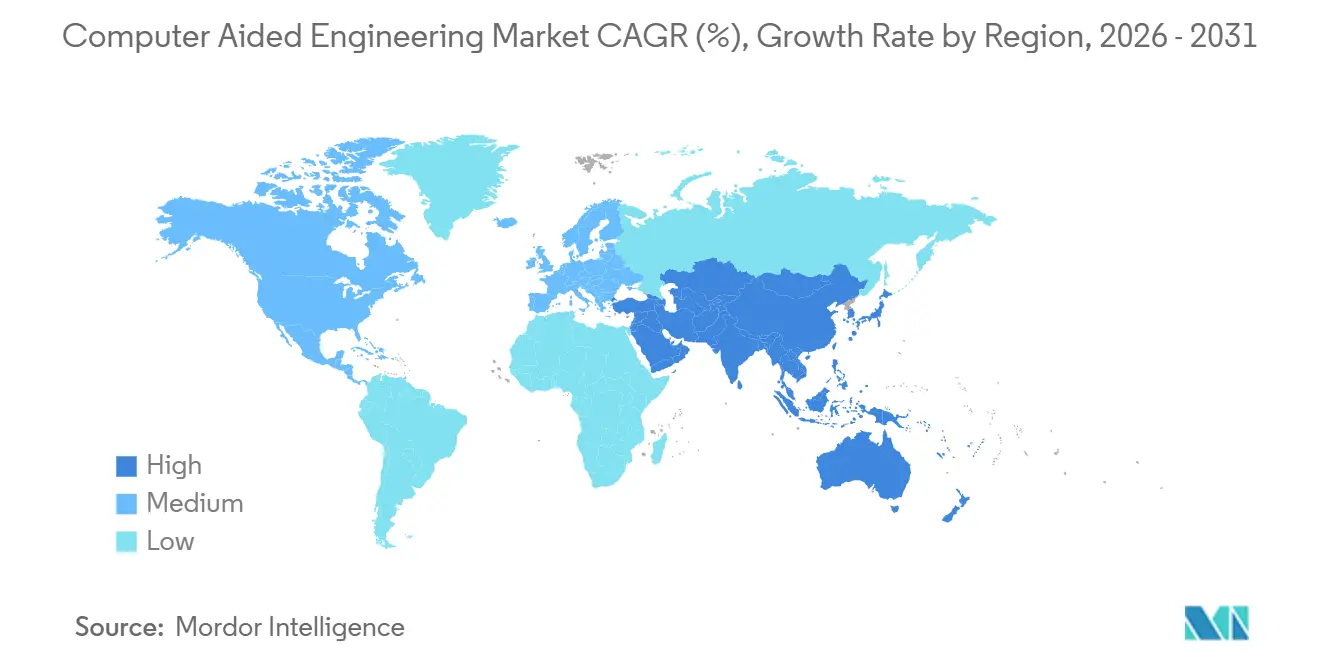
| Fastest Growing Market | Asia Pacific |
| Largest Market | North America |
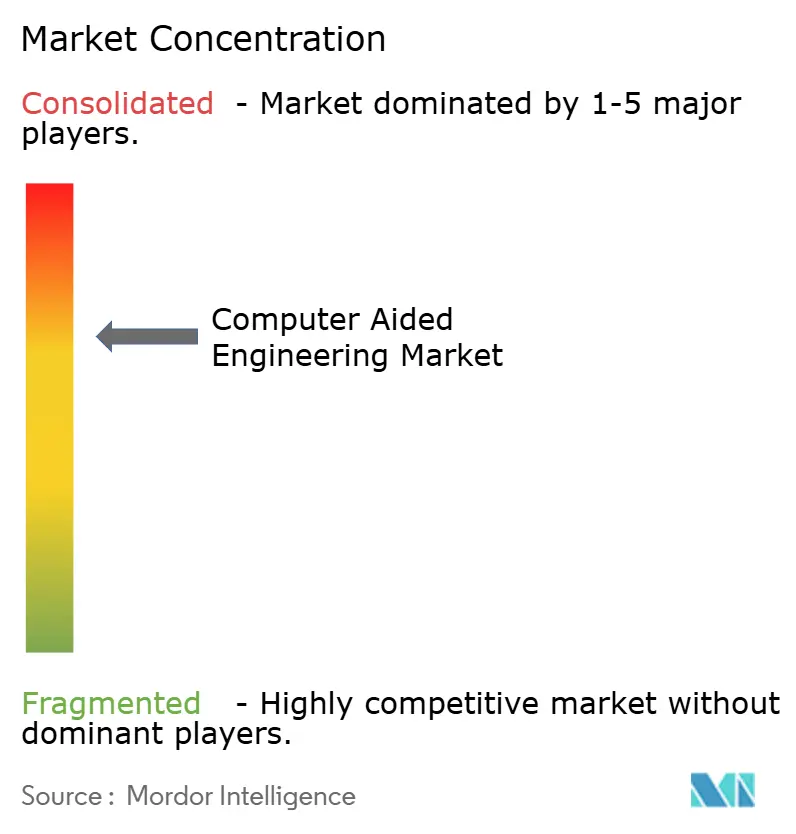
| Market Concentration | Medium |
Major Players *Disclaimer: Major Players sorted in no particular order Image © Mordor Intelligence. Reuse requires attribution under CC BY 4.0. | |
Computer Aided Engineering Market Analysis by Mordor Intelligence
The computer aided engineering market size is projected to be USD 11.99 billion in 2025, USD 13.54 billion in 2026, and reach USD 22.67 billion by 2031, growing at a CAGR of 10.86% from 2026 to 2031. Virtual certification pathways are now accepted by aviation, automotive, and medical-device regulators, shrinking physical-prototype budgets and channeling spend into high-fidelity solvers. Governments in Europe and the Asia-Pacific have introduced sovereign-compute policies that require sensitive simulations to run on domestic clouds, accelerating regional infrastructure investments. Generative-design workflows powered by AI explore thousands of lightweight permutations overnight, pushing solver vendors to integrate GPU acceleration and physics-informed neural networks. Export-control rules on advanced chips, particularly those imposed on China, have forced local developers to optimize code for lower-precision arithmetic and distributed architectures.
Key Report Takeaways
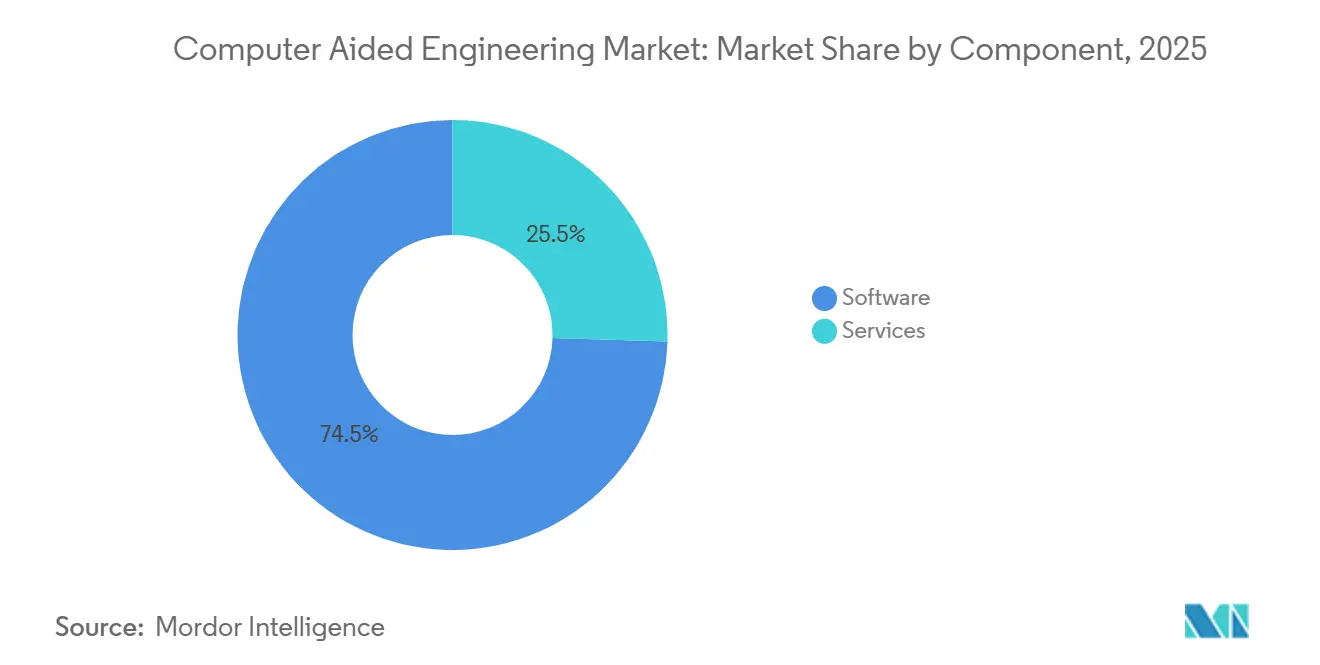
- By component, software led with 74.51% of the computer aided engineering market share in 2025; services are projected to record a 10.93% CAGR through 2031.
- By software type, finite-element analysis captured 38.49% of the computer aided engineering market in 2025, whereas multiphysics computational fluid dynamics is forecast to expand at a 11.82% CAGR through 2031.
- By deployment, on-premises installations accounted for 61.93% of the computer aided engineering market share in 2025, while cloud-based platforms are anticipated to grow at a 11.02% CAGR through 2031.
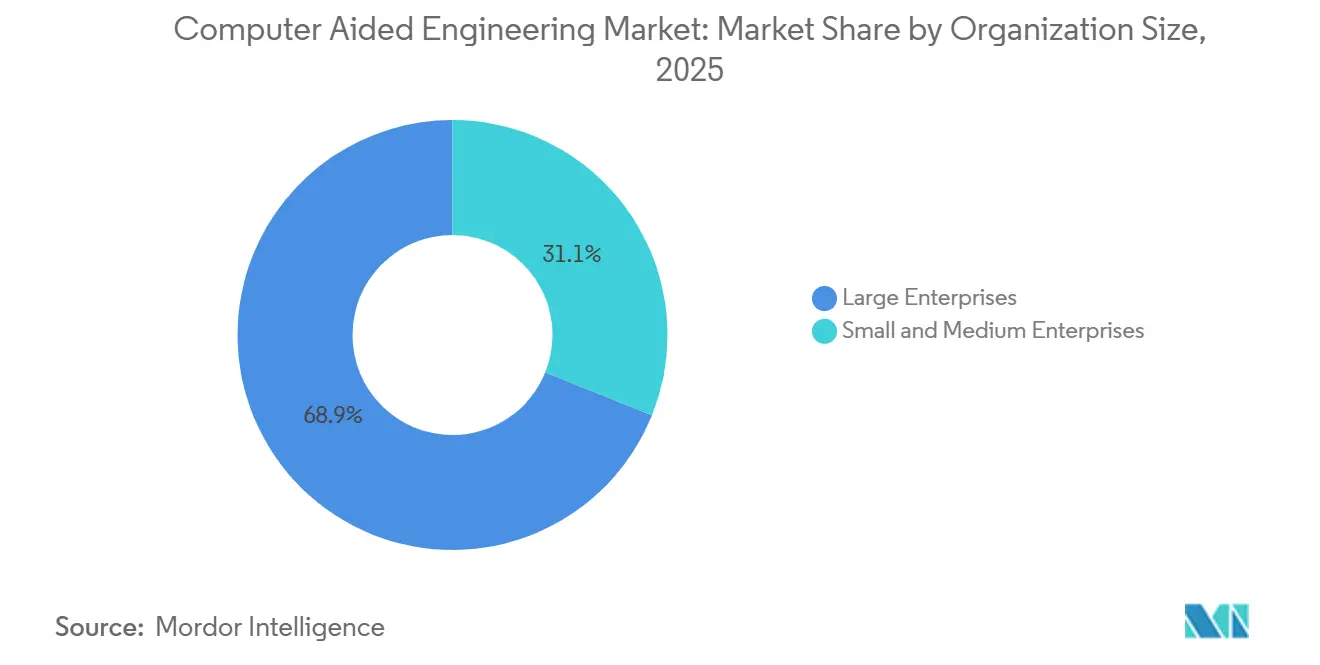
- By organization size, large enterprises accounted for 68.92% of 2025 spending, yet small and medium enterprises are expected to grow at a 11.51% CAGR over 2026-2031.
- By end-user vertical, automotive accounted for 29.18% of the computer aided engineering market in 2025, but healthcare is projected to grow at a 12.47% CAGR during the forecast period.
- By geography, North America led with 32.96% revenue share in 2025, whereas Asia-Pacific is set to register an 11.92% CAGR through 2031.
Note: Market size and forecast figures in this report are generated using Mordor Intelligence’s proprietary estimation framework, updated with the latest available data and insights as of 2026.
Global Computer Aided Engineering Market Trends and Insights
Drivers Impact Analysis*
| Driver | (~) % Impact on CAGR Forecast | Geographic Relevance | Impact Timeline |
|---|---|---|---|
| Integration of AI/ML-Driven Generative Design for Electric Vehicle Lightweighting in Europe and China | +2.1% | Europe and China, spillover to North America | Medium term (2-4 years) |
| Regulatory Push for Virtual Prototyping in Aerospace by FAA and EASA | +1.8% | North America and Europe, adoption spreading to Asia-Pacific | Long term (≥ 4 years) |
| Cloud-Native HPC Access Fueling SME Adoption in Asia-Pacific | +1.9% | Asia-Pacific core, expanding to Middle East and Africa | Short term (≤ 2 years) |
| Sub-5 nm Semiconductor Thermal Challenges Requiring Multiphysics CFD | +1.6% | Global, concentrated in Taiwan, South Korea, United States | Medium term (2-4 years) |
| Sustainability-Led Digital Twins for Energy Optimization in Middle East Refineries | +1.4% | Middle East, early adoption in Saudi Arabia and United Arab Emirates | Medium term (2-4 years) |
| Defense Modernization in Hypersonics Driving Fluid-Structure Interaction Simulations in United States and Australia | +1.5% | United States and Australia, technology transfer to allied nations | Long term (≥ 4 years) |
| Source: Mordor Intelligence | |||
Integration of AI/ML-Driven Generative Design for Electric-Vehicle Lightweighting
Automakers across Europe and China embed machine-learning algorithms into topology-optimization loops, achieving 15-20% reductions in battery-pack weight without compromising crash safety.[1]NVIDIA Corporation, “NVIDIA Blackwell Platform Arrives to Power a New Era of Computing,” nvidia.com NVIDIA’s Blackwell GPUs deliver 2.5 times the floating-point throughput of the prior generation, reducing generative-design cycle times from days to hours. Ansys integrated physics-informed neural networks that enable engineers to train surrogate models using historical finite-element results and then interrogate them in real time during concept studies. Germany’s Fraunhofer KI-LaSt project demonstrated that AI-driven lattice generators can reveal load paths that human designers routinely overlook. China’s Ministry of Industry and Information Technology mandates a 10% reduction in platform weight by 2027, making simulation-driven lightweighting compulsory for domestic OEM programs.
Regulatory Push for Virtual Prototyping in Aerospace
The FAA’s Advisory Circular 20-174 and EASA’s CS-25 Amendment 27 formalize simulation-based certification, allowing airframers to replace up to 40% of physical tests with validated models.[2]European Union Aviation Safety Agency, “CS-25 Amendment 27,” easa.europa.eu Boeing and Airbus have filed more than 50 compliance reports under these new pathways, trimming program timelines and reducing test-rig capital expenditure. Tier-one suppliers, which lack large internal labs, see disproportionate cost relief as virtual drop tests displace destructive hardware trials. Solver vendors must now document numerical convergence and mesh independence in auditable formats that meet DO-178C software-assurance levels, amplifying demand for verification toolchains.
Cloud-Native HPC Access Fueling SME Adoption
Public-sector subsidies in Japan, Singapore, and South Korea pay for cloud tokens, enabling small manufacturers to run CFD jobs that once required USD 500,000 clusters. Japan’s Fugaku supercomputer opened 1 million free node-hours per project, leveling the playing field for precision-machining shops. Rescale’s orchestration platform automatically routes jobs to the lowest-cost cloud region, lowering per-simulation expense by up to 40%.[3]Rescale Inc., “ScaleX Pro Platform for HPC Cloud Orchestration,” rescale.com These programs democratize access and stimulate the computer aided engineering market in countries where SMEs dominate manufacturing value chains.
Sub-5 nm Semiconductor Thermal Challenges Requiring Multiphysics CFD
Nodes below 5 nm generate heat fluxes above 1,000 W/cm², forcing chip designers to couple electro-thermal, fluid, and structural models. DARPA funded USD 45 million to develop atomistic-to-continuum workflows for predicting phonon transport and package-level cooling. IBM’s 2025 demonstration cut prototype iterations by 50% by chaining molecular-dynamics and finite-element solvers. Benchmark datasets from NIST standardize solver verification, while Toshiba’s 3D-stack memory models guide through-silicon-via placement. Solver vendors are racing to adopt GPU acceleration and adaptive meshing to handle these coupled phenomena, expanding the computer-aided engineering market.
Restraints Impact Analysis*
| Restraint | (~) % Impact on CAGR Forecast | Geographic Relevance | Impact Timeline |
|---|---|---|---|
| Pay-per-Use Cloud Licensing Uncertainty for Tier-2 Automotive Suppliers | -0.8% | Global, acute in Europe and North America | Short term (≤ 2 years) |
| Validation Gaps in Biomechanical Models Limiting Surgical Device Uptake | -0.6% | North America and Europe, emerging in Asia-Pacific | Medium term (2-4 years) |
| Export-Control Curbs on HPC Chips Capping Simulation Scale in China | -1.2% | China, indirect effects on multinational supply chains | Long term (≥ 4 years) |
| Steep Learning Curve for Multiphysics Coupling in India | -0.7% | India, spillover to Southeast Asia | Medium term (2-4 years) |
| Source: Mordor Intelligence | |||
Pay-per-Use Cloud Licensing Uncertainty for Tier-2 Automotive Suppliers
Tier-2 suppliers report cloud-solver invoices that exceed annual perpetual-license budgets during design-of-experiments sprints, creating approval bottlenecks and stalling exploratory studies. AVL added tiered pricing, and Dassault Systèmes introduced hybrid token pools, but finance teams still struggle to forecast usage during overlapping customer projects. This expense volatility delays cloud migration, preserving an installed base of aging on-premises clusters and tempering short-term growth in the computer-aided engineering market.
Validation Gaps in Biomechanical Models Limiting Surgical Device Uptake
Finite-element models of bone-implant interaction must capture anisotropic, viscoelastic tissue behavior across heterogeneous anatomies. The FDA has qualified only a handful of orthopedic models since 2017, and ASME V&V 40 compliance costs up to USD 2 million per design. Startups lack the resources for multi-year validation studies, which slows the adoption of simulation for patient-specific implants. Academic repositories help, but they cover only a limited set of loading scenarios. Without broader validation datasets, healthcare’s share of the computer aided engineering market will grow from a smaller base.
*Our forecasts treat driver/restraint impacts as directional, not additive. The impact forecasts reflect baseline growth, mix effects, and variable interactions.
Segment Analysis
By Component: Services Expand as Cloud Migration Accelerates
Software accounted for 74.51% of the computer-aided engineering market share in 2025, reflecting entrenched perpetual licenses and rising SaaS conversions. Services revenue is forecast to climb at a 10.93% CAGR through 2031 as companies outsource solver customization, container orchestration, and validation documentation to third-party specialists. Demand surged after NVIDIA’s Blackwell GPUs prompted enterprises to refactor decades-old Fortran kernels for tensor-core acceleration, a task few in-house teams can tackle efficiently. Professional-services units at leading vendors reported double-digit growth in 2025, an early indicator that service engagement scales whenever new hardware or regulatory mandates reshape workflows.
Consultancies also benefit from ISO 9001 and AS9100 compliance requirements that force engineering departments to document verification routines in auditable form. EnginSoft added 25% to its headcount across Asia-Pacific to address migration backlogs, while Amazon Web Services packaged curated “solver-ready” containers that cut cloud onboarding time from months to weeks. As sovereign-compute policies in Europe and Asia require local cloud deployment, enterprises turn to regional systems integrators for data-residency assurance. The services subsector, therefore, grows faster than the overall computer-aided engineering market, yet still depends on steady software refresh cycles to sustain utilization.


By Software Type: Multiphysics CFD Outpaces Finite-Element Analysis
Finite-element analysis held 38.49% of the computer aided engineering market share in 2025 because crash, durability, and structural-load studies remain core requirements for automotive and aerospace certification. However, multiphysics computational fluid dynamics is projected to expand at an 11.82% CAGR as sub-5 nm chips and refinery heat-recovery projects demand tightly coupled thermal-fluid-structural models. COMSOL Multiphysics 6.2 added induction-heating coupling, while Flow Science improved free-surface capture for metal casting, widening addressable use cases.
Oil-and-gas operators such as Saudi Aramco realized an 18% throughput gain after deploying process-simulation twins that integrate chemical-reaction and CFD modules, validating ROI for high-fidelity flow solvers. Semiconductor designers now link atomistic phonon-transport analyses to package-level CFD, cutting prototype spins by 50% at IBM’s 2 nm node. As generative design engines blend FEA with CFD to iterate on lattices in hours, vendors are converging toolchains into single licenses. The resulting functional overlap ensures that both categories continue to grow, though multiphysics captures incremental computer aided engineering market share gains at the expense of single-physics incumbents.
By Deployment: Hybrid Strategies Bridge On-Premise Control and Cloud Elasticity
On-premises installations accounted for 61.93% of the computer aided engineering market share in 2025 because defense primes and automotive OEMs must comply with ITAR and trade-secret safeguards. Yet cloud-based platforms are poised to grow at an 11.02% CAGR through 2031 as SMEs leverage token models that eliminate USD 500,000 server investments. Rescale’s brokered scheduling reduces per-job costs by routing workloads to the cheapest region, and SimScale’s browser interface eliminates local install overhead.
Siemens introduced burst licensing that lets users offload peak queues to AWS or Azure while retaining local clusters for IP-sensitive studies. Japan’s JPY 10 billion subsidy spurred a 60% increase in cloud-solver hours among firms with fewer than 300 employees, proving that public incentives can tilt procurement decisions. Over the forecast, hybrid footprints dominate: steady-state workloads stay on-premise, while design-of-experiments and generative runs scale elastically. This mixed model drives balanced growth across both deployment types, but cloud captures the faster-growing slice of the computer-aided engineering market.
By Organization Size: SMEs Gain Momentum Through Flexible Token Pools
Large enterprises commanded 68.92% of 2025 spending, buoyed by multi-year enterprise agreements that bundle training, priority support, and unlimited solver seats. Small and medium enterprises are forecast to post an 11.51% CAGR as token-based platforms lower entry barriers. Singapore’s Enterprise Cloud Initiative funded 60% of simulation costs for qualifying firms, triggering a usage spike that narrowed capability gaps with multinational peers.
Altair’s unit-based HyperWorks lets buyers start with 100 consumable tokens across physics domains, aligning cash flow with sporadic project loads. Startups favor browser-native solvers that automatically mesh geometry without specialist intervention, reducing ramp-up time to days. Conversely, conglomerates continue to negotiate steep volume discounts and maintain in-house method-development teams, reinforcing their scale advantage. The widening SME user base nonetheless adds breadth to the overall computer-aided engineering market and spreads vendor risk across more accounts.
By End-User Vertical: Healthcare Emerges as Fastest-Growing Application
Automotive led the computer aided engineering market with 29.18% market share in 2025, driven by electrification, crashworthiness, and battery thermal runaway studies. Healthcare is projected to expand at a 12.47% CAGR, catalyzed by the FDA qualifying finite-element spinal and joint models under its Medical Device Development Tool program. Materialise embedded FEA into Magics to predict bone-cutting forces, while ASME V&V 40 updates guide credibility assessments for patient-specific implants.
Aerospace adoption accelerates under FAA Advisory Circular 20-174 and EASA CS-25 Amendment 27, enabling airframers to swap iron-bird rigs for validated digital twins. Semiconductor, energy, and utilities users push the boundaries of multiphysics to tame sub-5 nm heat flux and improve refinery efficiency. Defense programs in the United States and Australia bankroll hypersonic FSI research worth USD 50 million, fostering solver advances that trickle into commercial sectors. Diversifying vertical uptake helps balance cyclical swings in automotive spending and sustains long-term growth for the computer aided engineering market share.
Geography Analysis
North America commanded 32.96% of 2025 revenue, the largest computer aided engineering market share among all regions, as aerospace primes capitalized on FAA Advisory Circular 20-174 to replace expensive iron-bird experiments with validated digital twins. Contracts exceeding USD 50 million from the U.S. Air Force Research Laboratory for hypersonic fluid-structure interaction tools further bolstered solver uptake. Canada’s National Research Council added new GPU nodes to its cluster to support automotive lightweighting, while Mexican Tier-1 suppliers adopted cloud tokens to meet OEM virtual-validation mandates.
Asia-Pacific is projected to expand at an 11.92% CAGR through 2031, outpacing every other region and adding the largest incremental computer aided engineering market size during the forecast window. Japan’s JPY 10 billion subsidy for SME cloud HPC spurred a 60% increase in solver hours, and the Fugaku supercomputer now provides 1 million free node-hours per industrial project. China’s mandate to reduce the weight of electric vehicles by 10% by 2027 is driving AI-assisted generative design across domestic OEMs. India’s I-STEM portal provides no-cost COMSOL access to 20,000 researchers, helping bridge the region’s multiphysics skills gap, while Australia’s AUKUS Pillar 2 partnership fuels defense simulation budgets.
Europe benefits from EASA CS-25 Amendment 27, which legitimizes virtual testing for fatigue and damage-tolerance cases, prompting airframers to realign certification roadmaps around high-fidelity solvers. Germany’s Fraunhofer KI-LaSt project shows AI lattice generators can uncover load paths human engineers miss, accelerating electric-vehicle chassis optimization. Middle East refineries are adopting sustainability-led digital twins; Saudi Aramco’s Yanbu complex increased throughput by 18% after coupling process CFD with real-time controls. South America’s automotive clusters turn to browser-native solvers to comply with stricter emissions rules, and South Africa’s deep-level mines pilot ventilation CFD, although both regions still capture a comparatively small share of the computer-aided engineering market.

Competitive Landscape
ANSYS, Dassault Systèmes, and Siemens Digital Industries Software are key players in the computer-aided engineering market, collectively accounting for an estimated mid-50s percentage of global revenue. These companies offer comprehensive software suites that encompass preprocessing, solving, and post-processing capabilities. This extensive functionality strengthens switching costs, making it challenging for enterprise clients to transition to alternative solutions.
Siemens closed its USD 10.6 billion Altair acquisition in 2024 and completed the integration of HyperWorks into the Xcelerator token pool in January 2026, enabling multidisciplinary optimization through a single license bucket. Dassault Systèmes answered with SIMULIA Unified Licensing, combining token caps and rollovers to curb pay-per-use volatility for automotive suppliers. Ansys embedded NVIDIA Modulus surrogate-model training in its 2025 release, and the Blackwell GPU family delivers 2.5× floating-point throughput, shrinking generative-design studies from days to hours.
Challenger vendors intensify competition from below. SimScale’s browser-only solvers with AI mesh refinement cut setup time to minutes, resonating with SMEs that lack dedicated CAE staff. Rescale orchestrates multi-cloud HPC, slicing per-simulation cost by up to 40% via automated region bidding. Prometech pushes particle-based CFD into pharmaceuticals and food processing, while Hexagon’s minority stake in a generative-design startup adds topology-optimization IP to its MSC Software stack. Patent filings show Altair and PTC racing to embed large-language models inside CAD, and niche players targeting biomechanical validation aim to meet ASME V&V 40 accuracy at startup-friendly price points, ensuring that technology differentiation, not just scale, continues to shape competitive outcomes.
Computer Aided Engineering Industry Leaders
ANSYS Inc.
Dassault Systèmes SE
Siemens Digital Industries Software
Altair Engineering Inc.
Autodesk Inc.
- *Disclaimer: Major Players sorted in no particular order

Recent Industry Developments
- January 2026: Siemens finished integrating Altair HyperWorks into Xcelerator, enabling multidisciplinary optimization under one token pool.
- November 2025: Dassault Systèmes opened new 3DEXPERIENCE data centers in Singapore and São Paulo, trimming latency by up to 40% for regional users
- June 2025: SimScale launched a foundation AI model that auto-creates mesh refinements, cutting setup time from hours to minutes.
- March 2025: NVIDIA debuted the Blackwell platform, and Ansys simultaneously activated Modulus integration for real-time surrogate models.


Global Computer Aided Engineering Market Report Scope
The Computer Aided Engineering Market Report is Segmented by Component (Software, and Services), Software Type (Finite Element Analysis, Computational Fluid Dynamics, Multibody Dynamics, Optimisation and Simulation), Deployment (On-Premise, and Cloud-Based), Organization Size (Large Enterprises, and Small and Medium Enterprises), End-User Vertical (Automotive, Aerospace and Defence, Electronics and Electrical, Industrial Equipment, Healthcare, Energy and Utilities, Other End-User Verticals), and Geography (North America, South America, Europe, Asia-Pacific, Middle East, Africa). The Market Forecasts are Provided in Terms of Value (USD).
| Software |
| Services |
| Finite Element Analysis |
| Computational Fluid Dynamics |
| Multibody Dynamics |
| Optimisation and Simulation |
| On-Premise |
| Cloud-Based |
| Large Enterprises |
| Small and Medium Enterprises |
| Automotive |
| Aerospace and Defence |
| Electronics and Electrical |
| Industrial Equipment |
| Healthcare |
| Energy and Utilities |
| Other End-User Verticals |
| North America | United States |
| Canada | |
| Mexico | |
| South America | Brazil |
| Argentina | |
| Rest of South America | |
| Europe | Germany |
| United Kingdom | |
| France | |
| Italy | |
| Spain | |
| Rest of Europe | |
| Asia-Pacific | China |
| India | |
| Japan | |
| South Korea | |
| Australia and New Zealand | |
| Rest of Asia-Pacific | |
| Middle East | Saudi Arabia |
| United Arab Emirates | |
| Turkey | |
| Rest of Middle East | |
| Africa | South Africa |
| Nigeria | |
| Egypt | |
| Rest of Africa |
| By Component | Software | |
| Services | ||
| By Software Type | Finite Element Analysis | |
| Computational Fluid Dynamics | ||
| Multibody Dynamics | ||
| Optimisation and Simulation | ||
| By Deployment | On-Premise | |
| Cloud-Based | ||
| By Organization Size | Large Enterprises | |
| Small and Medium Enterprises | ||
| By End-User Vertical | Automotive | |
| Aerospace and Defence | ||
| Electronics and Electrical | ||
| Industrial Equipment | ||
| Healthcare | ||
| Energy and Utilities | ||
| Other End-User Verticals | ||
| By Geography | North America | United States |
| Canada | ||
| Mexico | ||
| South America | Brazil | |
| Argentina | ||
| Rest of South America | ||
| Europe | Germany | |
| United Kingdom | ||
| France | ||
| Italy | ||
| Spain | ||
| Rest of Europe | ||
| Asia-Pacific | China | |
| India | ||
| Japan | ||
| South Korea | ||
| Australia and New Zealand | ||
| Rest of Asia-Pacific | ||
| Middle East | Saudi Arabia | |
| United Arab Emirates | ||
| Turkey | ||
| Rest of Middle East | ||
| Africa | South Africa | |
| Nigeria | ||
| Egypt | ||
| Rest of Africa | ||


Key Questions Answered in the Report
What is the projected value of the computer aided engineering market by 2031?
The market is forecast to reach USD 22.67 billion by 2031.
Which region will grow fastest in computer-aided engineering through 2031?
Asia-Pacific is expected to expand at an 11.92% CAGR, outpacing all other regions.
Why is multiphysics CFD gaining momentum over traditional FEA?
Sub-5 nm chip thermal challenges and refinery optimization demand coupled fluid-thermal-structural modeling that single-physics FEA cannot handle.
How are SMEs overcoming high simulation costs?
Government cloud subsidies and token-based licensing let smaller firms access HPC resources without large capital outlays.
Which end-user sector is likely to see the highest growth?
Healthcare should rise fastest, helped by FDA-backed computational-model qualification pathways for orthopedic implants.
Page last updated on:


