Deep Learning Market Size and Share
Market Overview
| Study Period | 2020 - 2031 |
|---|---|
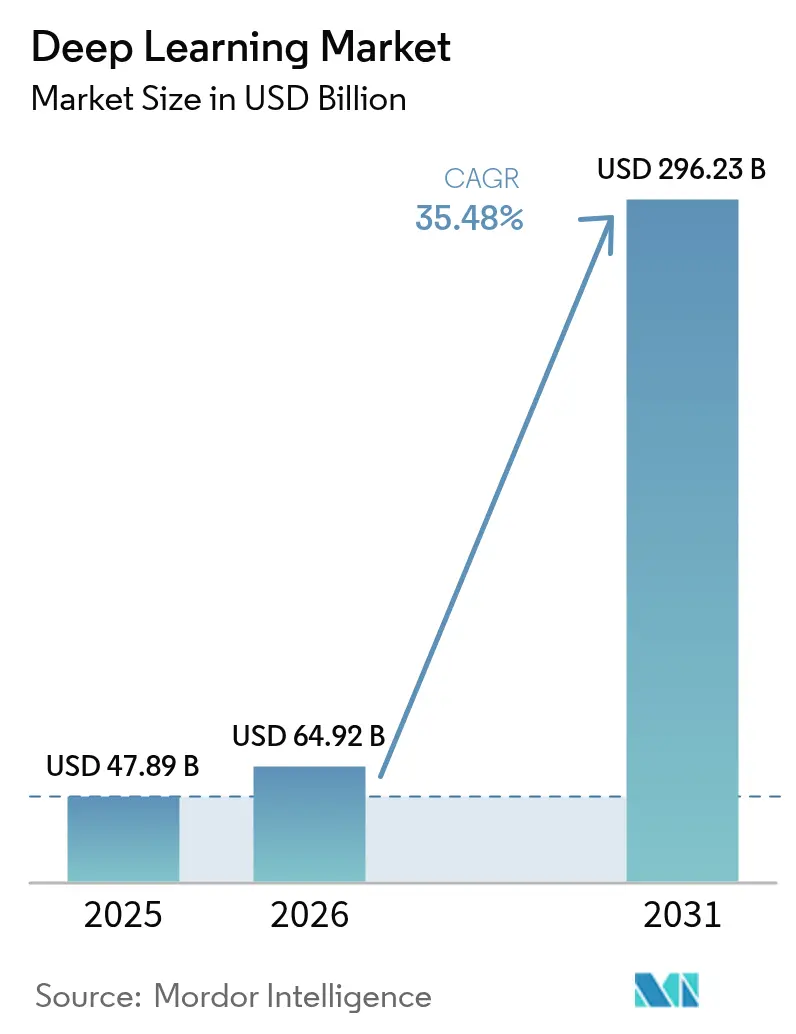
| Market Size (2026) | USD 64.92 Billion |
| Market Size (2031) | USD 296.23 Billion |
| Growth Rate (2026 - 2031) | 35.48% CAGR |
| Fastest Growing Market | Asia Pacific |
| Largest Market | North America |
| Market Concentration | Medium |
Major Players *Disclaimer: Major Players sorted in no particular order Image © Mordor Intelligence. Reuse requires attribution under CC BY 4.0. | |
Deep Learning Market Analysis by Mordor Intelligence
The deep learning market size was valued at USD 47.89 billion in 2025 and estimated to grow from USD 64.92 billion in 2026 to reach USD 296.23 billion by 2031, at a CAGR of 35.48% during the forecast period (2026-2031). Hardware accelerators now deliver larger models at lower latencies, while transformer breakthroughs accelerate adoption across every industry. Financial institutions, hospitals, manufacturers, and retailers embed neural networks directly into workflows instead of confining them to research labs. Hardware vendors, cloud platforms, and software specialists form new alliances that reduce time-to-deployment for enterprise buyers. At the same time, energy use, regulatory scrutiny, and skills shortages challenge the pace of scale-out.
Key report Takeaways
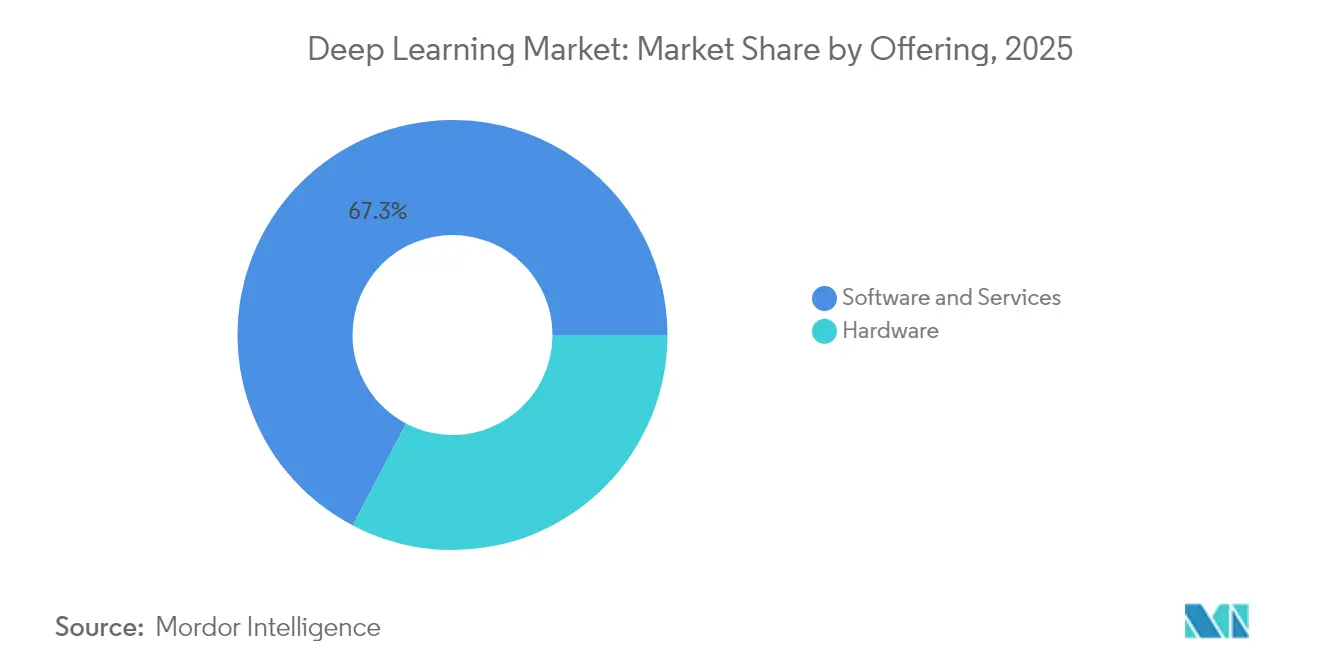
- By offering, Software and Services held 67.32% of deep learning market share in 2025, while Hardware is forecast to expand at a 36.1% CAGR through 2031.
- By end-user industry, the BFSI sector led with 24.12% revenue share in 2025; Healthcare and Life Sciences is projected to grow at a 36.75% CAGR to 2031.
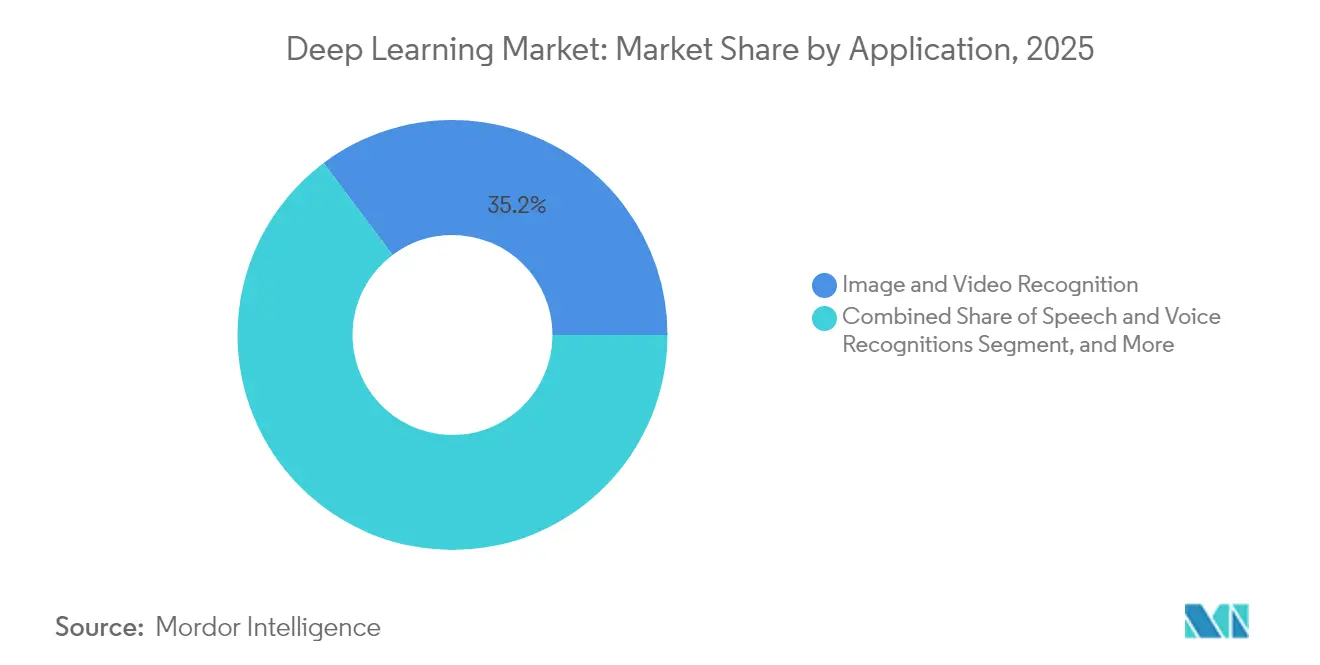
- By application, Image and Video Recognition accounted for 35.23% of deep learning market size in 2025, whereas Autonomous Systems and Robotics will advance at a 37.2% CAGR through 2031.
- By deployment mode, Cloud solutions captured 61.55% share of deep learning market size in 2025 and are set to grow at 38.04% CAGR to 2031.
- By geography, North America commanded 32.12% of the deep learning market in 2025, while Asia-Pacific is forecast to post the fastest 35.92% CAGR between 2026 and 2031.
Note: Market size and forecast figures in this report are generated using Mordor Intelligence’s proprietary estimation framework, updated with the latest available data and insights as of 2026.
Market Trends and Insights
Drivers Impact Analysis of Deep Learning Market*
| Driver | (~)% Impact on CAGR Forecast | Geographic Relevance | Impact Timeline |
|---|---|---|---|
| Explosive growth in unstructured data volumes | +8.20% | Global, with concentration in North America and Asia-Pacific | Medium term (2-4 years) |
| Declining cost and performance leap of AI accelerators | +7.80% | Global, led by US and Taiwan semiconductor hubs | Short term (≤ 2 years) |
| Consumer-grade DL integration (voice, vision, IoT) | +6.40% | North America and Europe early adoption, Asia-Pacific mass market | Medium term (2-4 years) |
| Medical-imaging and diagnostics adoption surge | +5.90% | North America and Europe regulatory leadership, global expansion | Long term (≥ 4 years) |
| Vertical foundation models unlocking niche markets | +4.80% | Global, with enterprise concentration in developed markets | Medium term (2-4 years) |
| Edge/on-device DL for privacy and ultra-low latency | +3.70% | Europe privacy-driven, Asia-Pacific manufacturing applications | Long term (≥ 4 years) |
| Source: Mordor Intelligence | |||
Explosive Growth in Unstructured Data Volumes
Every day enterprises generate 2.5 quintillion bytes of information, and roughly 80% of that data remains unstructured. Optical neural processors now reach 1.57 peta-operations per second, enabling real-time video, audio, and text analysis for autonomous systems and industrial monitoring. Financial institutions report a 300% increase in alternative data feeds, including satellite imagery and social sentiment, which demands specialized models able to correlate disparate sources. Edge computing deployments rise 34% year over year as firms shift from batch analytics to low-latency inference. The resulting feedback loop boosts model accuracy while expanding addressable workloads.
Declining Cost and Performance Leap of AI Accelerators
Advanced 3-nanometer designs, stacked HBM memory, and photonic interconnects push compute costs down by 40% annually. NVIDIA’s Blackwell Ultra delivers 1.5× performance over its prior generation.[1]NVIDIA Corporation, “Introducing the Blackwell GPU Architecture,” nvidia.com AMD’s MI350 series posts 35× throughput gains versus earlier chips . These leaps allow mid-market companies to run 100-billion-parameter models on single-node systems instead of distributed clusters. Lower capital outlays widen the customer base and shorten procurement cycles, turning hardware into the fastest-growing deep learning market segment.
Consumer-Grade DL Integration
AI PCs, smart cameras, and voice assistants generate billions of daily interactions, producing massive fine-tuning data while driving demand for on-device inference. Apple allocates USD 1 billion to new AI infrastructure, and analyst forecasts show AI-capable PCs will represent 80% of shipments by 2028. Qualcomm’s Snapdragon X Elite reaches 40 TOPS on handheld devices, letting users perform advanced NLP and vision tasks without cloud connectivity.[2]Qualcomm Incorporated, “Qualcomm On-Prem AI Appliance Solution,” qualcomm.com Privacy rules and data-sovereignty laws further encourage edge-first architectures, embedding the deep learning market directly into consumer life.
Medical-Imaging and Diagnostics Adoption Surge
The FDA cleared 521 AI-enabled medical devices in 2024, up 40% year on year. Domain-specific foundation models deliver 94.5% accuracy on medical examinations, outperforming general systems. Health providers now deploy radiology, pathology, and ophthalmology tools that reduce diagnostic times and improve patient outcomes. Regulatory clarity prompts vendors to invest in explainable AI that meets clinical-grade requirements. As these solutions scale globally, healthcare becomes the fastest-growing vertical in the deep learning market.
Restraints Impact Analysis of Deep Learning Market*
| Restraint | (~)% Impact on CAGR Forecast | Geographic Relevance | Impact Timeline |
|---|---|---|---|
| High energy footprint and cooling costs | -4.2% | Global data center hubs, particularly US and Europe | Short term (≤ 2 years) |
| Scarcity of specialized DL talent | -3.8% | Global, acute in North America and Europe | Medium term (2-4 years) |
| Tightening global AI regulation | -2.9% | Europe leading, US and Asia-Pacific following | Long term (≥ 4 years) |
| IP/copyright liability for training data | -2.1% | Developed markets with strong IP frameworks | Medium term (2-4 years) |
| Source: Mordor Intelligence | |||
High Energy Footprint and Cooling Costs
AI clusters are projected to consume 46–82 TWh in 2025 and could rise to 1,050 TWh by 2030. Individual training runs now draw megawatt-hours of power, and racks outfitted for GPUs require 40–140 kW versus 10 kW for typical servers. Direct-liquid and immersion cooling add 15–20% to capital costs, while fluctuating renewable supply creates reliability challenges. Energy now represents up to 40% of total AI ownership costs, forcing buyers to weigh electricity tariffs and carbon objectives before scaling.
Scarcity of Specialized DL Talent
Global demand for AI professionals is expected to hit 6 million roles by 2030, yet universities cannot produce enough graduates. Healthcare AI needs data scientists who also understand clinical workflows, and financial services require experts fluent in risk regulation. Corporate upskilling programs often take more than a year, delaying rollouts and raising project costs. Talent deficits therefore remain a medium-term drag on the deep learning market.
*Our forecasts treat driver/restraint impacts as directional, not additive. The impact forecasts reflect baseline growth, mix effects, and variable interactions.
Deep Learning Market Segment Analysis
By Offering:
Hardware Acceleration Drives Infrastructure TransformationHardware posted a 36.1% CAGR forecast through 2031, propelled by demand for GPUs, custom ASICs, and wafer-scale engines. NVIDIA’s GB10 Grace Blackwell superchip powers personal AI stations priced at USD 3,000 that can handle 200-billion-parameter models . Cerebras Systems demonstrates inference at 1,500 tokens per second on its wafer-scale platform, representing a 57-fold speed improvement over legacy GPU clusters. Telecommunication operators, automotive OEMs, and cloud providers adopt these accelerators to shrink floor space and energy consumption. Start-ups leverage lower capex to prototype vertical solutions, narrowing time-to-market for industry-specific applications.
Software and Services still command most revenues because recurring subscriptions, managed platforms, and integration projects generate predictable cash-flows. Vertical foundation models for healthcare, finance, and manufacturing drive service demand as clients seek domain expertise. Cloud vendors bundle model-as-a-service offerings with orchestration tools, letting enterprises avoid infrastructure management. Customization mandates consulting help, sustaining double-digit growth even as hardware outpaces in percentage terms. The symbiosis between hardware innovation and software monetization ensures balanced expansion across the deep learning market.


By End-User Industry:
Healthcare Transformation Accelerates Enterprise AdoptionBFSI controlled 24.12% of deep learning market share in 2025, leveraging fraud detection, risk modeling, and algorithmic trading. Large banks integrate transformer-based customer-service agents that resolve 70% of queries on first contact, raising satisfaction scores and trimming costs. Payment networks embed anomaly detection on streaming data to block fraudulent transactions within milliseconds.
Healthcare and Life Sciences display the fastest 36.75% CAGR as diagnostic approvals surge. Radiology workflows that once required manual review now achieve instant triage, while genomic analysts deploy foundation models to identify promising drug targets in weeks instead of months. Hospitals adopt privacy-preserving federated learning to safeguard patient records, satisfying regulators and insurance providers. Pharmaceutical firms invest in AI-driven protein-folding and simulation tools, accelerating clinical trial timelines. This momentum positions healthcare as a pivotal revenue engine for the deep learning market.
By Application:
Autonomous Systems Signal Market Evolution Beyond PerceptionImage and Video Recognition captured 35.23% of deep learning market size in 2025 owing to surveillance, quality control, and augmented-reality use cases. Edge devices now process vision workloads on-site, cutting latency and bandwidth. Retailers deploy shelf-scanning cameras to optimize inventory, while cities integrate traffic analytics to reduce congestion.
Autonomous Systems and Robotics will expand at a 37.2% CAGR through 2031. NVIDIA’s Isaac GR00T foundation model enables humanoid robots to perform context-aware manipulation in warehouses and elder-care facilities. Logistics providers pilot last-mile delivery bots that navigate complex urban settings. Manufacturers roll out AI-guided cobots that learn new tasks from a handful of demonstrations, improving flexibility amid labor shortages. The shift from passive sensing to decision-making cements autonomy as the next frontier of the deep learning market.
By Deployment Mode:
Cloud Supremacy Reinforces Centralized AI ArchitectureCloud services owned 61.55% of deep learning market size in 2025 and are on track for a 38.04% CAGR, reflecting enterprises’ preference for scalable compute and integrated tooling. OpenAI now trains and serves models on Google Cloud’s infrastructure, underscoring reliance on hyperscale capacity . Providers package accelerator instances, managed notebooks, and vector databases into turnkey stacks that reduce deployment cycles from months to weeks.
On-premise solutions remain vital for data-sovereign workloads. Qualcomm’s AI Appliance helps insurers and retailers run models locally, preserving privacy while lowering egress fees. Hybrid patterns emerge where training occurs in the cloud but latency-sensitive inference runs at the edge or in the data center. As organizations refine workload placement, the deep learning market balances centralized scale with distributed agility.
Geography Analysis
North America Deep Learning Market
North America held 32.12% of the deep learning market in 2025, semiconductor fabrication expands domestically as TSMC invests USD 165 billion in Arizona plants, reducing supply-chain risk. Canada capitalizes on research excellence to spin out NLP start-ups, while Mexico becomes a near-shore assembly base for AI hardware. Regional energy grids, especially in Virginia and Texas, struggle to accommodate racks drawing up to 140 kW, prompting utilities to accelerate renewable capacity.
APAC Deep Learning Market
Asia-Pacific is the fastest climber with a 35.92% CAGR forecas. India implements national AI centers that offer subsidized compute credits to start-ups, spawning a wave of fintech and agritech solutions. Japan leverages robotics heritage to commercialize service robots for aging populations, while South Korea couples 5G leadership with edge AI deployments in smart factories. Australia experiments with autonomous mining trucks, and Southeast Asian e-commerce firms apply recommendation engines to vast mobile consumer bases. The diversity of use cases underpins sustained regional demand for deep learning solutions.
Europe Deep Learning Market
Europe advances at a steady pace despite compliance overhead from the EU AI Act, which can impose fines up to 3% of global turnover for violations. German automakers integrate explainable AI for safety-critical perception in electric vehicles, while Italian machinery makers embed predictive maintenance analytics. Nordic countries power data centers with hydro and wind resources, marketing carbon-neutral AI services that appeal to sustainability-minded clients. The United Kingdom operates a flexible post-Brexit framework, attracting US and Asian firms seeking access to both European and Commonwealth markets. Collectively, these dynamics position Europe as a hub for responsible and energy-efficient deep learning market growth.


Regulatory Landscape
Global deep learning deployments face intensifying AI-specific compliance requirements alongside existing privacy, cybersecurity, and sector rules. In the European Union, Regulation (EU) 2024/1689 (EU AI Act) codifies a risk-based framework, with implementation milestones tracked by the European Commission AI Act Service Desk and penalties referenced in-market up to 3% of global turnover for certain violations. That pressure is pushing vendors and enterprise adopters toward stronger documentation, transparency, and governance practices for high-impact use cases such as healthcare diagnostics, critical infrastructure, and safety-related automation.
In the United States, the 2026 regulatory posture added a federal security and benchmarking layer through Executive Order 14409 (Promoting Advanced Artificial Intelligence Innovation and Security). The order directs agencies to protect intellectual property and harden systems against AI-enabled risks, and it sets deadlines for cross-agency mechanisms, including an AI cybersecurity clearinghouse, as well as benchmarking and controlled pre-release access concepts for covered frontier models. Multilateral alignment remains active through the G7 Hiroshima AI Process, highlighted by the May 29, 2026 G7 Digital and Technology Ministerial Declaration, which commended the revised reporting framework for AI risk assessment and mitigation.
Value Chain Analysis
The deep learning value chain starts with data acquisition and preparation, then model development and training on accelerated compute, and moves into deployment (cloud, on-premises, and edge) with ongoing operations such as monitoring, retraining, security, and compliance. Upstream, advanced semiconductors, HBM memory, and advanced packaging are key inputs for GPUs, ASICs, and custom accelerators used in training and inference clusters. Midstream, hyperscale clouds and OEMs integrate these components into server platforms, networking (for example, high-performance Ethernet fabrics), and data center systems. Downstream, software frameworks, managed MLOps, and verticalized model providers deliver workflow integration across BFSI, healthcare and life sciences, manufacturing, retail, automotive, telecom, and public sector use cases.
A defining value-chain shift in 2026 is long-horizon capacity reservation and deeper co-design between model developers, cloud platforms, and hardware ecosystems. NVIDIA and Meta, for instance, announced a strategic multiyear partnership to build hyperscale data centers using Blackwell and Rubin GPUs alongside Spectrum-X networking and Grace CPUs, while Amazon expanded its AI infrastructure commitments through large multiyear agreements that combine merchant GPU supply with in-house silicon (Trainium) capacity for frontier model training. These steps elevate supply assurance, power and cooling readiness, and software stack compatibility (toolkits, microservices, and orchestration) as procurement decision factors, alongside unit performance.
Competitive Landscape
Start-ups such as Cerebras, Groq, and SambaNova carve out niches by optimizing inference workloads for lower power envelopes. AMD’s MI350 family challenges incumbents with 35× generation-on-generation gains, prompting price competition that benefits buyers.
In software and services, fragmentation prevails. Vertical specialists build proprietary models tuned to healthcare, finance, or industrial processes. System integrators package these models with workflow automation and compliance monitoring. Patent filings in generative AI surpassed 14,000 families by 2023, half of which relate to deep learning, underscoring intense IP rivalry. As vendors jockey for talent, acquisition premiums rise for teams with proven deployment experience.
Strategic alliances now blur traditional sector lines. Cloud providers bundle custom silicon, data platforms, and managed inference endpoints. Chipmakers co-design software frameworks to lock in developer mindshare. Telecom operators leverage 5G assets to enter edge AI services, partnering with hardware firms for integrated base-station accelerators. This race to offer full-stack solutions elevates switching costs and cements long-term customer relationships across the deep learning market.
Deep Learning Industry Leaders
NVIDIA Corporation
Google LLC (Alphabet)
Amazon Web Services, Inc.
Microsoft Corporation
IBM Corporation
- *Disclaimer: Major Players sorted in no particular order

Deep Learning Market Companies Covered in this Report
- NVIDIA Corporation
- Google LLC (Alphabet)
- Amazon Web Services, Inc.
- Microsoft Corporation
- IBM Corporation
- Meta Platforms, Inc.
- Intel Corporation
- Advanced Micro Devices, Inc.
- SAS Institute Inc.
- RapidMiner, Inc.
- Baidu, Inc.
- Qualcomm Technologies, Inc.
- Huawei Technologies Co., Ltd.
- Graphcore Ltd.
- Cerebras Systems, Inc.
- Xilinx (part of AMD)
- Samsung Electronics Co., Ltd.
- Oracle Corporation
- H2O.ai
- Databricks, Inc.
- SenseTime Group
- OpenAI LP
- Tesla, Inc.
- NEC Corporation
- Darktrace plc

Market Opportunities and Future Outlook
Multi-gigawatt data center buildouts and custom silicon programs create near-term whitespace for deep learning infrastructure, deployment engineering, and efficiency tooling. Meta expanded its Richland Parish (Louisiana) Hyperion campus plan to 5 gigawatts with total investment cited above USD 50 billion (July 2026) and also disclosed a September 2026 production start for a new iteration of internally developed AI chips. That combination reinforces demand for model-optimization, compiler, and portability layers that reduce lock-in while preserving performance across heterogeneous accelerators. In parallel, energy and cooling constraints, including higher-density racks and liquid cooling adoption, create room for providers that package performance-per-watt improvements, scheduling, and cost controls into managed training and inference services.
Standards and government frameworks are also narrowing expectations for trustworthy deployment, which increases demand for governance-by-design across regulated industries rather than ad hoc controls. ITU-T approval of Y.Sup96 (November 2025) provides a standardization roadmap for machine learning in ICT, while NIST published its 2026 AI and ML Roadmap for Smart Manufacturing (July 2026), supporting industrial adoption patterns such as digital twins and physics-informed AI. In the United States, Executive Order 14409 (June 2026) and the National Policy Framework for AI legislative recommendations (March 2026) set priorities around security and benchmarking, including mechanisms such as sandboxes, which is pushing vendors to productize compliance evidence, evaluation, and secure model access controls as part of enterprise-ready deep learning platforms.
Recent Industry Developments in Deep Learning Market
- July 2026: Meta announced the expansion of its Richland Parish, Louisiana, Hyperion data center campus to 5 gigawatts with total investment cited above USD 50 billion. The scale-up highlights how frontier-model training and inference are translating into multi-gigawatt infrastructure planning, tightening demand for accelerated hardware, high-performance networking, and power-efficient deployment stacks.
- May 2026: NVIDIA launched Cosmos 3, an open frontier foundation model for physical AI, with customization and deployment via NVIDIA NIM microservices on partner clouds such as Microsoft Azure. The release adds momentum to the packaged software and services layer around accelerators, encouraging more enterprise deployments toward standardized model-serving and lifecycle tooling.
- June 2024: The United States Food and Drug Administration reported a cumulative total of 521 AI-enabled medical devices cleared in 2024, marking a year-on-year increase cited at 40%. The expanding clearance base supports broader clinical deployment of deep learning in imaging, triage, and decision support, which increases the need for explainability, validation, and workflow integration capabilities.


Deep Learning Market Report Scope and Research Methodology
Market Definition and Coverage
For this study, the deep learning market covers revenue earned from deep neural network software and platforms, related training and inference services, and purpose-built accelerator hardware used to deploy models in cloud, on-premises, or edge environments.
Scope exclusions: We exclude conventional machine learning tools that do not use deep neural architectures, rules-based analytics engines, and internal R&D labor costs that are not sold as a commercial product or service.
Segments Covered in This Report
- By Offering
- Hardware
- Software and Services
- By End-user Industry
- BFSI
- Retail and eCommerce
- Manufacturing
- Healthcare and Life Sciences
- Automotive and Transportation
- Telecom and Media
- Security and Surveillance
- Other Applications
- By Application
- Image and Video Recognition
- Speech and Voice Recognition
- NLP and Text Analytics
- Autonomous Systems and Robotics
- Predictive Analytics and Forecasting
- Other Applications
- By Deployment Mode
- Cloud
- On-Premise
- By Geography
- North America
- United States
- Canada
- Mexico
- South America
- Brazil
- Argentina
- Rest of South America
- Europe
- Germany
- United Kingdom
- France
- Italy
- Spain
- Russia
- Rest of Europe
- Asia-Pacific
- China
- Japan
- India
- South Korea
- Australia
- Rest of Asia-Pacific
- Middle East and Africa
- Middle East
- Saudi Arabia
- United Arab Emirates
- Turkey
- Rest of Middle East
- Africa
- South Africa
- Nigeria
- Egypt
- Rest of Africa
- Middle East
- North America
Data Sources, Market Sizing, and Validation
Desk Research
Desk research starts with building a clean fact base on how fast AI workloads are scaling and where deep learning is being deployed. We refer to public sources such as the US Bureau of Economic Analysis and US Census datasets for macro and industry spending context, the International Telecommunication Union for connectivity indicators, and the OECD AI and digital economy statistics for adoption signals by region. For technical and use-case grounding, we also review peer-reviewed papers and proceedings (such as IEEE and ACM libraries) to understand model training trends, compute intensity, and common deployment patterns.
To connect the demand story with company activity, we review annual reports, investor decks, product documentation, and press releases from major ecosystem participants, which helps us map commercial offerings to a realistic revenue pool. Where needed, paid subscriptions are used for company financials and intelligence, patent lookups, and news and financials, so the model does not rely on a single disclosure. These sources also help track M&A and product launches that can shift revenue between years. The desk sources listed here are illustrative and not exhaustive, since additional public references are used for cross-checks and clarification.
Primary Interviews and Surveys
Primary work is used to pressure-test assumptions that desk sources do not clearly answer, such as how buyers split spend across software, services, and accelerators, and how quickly training workloads move to cloud or edge. We speak with a mix of technology providers, system integrators, and enterprise users across major regions so the sizing reflects adoption constraints like talent availability, compliance, and compute access, rather than announced plans only.
Distribution of primary research fieldwork respondents
| Company type | Respondent position | Region |
|---|---|---|
| Top tier: 29% | CXOs: 13% | APAC: 38% |
| Mid tier: 56% | Functional/Unit leaders: 35% | EMEA: 35% |
| Smaller Players: 15% | Managers: 52% | Americas: 27% |
Market-Sizing & Forecasting
Sizing is built using a top-down approach where compute demand and AI software spending indicators are reconstructed into a deep learning revenue pool, and then narrowed using adoption and deployment ratios validated in interviews. In practice, we map enterprise and cloud AI spend signals into deep learning specific shares, and then split totals across software and platforms, services for training and inference, and accelerator hardware used for deep learning workloads.
Several market fingerprints are used as inputs, such as accelerator shipment momentum and pricing direction, the cloud versus on-premises mix for training workloads, the pace of inference deployment at the edge, and cross-industry adoption in areas like healthcare imaging, financial risk analytics, and autonomous features in mobility. We also track signals such as data center expansion trends, AI talent availability as a deployment limiter, and policy or compliance changes that can slow rollouts in regulated industries. Where a bottom-up check is possible, sampled ASP times volume for accelerator categories and selective supplier and channel checks are used to validate the top-down totals and adjust outliers, especially when disclosure quality varies by region.
Forecasts are developed using scenario analysis supported by a light multivariate regression layer, where demand is linked to drivers like cloud AI investment, enterprise digitization pace, and compute cost trends, and then refined with expert views on adoption timing. When segment level gaps exist, we use proportional allocation based on the observed deployment mix and re-check the split during primary validation so the final numbers remain traceable and repeatable.
Data Validation & Update Cycle
Validation is handled through repeated triangulation across independent signals, including macro tech spending indicators, accelerator demand patterns, and adoption rates reported by users and integrators. If the model produces a jump that is not supported by at least two external checks, the assumptions are revisited and respondents are re-contacted to confirm what changed, such as pricing, procurement cycles, or deployment constraints.
Before sign-off, the dataset and calculations go through multi-step analyst review so currency conversions, year alignment, and segment splits are consistent across regions. The report is refreshed annually, and interim updates are made when material events occur, such as major regulatory moves or sudden shifts in accelerator supply. Right before delivery, a final pass is completed to ensure the narrative and numbers reflect the latest publicly available signals.
Mordor Intelligence's Deep Learning Market Size Versus Other Published Estimates
Published deep learning market numbers often vary because different studies do not count the same revenue lines, and they also use different base years and price assumptions. The spread is usually explained by how each publisher treats hardware versus software, which workloads are counted as deep learning, and how quickly adoption is assumed to scale across industries.
The benchmark table shows a meaningful gap across 2025 figures. In Mordor Intelligence's model, the value includes purpose-built deep learning accelerator hardware along with software platforms and training or inference services, while some other estimates either emphasize software-first revenue or fold in broader AI spending that is not strictly tied to deep neural network deployments.
Benchmark comparison
| Source | Market Size | Gaps in Research Methodology |
|---|---|---|
| Mordor Intelligence | USD 47.89 B (2025) | |
| Industry Research Publisher A | USD 34.28 B (2025) | Often framed more tightly around software and selected hardware categories, with less explicit capture of training and inference service revenue, which can pull down the 2025 total. |
| Industry Research Publisher B | USD 132.30 B (2025) | Typically uses a broader revenue pool that can overlap with general AI platforms and adjacent analytics spend, and the base-year setup and segment boundaries can inflate the deep learning-only total. |
Looking across the three numbers, most of the difference comes from scope boundaries and how each study ties revenue to deep learning-specific workloads. When the included revenue lines are clearly stated and cross-checked with adoption and compute signals, the resulting market size becomes easier to audit, reproduce, and use for planning.


Key Questions Answered in the Report
What is the current size of the deep learning market?
The deep learning market stands at USD 64.92 billion in 2026 and is projected to reach USD 296.23 billion by 2031.
Which segment is growing fastest in the deep learning market?
Hardware accelerators exhibit the highest growth, expanding at a 36.1% CAGR as firms upgrade infrastructure for larger models.
Why is healthcare the most dynamic end-user industry?
Regulatory clarity and FDA approvals have accelerated AI-enabled diagnostics, pushing healthcare to a 36.75% CAGR through 2031.
What are the main challenges facing deep learning adoption?
High energy consumption, cooling costs, and shortages of specialized talent are the leading restraints on market growth.
Page last updated on:


