Alternative Data Market Size and Share
Market Overview
| Study Period | 2020 - 2031 |
|---|---|
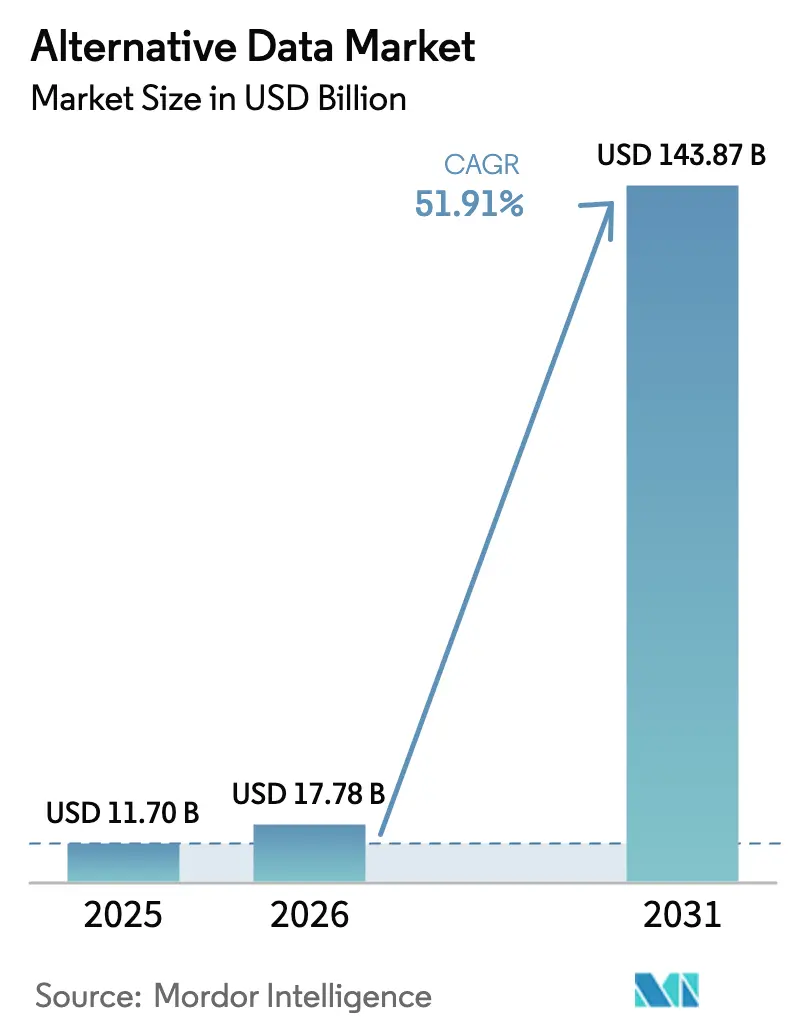
| Market Size (2026) | USD 17.78 Billion |
| Market Size (2031) | USD 143.87 Billion |
| Growth Rate (2026 - 2031) | 51.91% CAGR |
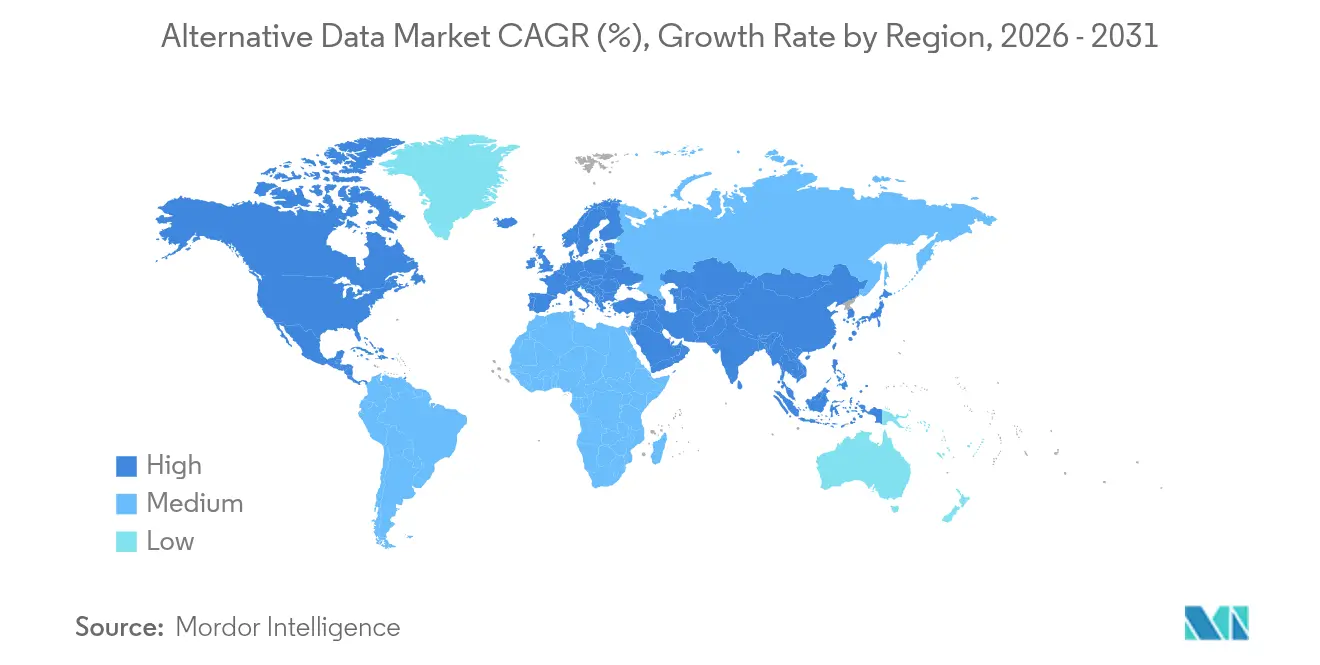
| Fastest Growing Market | Asia Pacific |
| Largest Market | North America |
| Market Concentration | Medium |
Major Players *Disclaimer: Major Players sorted in no particular order Image © Mordor Intelligence. Reuse requires attribution under CC BY 4.0. | |
Alternative Data Market Analysis by Mordor Intelligence
Alternative data market size in 2026 is estimated at USD 17.78 billion, growing from 2025 value of USD 11.70 billion with 2031 projections showing USD 143.87 billion, growing at 51.91% CAGR over 2026-2031. Generative AI’s appetite for novel datasets, heightened regulatory scrutiny, and cloud-native data pipelines are accelerating enterprise adoption beyond financial services. Rapid digitalization of retail, industrial, and public-sector workflows is expanding the addressable user base, while data-tokenization schemes create incremental revenue streams for data owners. M&A activity—illustrated by BlackRock’s USD 3.2 billion acquisition of Preqin—signals the strategic importance of scalable data platforms. Finally, Asia-Pacific’s regulatory sandboxes and fintech ecosystems are setting the stage for a geographically diversified growth trajectory.
Key Report Takeaways
- By data type, credit and debit card transactions led with 27.65% revenue share in 2025; geolocation records are projected to expand at a 55.74% CAGR to 2031.
- By end-user industry, BFSI held 33.05% of the alternative data market share in 2025, while retail and e-commerce post the highest forecast CAGR at 52.95% through 2031.
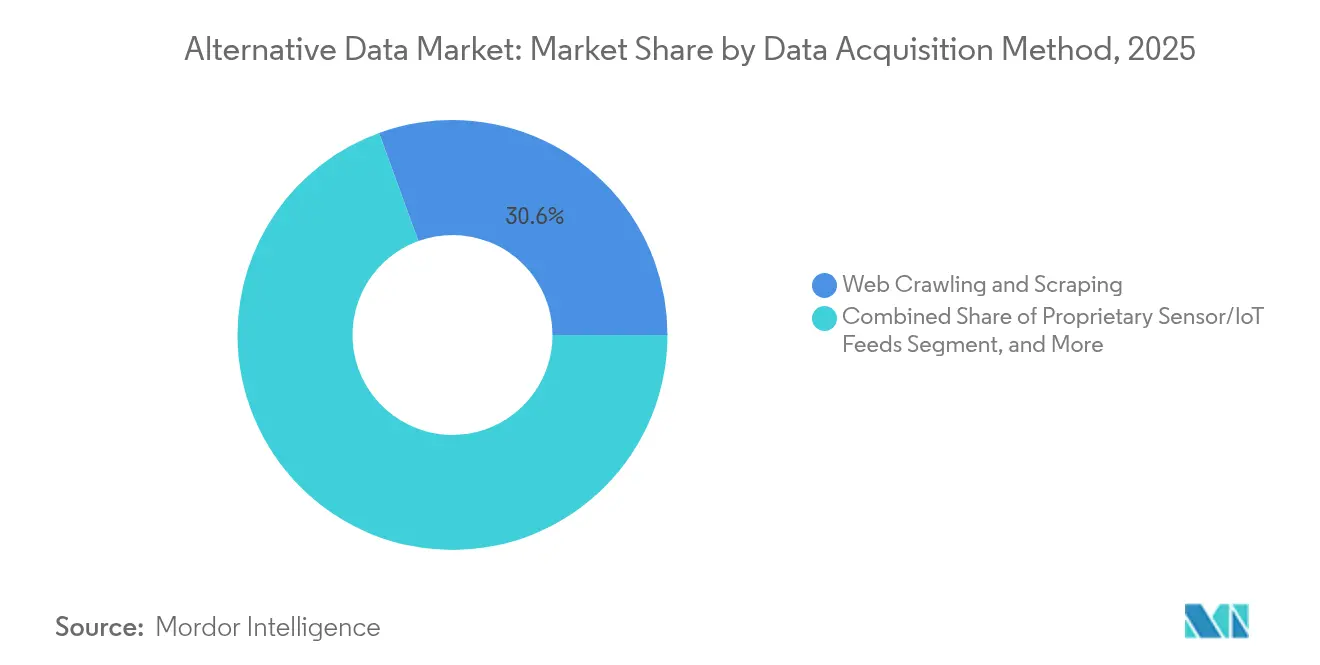
- By data acquisition method, web crawling and scraping accounted for 30.55% share of the alternative data market size in 2025; proprietary sensor/IoT feeds are advancing at a 59.08% CAGR.
- By application, investment signal generation controlled 37.45% of the alternative data market size in 2025; supply-chain optimization is growing fastest at 46.95% CAGR.
- By geography, North America commanded 47.85% of 2025 revenues, whereas Asia-Pacific is projected to grow at 44.92% CAGR to 2031.
Note: Market size and forecast figures in this report are generated using Mordor Intelligence’s proprietary estimation framework, updated with the latest available data and insights as of 2026.
Global Alternative Data Market Trends and Insights
Drivers Impact Analysis*
| Driver | (~) % Impact on CAGR Forecast | Geographic Relevance | Impact Timeline |
|---|---|---|---|
| Generative AI demand for novel datasets | +15.2% | Global; concentrated in tech hubs | Short term (≤ 2 years) |
| Surging buy-side data spend | +12.3% | North America and EU; spill-over to Asia-Pacific | Short term (≤ 2 years) |
| Accelerating digitalization and cloud pipelines | +9.7% | Global | Medium term (2-4 years) |
| Rising e-commerce transaction signals | +8.5% | Global; early gains in North America, Asia-Pacific core | Medium term (2-4 years) |
| Privacy-preserving synthetic data markets | +6.8% | EU and North America; expanding to Asia-Pacific | Long term (≥ 4 years) |
| Blockchain-based data tokenization | +4.1% | Global; early adoption in Singapore, Switzerland | Long term (≥ 4 years) |
| Source: Mordor Intelligence | |||
Generative AI demand for novel datasets
Generative AI systems require vast, diverse, and rights-cleared datasets, making the alternative data market a strategic supplier. Synthetic data is expected to account for 60% of all AI training corpora by 2024, lowering privacy risks while boosting model performance. High-profile agreements—such as Reddit’s USD 60 million annual licensing deal with Google—illustrate willingness to pay for curated data streams. The Dataset Providers Alliance, launched in June 2024, formalizes collective bargaining for data owners. Consequently, data providers that can negotiate robust licensing terms, assure provenance, and deliver privacy compliance are capturing outsized revenue growth.
Surging buy-side data spend
Hedge funds and asset managers are ramping budgets as traditional alpha sources erode. The 2024 Lowenstein Sandler survey found that 67% of professionals already deploy alternative data and 94% plan higher outlays in 2025. UBS’s “narrative alpha” framework, which applies NLP to news sentiment, highlights the shift from monolithic quantitative factors to contextual data overlays. This spending uptrend shortens sales cycles and supports premium pricing for differentiated datasets. Providers investing in pre-integrated analytics and compliance workflows are best positioned to service the sophisticated buy-side segment.
Accelerating digitalization and cloud-data pipelines
Modern cloud architectures facilitate real-time ingestion, transformation, and delivery of alternative data. LSEG’s multiyear partnership with Microsoft migrates terabytes of datasets onto Azure, enabling consumption-based pricing and elastic compute [1]London Stock Exchange Group, “Strategic Partnership with Microsoft Accelerates Data Platform Modernization,” lseg.com. Industrial IoT deployments further expand available signals; machine-learning models trained on sensor streams have improved demand-forecast accuracy by 15% in manufacturing and cut inventory inefficiencies by 10%. As organizations standardize APIs and adopt serverless processing, latency barriers erode, unlocking new time-critical use cases across supply chains and trading desks.
Privacy-preserving synthetic data markets
Heightened regulation—exemplified by the EU AI Act—drives demand for privacy-compliant alternatives to raw personal data. Advances in differentially private large-language-model inference allow enterprises to generate high-fidelity synthetic datasets with mathematically provable privacy guarantees. Vendors that combine policy expertise with generation tooling are attracting venture funding and partnerships, positioning the segment for sustained double-digit growth beyond 2028.
Restraints Impact Analysis*
| Restraint | (~) % Impact on CAGR Forecast | Geographic Relevance | Impact Timeline |
|---|---|---|---|
| Complex global privacy and data-residency rules | -7.2% | Global; most stringent in EU | Short term (≤ 2 years) |
| High total cost of premium datasets and tooling | -4.8% | Global; particularly affecting SMEs | Medium term (2-4 years) |
| Anti-scraping tech shrinking web signal pool | -6.1% | Global | Short term (≤ 2 years) |
| Alpha-decay as popular datasets crowd signals | -3.4% | Primarily North America and EU markets | Medium term (2-4 years) |
| Source: Mordor Intelligence | |||
Complex global privacy and data-residency rules
Fragmented regulations complicate cross-border data flows and inflate compliance costs. California’s draft Location Privacy Act mandates explicit opt-in consent and bans geolocation data sales without permission, while Singapore’s Personal Data Protection Commission has increased fines fivefold since 2021. Providers must invest in dynamic data-localization, consent-tracking, and audit capabilities, delaying product launches and dampening near-term revenue.
Anti-scraping technology shrinking web signal pool
Content owners deploy sophisticated defenses—such as Cloudflare’s AI-generated decoy pages and Akamai’s behavioral analytics—to curtail unauthorized harvesting. Although the January 2024 Bright Data versus Meta ruling affirmed limited rights to scrape public data, major publishers now default to crawler bans. The resulting drop in accessible web signals pressures providers that rely heavily on scraping to diversify into contractual data sources or proprietary sensors, reshaping cost structures and margin profiles.
*Our forecasts treat driver/restraint impacts as directional, not additive. The impact forecasts reflect baseline growth, mix effects, and variable interactions.
Segment Analysis
By Data Type: Geolocation Records Drive Privacy-Compliant Innovation
Credit and debit card datasets preserved leadership with 27.65% of 2025 revenues, underpinning earnings-prediction models that attain 90% accuracy for more than 5,000 firms. This mature stream anchors the alternative data market, ensuring stable cash flows even as regulatory scrutiny tightens. Geolocation records, however, are set to compound at 55.74% CAGR through 2031, supported by privacy-enhanced aggregation techniques that satisfy emerging laws without diluting analytic precision.Adoption accelerates as urban planners, retailers, and logistics firms exploit geospatial insights for site selection, footfall analytics, and route optimization. Industry groups such as the International Association of Privacy Professionals endorse pseudonymization protocols that strip personal identifiers yet preserve spatial granularity . Email receipts, sentiment feeds, and mobile app usage data add behavioral depth, while agricultural management signals gain relevance amid climate-driven yield volatility. Collectively, diversified streams fortify the alternative data market against single-source dependency.


By End-User Industry: Retail Transformation Accelerates Digital Adoption
BFSI retained 33.05% of the alternative data market share in 2025 by virtue of entrenched quantitative research budgets and stringent risk mandates. UBS Evidence Lab alone curates more than 55 specialized datasets to inform investment theses. Retail and e-commerce, though smaller, is projected to expand at 52.95% CAGR as merchants embed AI-driven personalization and inventory analytics into omnichannel workflows.Digital wallets accounted for one-half of global e-commerce spend in 2023, and consumer willingness to use AI for shopping jumped 47%, illustrating the behavioral shift that fuels data demand. Telecommunication providers, automotive OEMs, and manufacturers follow, leveraging IoT sensors for predictive maintenance. Energy traders tap satellite imagery to inform exploration and hedging strategies, revealing the breadth of sectoral pull for alternative intelligence.
By Data Acquisition Method: IoT Sensors Enable Real-Time Intelligence
Web crawling and scraping delivered 30.55% of 2025 revenue, keeping the alternative data market anchored despite escalating legal risks. The alternative data market size for web-scraped feeds is expected to plateau as content controls tighten. In contrast, proprietary sensor/IoT feeds are forecast to grow at 59.08% CAGR, offering continuous, high-frequency observations that boost model freshness.Enterprises deploying low-cost edge sensors capture temperature, vibration, and location data that inform maintenance schedules and supply-chain visibility. Crowd-sourced platforms gain foothold through gamified participation models, while transactional partnerships with payment networks supply structured spend data. Public filings remain indispensable for regulatory compliance and entity resolution tasks, ensuring a balanced acquisition portfolio.
By Application: Supply-Chain Optimization Emerges as Growth Leader
Investment signal generation continued to dominate with 37.45% of 2025 spending, reinforcing the historical link between hedge funds and the alternative data market. The alternative data market size allocated to supply-chain optimization is now expanding at 46.95% CAGR as manufacturers seek resilience amid geopolitical shocks.Machine-learning engines trained on multimodal sensor, weather, and trade-flow data improve demand forecasts by 15% and raise order-fulfillment accuracy to 95%. Fraud detection, market intelligence, and customer-behavior analytics likewise benefit from enriched feature sets, demonstrating the horizontal versatility of alternative data.
Geography Analysis
North America maintained 47.85% revenue share in 2025, buoyed by mature capital markets and deep quantitative-research talent pools. FactSet reported USD 570.7 million in Q2 2025 revenues, with 4.1% organic subscription growth tied to expanded alternative datasets . State-level privacy divergences, however, complicate compliance, prompting providers to adopt jurisdiction-aware data pipelines.Asia-Pacific is projected to register a 44.92% CAGR to 2031, underpinned by regulatory sandboxes in Singapore, Australia, and Taiwan. The Monetary Authority of Singapore’s AI model-risk guidelines encourage banks to pilot alternative data while safeguarding consumers, catalyzing local demand. Fintech startups in India and Indonesia further amplify dataset supply, leveraging large unbanked populations and mobile-first behaviors.Europe’s growth remains steady as the EU AI Act codifies transparency obligations. While compliance costs rise, standardization lifts investor confidence and fosters cross-border data commerce. Industry coalitions are pioneering synthetic-data exchanges to navigate stringent GDPR restrictions. Latin America, the Middle East, and Africa are nascent but promising; improving telecom infrastructure and open-banking mandates hint at future upside, albeit from a low base.

Competitive Landscape
Incumbent financial-information vendors, specialist data boutiques, and cloud hyperscalers converge in a market that shows moderate concentration. BlackRock’s USD 3.2 billion purchase of Preqin underscores strategic moves by asset managers to internalize dataset supply chains. Simultaneously, BattleFin’s acquisition of Exabel integrates discovery and analytics, hinting at platform consolidation. FactSet complements core terminals with managed-services offerings that bundle compliance and entitlement workflows, while UBS Evidence Lab champions proprietary coverage across 55 domains.
Technological differentiation is pivotal. Dataminr secured USD 185 million in 2025 to scale predictive AI, achieving USD 200 million ARR and nearly 80% gross margins. Providers invest in synthetic-data generators, context-aware labeling, and edge-stream ingestion to enhance accuracy and reduce latency. Blockchain-based tokenization pilots in Singapore and Switzerland explore micro-royalty distributions, creating novel monetization channels for primary data owners.
Emerging disruptors leverage serverless architectures and open APIs to reduce onboarding friction. Privacy-enhancing computation, zero-knowledge proofs, and federated-learning frameworks differentiate next-generation vendors, aligning with tightening data-sovereignty rules. As customer demand gravitates toward integrated platforms offering search, transform, and model-ready feeds, point-solution specialists face pressure to partner or exit, propelling continuous MandA cycling.
Alternative Data Industry Leaders
1010Data Inc.
Dataminr Inc.
M Science LLC
RavenPack International S.L.
YipitData Inc.
- *Disclaimer: Major Players sorted in no particular order

Recent Industry Developments
- June 2025: Bloomberg added Similarweb’s web-traffic data to its ALTD terminal function, broadening real-time coverage to 3,000 entities.
- June 2025: Creditinfo Kenya partnered with Kamoa to embed alternative data into SME credit-decision models.
- June 2025: TransUnion made a minority investment in Omnisient to advance privacy-preserving data collaboration across consumer ecosystems.
- December 2024: BattleFin acquired Exabel, combining data discovery and analytics capabilities under one umbrella.


Global Alternative Data Market Report Scope
Alternative data refers to information sourced from unconventional channels. For investors, this often entails seeking insights beyond standard company filings and broker recommendations to gain a competitive advantage. Instances of alternative data encompass credit card transactions, social media discussions, product evaluations, and satellite imagery.
The Report Covers Alternative Data Companies and the Market is Segmented by Data Type (Credit & Debit Card Transactions, Email Receipts, Geo-Location (Foot Traffic) Records, Mobile Application Usage, Harvesting Management, Social & Sentiment Data, Web Scraped Data, Web Traffic, Other Data Types), by End-User Industries (BFSI, Automotive and Machine Parts, Oil & Energy, Industrial, IT & Telecommunications, Retail). The Market Sizes and Forecasts are Provided in USD for all the Above Segments.
| Credit and Debit Card Transactions |
| E-mail Receipts |
| Geo-location (Foot-traffic) Records |
| Mobile App Usage |
| Harvesting / Agriculture Management Data |
| Social and Sentiment Feeds |
| Web-scraped Data |
| Web Traffic |
| Other Data Types |
| BFSI |
| Retail and E-commerce |
| IT and Telecommunications |
| Automotive and Industrial Manufacturing |
| Oil and Energy |
| Others (Healthcare, Media, etc.) |
| Proprietary Sensor/IoT Feeds |
| Web Crawling and Scraping |
| Transactional/Panel Partnerships |
| Crowd-sourced Platforms |
| Public Records and Filings |
| Investment Signal Generation |
| Risk Management and Fraud Detection |
| Competitive and Market Intelligence |
| Customer Behavior Analytics |
| Supply-chain and Logistics Optimization |
| North America | United States | |
| Canada | ||
| Mexico | ||
| South America | Brazil | |
| Argentina | ||
| Rest of South America | ||
| Europe | Germany | |
| United Kingdom | ||
| France | ||
| Italy | ||
| Spain | ||
| Russia | ||
| Rest of Europe | ||
| Asia-Pacific | China | |
| Japan | ||
| India | ||
| South Korea | ||
| Australia and New Zealand | ||
| Rest of Asia-Pacific | ||
| Middle East and Africa | Middle East | Saudi Arabia |
| United Arab Emirates | ||
| Turkey | ||
| Rest of Middle East | ||
| Africa | South Africa | |
| Nigeria | ||
| Egypt | ||
| Rest of Africa | ||
| By Data Type | Credit and Debit Card Transactions | ||
| E-mail Receipts | |||
| Geo-location (Foot-traffic) Records | |||
| Mobile App Usage | |||
| Harvesting / Agriculture Management Data | |||
| Social and Sentiment Feeds | |||
| Web-scraped Data | |||
| Web Traffic | |||
| Other Data Types | |||
| By End-User Industry | BFSI | ||
| Retail and E-commerce | |||
| IT and Telecommunications | |||
| Automotive and Industrial Manufacturing | |||
| Oil and Energy | |||
| Others (Healthcare, Media, etc.) | |||
| By Data Acquisition Method | Proprietary Sensor/IoT Feeds | ||
| Web Crawling and Scraping | |||
| Transactional/Panel Partnerships | |||
| Crowd-sourced Platforms | |||
| Public Records and Filings | |||
| By Application | Investment Signal Generation | ||
| Risk Management and Fraud Detection | |||
| Competitive and Market Intelligence | |||
| Customer Behavior Analytics | |||
| Supply-chain and Logistics Optimization | |||
| By Geography | North America | United States | |
| Canada | |||
| Mexico | |||
| South America | Brazil | ||
| Argentina | |||
| Rest of South America | |||
| Europe | Germany | ||
| United Kingdom | |||
| France | |||
| Italy | |||
| Spain | |||
| Russia | |||
| Rest of Europe | |||
| Asia-Pacific | China | ||
| Japan | |||
| India | |||
| South Korea | |||
| Australia and New Zealand | |||
| Rest of Asia-Pacific | |||
| Middle East and Africa | Middle East | Saudi Arabia | |
| United Arab Emirates | |||
| Turkey | |||
| Rest of Middle East | |||
| Africa | South Africa | ||
| Nigeria | |||
| Egypt | |||
| Rest of Africa | |||


Key Questions Answered in the Report
What is the current size of the alternative data market in 2026?
The alternative data market reached USD 17.78 billion in 2026.
How fast is the alternative data market expected to grow?
Analysts forecast a 51.91% CAGR, taking the market to USD 143.87 billion by 2031.
What is driving enterprise adoption beyond finance?
Generative AI’s need for diverse training corpora, cloud-native pipelines, and supply-chain resilience initiatives broaden use cases across industries.
How concentrated is the vendor landscape?
The market exhibits moderate concentration, with platform-level acquisitions creating integrated offerings yet room remains for niche innovators.
Page last updated on:


