Data Center UPS Market Size and Share
Market Overview
| Study Period | 2020 - 2031 |
|---|---|
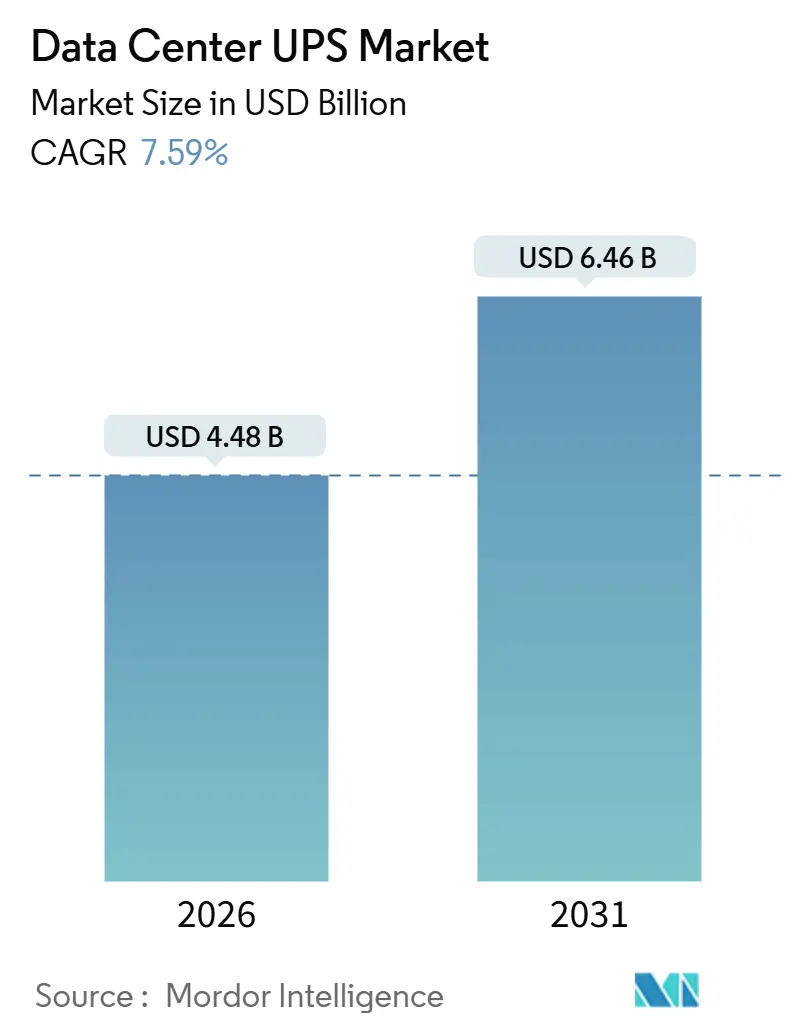
| Market Size (2026) | USD 4.48 Billion |
| Market Size (2031) | USD 6.46 Billion |
| Growth Rate (2026 - 2031) | 7.59% CAGR |
| Fastest Growing Market | Asia Pacific |
| Largest Market | North America |
| Market Concentration | Medium |
Major Players *Disclaimer: Major Players sorted in no particular order Image © Mordor Intelligence. Reuse requires attribution under CC BY 4.0. | |
Data Center UPS Market Analysis by Mordor Intelligence
The data center UPS market size stood at USD 4.48 billion in 2026 and is projected to reach USD 6.46 billion by 2031, reflecting a 7.59% CAGR. This outlook captures how artificial intelligence workloads, rising rack power density, and sovereign data-sovereignty policies are steering operators toward double-conversion and modular topologies that sustain continuous high-current loads while keeping thermal risk in check. Vendors are redesigning inverter stages around silicon-carbide semiconductors to offset supply-chain shocks, and lithium-ion battery economics have hit total-cost-of-ownership parity in systems above 500 kVA, nudging the data center UPS market toward chemistries that enable grid-interactive storage. Edge deployments in retail and telecom add a distributed, small-form-factor layer of demand that challenges legacy sales channels yet broadens the customer base. At the same time, data-center moratoriums in leading European metros divert capital toward secondary cities and accelerate the shift to liquid cooling, which reduces upstream UPS sizing.
Key Report Takeaways
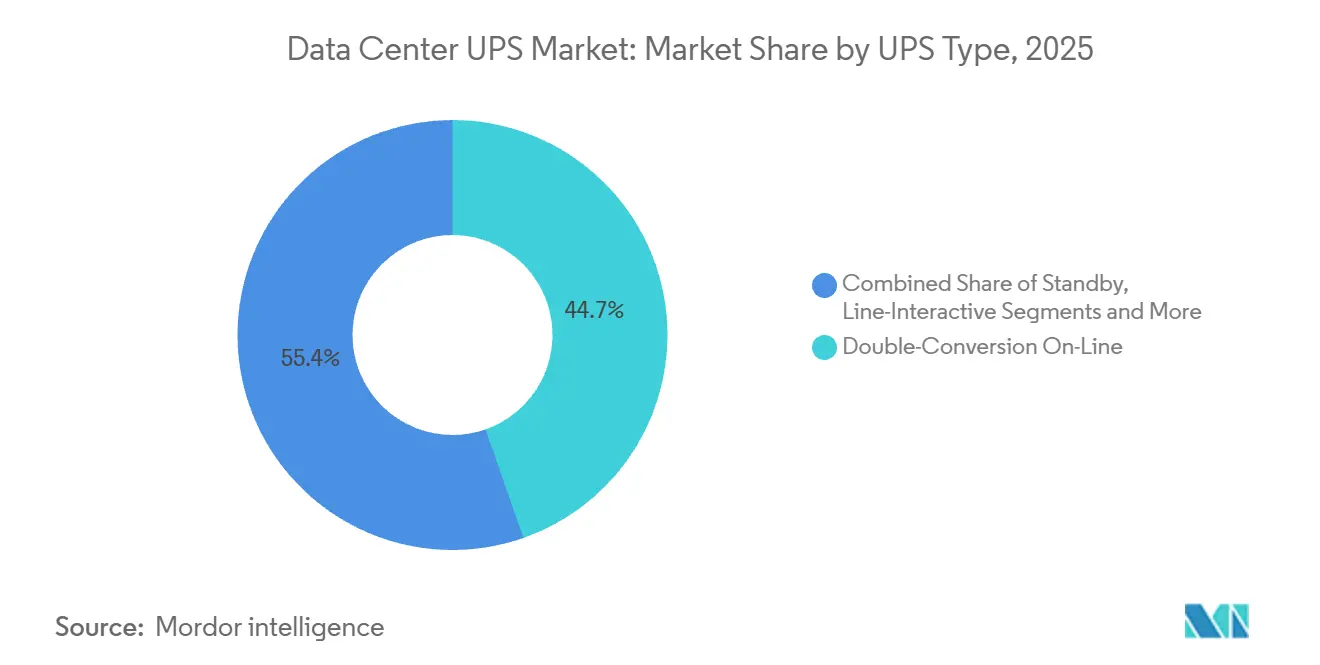
- By UPS type, double-conversion on-line units held 44.65% of data center UPS market share in 2025, while modular and parallel-redundant systems are advancing at an 8.13% CAGR through 2031.
- By power capacity, systems above 200 kVA captured 52.23% of the data center UPS market size in 2025 and are poised to expand at an 8.56% CAGR to 2031.
- By architecture, centralized platforms retained 46.21% revenue share in 2025, whereas modular scalable configurations are rising at an 8.72% CAGR.
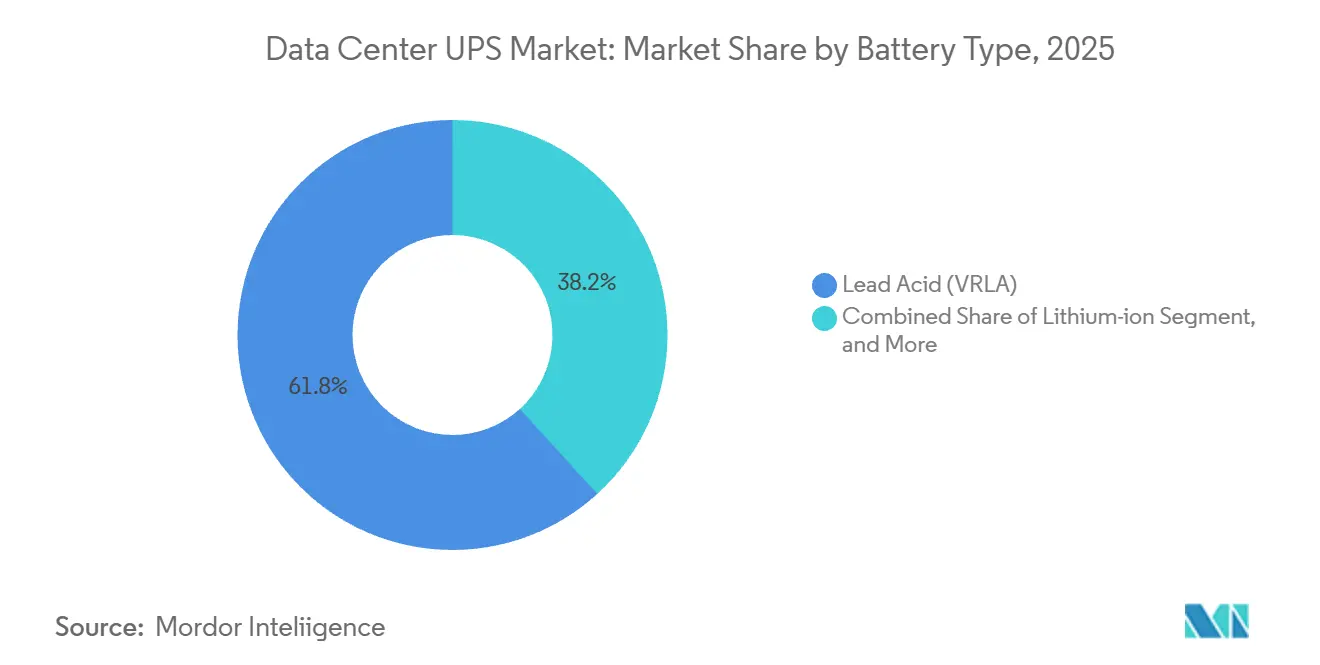
- By battery chemistry, valve-regulated lead-acid commanded 61.76% share in 2025, yet lithium-ion solutions are growing at an 8.29% CAGR.
- By tier type, tier 3 facilities accounted for 54.45% of 2025 demand; tier 4 is the fastest-growing tier at a 9.06% CAGR.
- By data center size, large sites held 38.88% share in 2025, while hyperscale campuses are expanding at a 9.11% CAGR.
- By data center type, colocation providers captured 45.86% share in 2025, yet hyperscalers and CSPs are accelerating at a 9.21% CAGR.
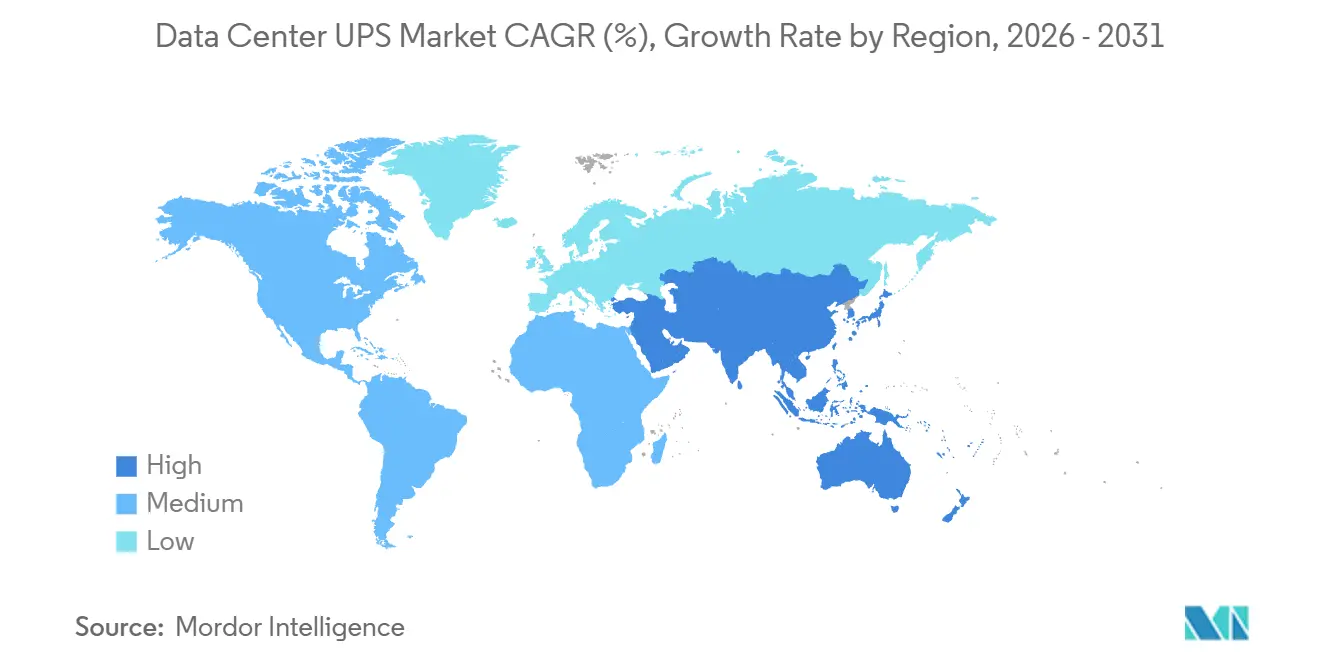
- By geography, North America led with 39.43% share in 2025, whereas Asia-Pacific is the fastest-growing region at a 9.02% CAGR.
Note: Market size and forecast figures in this report are generated using Mordor Intelligence’s proprietary estimation framework, updated with the latest available data and insights as of January 2026.
Market Trends and Insights
Drivers Impact Analysis of Data Center UPS Market*
| Driver | (~) % Impact on CAGR Forecast | Geographic Relevance | Impact Timeline |
|---|---|---|---|
| Hyperscale Data-Center Build-Outs Accelerating ≥10 MW Facilities | +2.1% | Global with hubs in North America and Asia-Pacific | Medium term (2-4 years) |
| AI and ML Workload Power-Density Surge ≥20 kW per Rack | +1.8% | North America and Europe | Short term (≤ 2 years) |
| Edge Micro-Data-Center Proliferation in Retail and Telecom | +1.3% | Asia-Pacific core, Middle East and Africa spill-over | Medium term (2-4 years) |
| Lithium-Ion TCO Advantage Over VRLA in ≥500 kVA UPS | +1.2% | North America and Europe, expanding to Asia-Pacific | Long term (≥ 4 years) |
| Carbon-Neutral Procurement Mandates by Hyperscalers | +0.9% | Europe and North America | Long term (≥ 4 years) |
| Mandatory Tier III+ Uptime Compliance in Emerging Markets | +0.8% | Asia-Pacific, Middle East, South America | Medium term (2-4 years) |
| Source: Mordor Intelligence | |||
Hyperscale Data-Center Build-Outs Accelerating ≥10 MW Facilities
Hyperscale operators commissioned 47 campuses above 10 MW in 2025, a 38% annual jump that locks in multi-year UPS procurement pipelines. Typical site designs deploy four to six 2-3 MVA strings, creating single-contract values of USD 15 million or more and spurring vendor customization of cooling interfaces and battery enclosure formats. Utilities in Northern Virginia and Singapore now quote interconnection queues of 36-48 months, so developers specify UPS units with diesel rotary backup to bridge multi-hour grid outages. Modular frames that scale in 500 kVA steps let builders phase capital alongside server rack deployments, trimming idle capacity losses. Sovereign-AI rules in the European Union and India add another wave of 5-8 MW installations, broadening the hyperscale footprint beyond legacy North American hubs.
AI and ML Workload Power-Density Surge ≥20 kW per Rack
Training clusters exceeded 100 kW per rack in 2026, eclipsing the 15-20 kW norm seen just two years earlier. [1]Kevin Brown, “Rack Power Density Trends in AI Clusters,” Dell Technologies, dell.com This step-change forces UPS makers to redesign power distribution units capable of carrying 400 A continuous currents without voltage sag. Centralized rooms struggle at these densities because long copper runs incur resistive losses, catalyzing a shift to row-level modules situated within 10 m of the load. Direct-to-chip liquid cooling eliminates parasitic fan power, enabling operators to downsize rated UPS capacity by up to 20%. Floor-space savings from lithium-ion batteries, which pack 250 Wh/l compared with 80 Wh/l for VRLA, free up extra rack positions and reduce per-rack UPS cost. The complexity uptick widens a skills gap, steering buyers toward turnkey contracts that bundle installation, commissioning, and remote monitoring.
Edge Micro-Data-Center Proliferation in Retail and Telecom
Telecom carriers rolled out more than 12,000 edge nodes in 2025 to support 5G radio networks, each embedding 10-50 kVA of UPS capacity in cramped cabinets. [2]Johan Malm, “5G Edge Data Centers and Power,” Ericsson, ericsson.com Retail chains follow suit, hosting in-store analytics that demand sub-10 ms latency. These buyers favor line-interactive designs, 40% cheaper and half the rack-units of double-conversion systems, yet they accept shorter runtimes. Lithium-ion’s 10-15-year lifespan eliminates mid-contract battery swaps across thousands of dispersed sites. Logistics-heavy volume pushes the channel dynamics of the data center UPS market toward contract manufacturers that can deliver thousands of units in weeks, eroding incumbent share.
Lithium-Ion TCO Advantage Over VRLA in ≥500 kVA UPS
In 2025 lithium-ion reached life-cycle cost parity with VRLA at 500 kVA and above after cycle-life gains extended replacement windows from five to 12 years, shaving 28% from the net present value of battery spend. A 1 MVA lithium-ion frame occupies 60% of VRLA floor space and sheds 40% less heat, unlocking extra racks inside the same white space and boosting revenue per square meter. Fire-safety upgrades compliant with UL 9540A and NFPA 855 add USD 50,000-100,000 but satisfy insurers, accelerating adoption. Grid-interactive discharge into wholesale markets generates ancillary revenue where regulations permit, further tipping economics in lithium-ion’s favor. The shift is creating a secondary recycling stream for retired VRLA batteries that concentrates in North America and Europe.
Restraints Impact Analysis of Data Center UPS Market*
| Restraint | (~) % Impact on CAGR Forecast | Geographic Relevance | Impact Timeline |
|---|---|---|---|
| Upfront CAPEX Premium ≈35% of Double-Conversion Topology | -1.4% | Global, most acute for small and medium enterprises | Short term (≤ 2 years) |
| Supply-Chain Volatility for Power Electronic Components | -1.1% | Global, shortages in North America and Europe | Short term (≤ 2 years) |
| Grid-Interactive Energy-Storage Regulations Still Nascent | -0.7% | North America and Europe, limited Asia-Pacific impact | Medium term (2-4 years) |
| Data-Center Moratoriums on Water and Energy Use in EU Metros | -0.6% | Europe, potential spill-over to other metros | Medium term (2-4 years) |
| Source: Mordor Intelligence | |||
Upfront CAPEX Premium ~35% of Double-Conversion Topology
Double-conversion systems cost roughly 35% more than line-interactive models because they employ dual inverter stages and larger heat sinks, stretching capital budgets for enterprises targeting Tier III compliance. Leasing programs now package UPS capacity as a service, converting capex into opex and easing adoption, but finance rates in emerging markets still exceed 10%, dampening uptake. Modular frames that scale in 100-500 kVA blocks let buyers defer cash, yet interoperability issues such as mismatched firmware or load-sharing logic can expose hidden reliability risks. Lower-priced Chinese imports offer an alternative, but concerns around intellectual property and after-sales support curb penetration outside Asia-Pacific. The price gap therefore limits the addressable segment of the data center UPS market among budget-sensitive owners.
Supply-Chain Volatility for Power Electronic Components
Lead times for insulated-gate bipolar transistors and film capacitors ballooned to 52 weeks in 2025 as electric-vehicle and solar-inverter demand hijacked fab capacity. Vendors responded by redesigning inverter stacks around silicon-carbide switches that cut switching losses by 30% and tolerate 200 °C junctions, yet new gate drivers and thermal interfaces add up to 18 months of development. Buffer inventory levels tripled to 24 weeks, tying up working capital and slicing 2-3 percentage points from gross margin. Export controls on advanced lithography tools restrict Chinese foundries to lower-voltage parts, splitting supply chains by region. Several OEMs acquired component distributors in 2025 to secure allocation, but risk holding surplus stock if supply normalizes.
*Our forecasts treat driver/restraint impacts as directional, not additive. The impact forecasts reflect baseline growth, mix effects, and variable interactions.
Data Center UPS Market Segment Analysis
By UPS Type:
Modular Systems Align With Pay-As-You-Grow BudgetsModular and parallel-redundant frames are set to expand at an 8.13% CAGR, outrunning the broader data center UPS market. [3]Guillaume Dufour, “Galaxy VL Modular UPS Overview,” Schneider Electric, se.com Double-conversion online units still dominate with a 44.65% share in 2025, anchored in Tier III and Tier IV halls that need seamless failover. Line-interactive products retain a niche in small-enterprise rooms because their 40% cost advantage compensates for harmonic distortion and shorter runtime, while standby units populate edge cabinets, chasing ultra-low capex. [4]Tim O’Brien, “Liebert EXL S1 Centralized UPS,” Vertiv, vertiv.com Rotary and flywheel designs serve facilities that demand sub-20s ride-through for diesel generator fire, trading battery maintenance for mechanical complexity.
Rising rack densities tilt the procurement calculus toward modularity because data hall load can jump from 500 kVA to 2 MVA inside a single lease cycle. Frames that click in 100-500 kVA increments avoid the efficiency penalty of operating at 30% load, lifting annualized power-usage effectiveness. Software-defined control layers orchestrate load-sharing, but they introduce firmware-management risk that operators must audit. As a result, modular penetration continues to climb in tandem with colocation leasing models that meter power on demand.


By Power Capacity:
AI Workloads Propel >200 kVA String AdoptionSystems above 200 kVA represented 52.23% of 2025 revenue and are forecast to post an 8.56% CAGR to 2031, ahead of overall market velocity. AI training clusters exceeding 100 kW per rack routinely require parallel UPS strings, validating the economics of large-frame systems.
The 21-200 kVA tier underpins enterprise and regional colocation halls, where power density remains below 15 kW per rack. Sub-20 kVA units inhabit edge nodes in retail and telecom and face price compression from server-rack-integrated cartridges that eliminate the need for external cabinets. Consolidation of enterprise sites into megawatt campuses further swells demand for large frames.
By Architecture:
Distributed Row-Level Modules Shrink LossesCentralized halls still held a 46.21% share in 2025, but distributed architectures are advancing at an 8.72% CAGR as operators hunt for energy savings and faster repairs. Positioning UPS modules within 10 m of the load cuts copper losses by up to 5%.
Tier IV facilities, however, continue to prefer 2N+1 centralized layouts that simplify certification audits. Phased buildouts reward distributed designs because initial fit-out can start with a single row, deferring 40-60% of UPS capital until tenant demand materializes. Retrofit sites often stick with centralized rooms, given sunk costs in switchgear and busway.
By Battery Type:
Lithium-Ion Narrows the Cost GapValve-regulated lead-acid batteries maintained 61.76% share in 2025, yet lithium-ion chemistries are gathering pace at an 8.29% CAGR as footprint, heat profile, and life-cycle attributes eclipse the 35% price premium.
In frames above 500 kVA, lithium-ion’s 60% smaller footprint directly converts to billable rack rows. Safety codes once curbed adoption, but integrated suppression systems now satisfy NFPA 855 for under USD 100,000. VRLA still wins in budget-tight rooms where five-year battery swaps align with IT refresh cycles. Daily-cycle tolerance positions lithium-ion batteries to earn demand-response revenue in deregulated power markets.
By Tier Type:
Tier IV Gains Momentum in Regulated VerticalsTier III halls contributed 54.45% of 2025 demand, acting as the colocation workhorse. Tier IV is projected to climb at a 9.06% CAGR, spurred by financial services and healthcare penalties north of USD 1 million per hour of downtime.
Sovereign-AI rules mandate domestic hosting of citizen data, accelerating Tier IV builds across India and the European Union. Tier I and II counts dwindle as workloads shift to cloud, squeezing the low-end UPS market. Insurers increasingly write Tier III minimum clauses into cyber-risk policies, nudging legacy halls toward upgrades.
By Data-Center Size:
Hyperscale Campuses Lead Expansion CurveLarge sites (1-10 MW) held a 38.88% share in 2025, but hyperscale campuses will grow fastest at a 9.11% CAGR, riding on cloud giants’ pledge to add 15 GW of new capacity by 2027. Hyperscalers leverage volume, commanding 15-20% equipment discounts and priority allocation during semiconductor crunches.
Small rooms under 1 MW are stagnating as workloads shift to SaaS platforms. Medium sites retain regional relevance but face rising power costs. Developers secure grid capacity years in advance and integrate diesel rotary backup to ensure resilience while waiting on utility upgrades.

By Data-Center Type:
Hyperscalers Rise, Colocation Holds GroundColocation operators accounted for 45.86% revenue in 2025 and remain vital for interconnection ecosystems. Hyperscalers and CSPs will outpace the market at a 9.21% CAGR, driven by budgets aligned with sovereign data mandates and AI training demand.
Wholesale leases priced 20-30% below retail force colocation firms to pivot toward high-margin cross-connects. Enterprises adopt UPS-as-a-service deals to move capex off balance sheets. Edge sites favor 42U-compatible line-interactive frames with lithium-ion batteries that non-specialist staff can replace.
Geography Analysis
North America Data Center UPS Market
North America controlled 39.43% of 2025 revenue thanks to hyperscale density in Northern Virginia, Silicon Valley, and Dallas-Fort Worth. Growth moderates as land scarcity and 48-month utility queues push investors toward Phoenix, Atlanta, and Columbus. Canada uses hydroelectric surplus and cool weather to attract hyperscalers, yet cross-border data rules complicate U.S. workload placement. Mexico eyes grid upgrades in Monterrey and Querétaro to capture nearshoring demand. Lithium-ion penetration exceeded 40% of 2025 installs, underscoring TCO priorities. The region leads Tier IV adoption with more than 120 certified halls.
APAC Data Center UPS Market
Asia-Pacific is set for a 9.02% CAGR as China’s tier-2 cities entice builds with cheap renewable power while tier-1 metros face energy caps. India’s colocation surge rides on digital payment growth and data-localization mandates, though 4-6-hour monthly grid outages force oversizing of UPS strings. Singapore partially lifted its 2019 build cap in 2024, but only for facilities that achieve power-usage effectiveness below 1.3. Japan and Australia maintain mature Tier III footprints but wrestle with land scarcity that favors modular UPS frames. Southeast Asia, particularly Malaysia and Indonesia, sees edge demand tied to mobile commerce, with deployments clustering in the 20-100 kVA band.
EMEA and South America Data Center UPS Market
Europe accounted for roughly 25% of global spend in 2025, yet growth slows where city moratoriums cap water or power allocations. The Carbon Border Adjustment Mechanism effective 2026 penalizes carbon-heavy component supply chains, nudging procurement toward renewable-powered fabs in Scandinavia and Germany. Sovereign-AI mandates accelerate Tier IV builds, boosting secondary metros like Stockholm and Milan. The United Kingdom benefits from post-Brexit data rules, while Southern Europe leverages solar power and cheaper land to rival historic hubs. South America stays sub-scale, though Brazil’s data-sovereignty law and Chile’s green energy draw early movers. The Middle East accelerates with USD 10 billion earmarked for regional AI hubs, and Africa’s pockets of growth center on South Africa and Nigeria where telecom-led edge builds take root.

Regulatory Landscape
Regulation affecting data center UPS procurement is anchored in efficiency and test-method conformity, alongside broader power-capacity constraints on new data center connections. In the United States, the ENERGY STAR Uninterruptible Power Supplies specification (Version 2.0) ties efficiency measurement to IEC 62040-3 test methodologies, and state energy codes add stricter requirements for new builds. For example, the California Title 24 2025 Energy Code effective January 1, 2026 includes a 96% (or better) average efficiency requirement for UPS in new data center construction.
Outside the US, compliance requirements span telecom and data-center-specific equipment rules, as well as sustainability-driven siting policies. India Telecommunication Engineering Centre (TEC) issued GR 66140:2025 (generic requirements for SMPS-based UPS), shaping qualification expectations for suppliers serving telecom and data center applications. In Canada, British Columbia BC Reg. 8/2026 in January 2026 creates electricity capacity limitations for new data center facilities, while Vermont passed H.727 in May 2026 to establish a framework for sustainable data center deployment, including demand-side management requirements. In Europe, Commission Regulation (EU) 2019/424 mandates ecodesign requirements for servers and data storage products, which carries knock-on impacts for integrated power infrastructure choices. Draft work such as prEN 50600-2-2:2026 also points to continued standardization of data center power supply and distribution practices.
Value Chain Analysis
The data center UPS value chain starts with upstream inputs including power semiconductors (IGBTs and emerging silicon-carbide devices), magnetics and materials (grain-oriented electrical steel and copper), passives (film capacitors), and batteries (VRLA and lithium-ion). It then moves into OEM design and assembly of rectifier-inverter stages, bypass/switchgear integration, battery cabinets, and monitoring electronics. In 2025, supply-chain volatility for power electronic components and long lead times pushed OEMs toward redesigns, including inverter stacks shifting toward silicon-carbide, while also increasing the use of buffer inventory strategies. Project scheduling is further constrained by adjacent electrical infrastructure such as switchgear and transformers, where lead times can extend materially.
Downstream, vendors sell through direct hyperscale/colocation framework agreements, electrical contractor and EPC channels, and distributor-led programs for smaller enterprise and edge deployments. Buyers have shifted from just-in-time to just-in-case procurement, including pre-booking modular power-skid slots and locking critical components earlier in the build cycle, reflecting the report's 52-week component lead times in 2025 and the growing role of vertical integration and strategic sourcing. Service, commissioning, and lifecycle maintenance, including condition-based monitoring, are also expanding, particularly for modular and distributed architectures that require firmware governance, periodic acceptance testing, and battery safety compliance.
Competitive Landscape
The data center UPS market is moderately concentrated. Western incumbents differentiate on lithium-ion integration and grid-interactive software that promises ancillary revenue, whereas Asian challengers compete on lower capex, pricing double-conversion frames 20-25% below incumbents. Edge deployments create white-space for contract manufacturers that can ship thousands of 10-50 kVA units on short notice, eroding legacy vendor share.
Modular architectures disrupt the competitive playbook because power rating alone no longer wins deals; instead, software-defined power management and predictive maintenance capabilities tip the scales in procurement's favor. Patent filings for silicon-carbide switches and high-temperature thermal interfaces underscore an innovation race, with Vertiv and Eaton holding over 40 intellectual property grants for high-temperature inverter designs. Several OEMs pursued vertical integration in 2025, acquiring battery makers and semiconductor distributors to lock in scarce parts and boost margin capture.
Hyperscalers pressure margins by standardizing specifications and running competitive auctions among seven or more suppliers, slicing 2-3 percentage points off gross profit. Vendors counter with financing models such as UPS-as-a-service that shift cost from capital to operating budgets, resonating with enterprise buyers. Emerging disruptors bundle hardware with energy-arbitrage algorithms, but limited regulatory clarity outside California and Texas tempers near-term scale. Compliance with IEC 62040 remains table stakes, yet reference designs that already hold Uptime Institute Tier Certification gain preferential status in bid shortlists.
Data Center UPS Industry Leaders
ABB Ltd
Schneider Electric
Eaton Corporation
Vertiv Holdings Co
Huawei Technologies Co. Ltd.
- *Disclaimer: Major Players sorted in no particular order
Data Center UPS Market Companies Covered in this Report
- ABB Ltd
- Schneider Electric SE
- Eaton Corporation plc
- Vertiv Holdings Co.
- Huawei Technologies Co. Ltd.
- Power Innovations International LLC
- Mitsubishi Electric Corp.
- Riello Elettronica S.p.A
- SOCOMEC Group S.A.
- Piller Power Systems GmbH
- Toshiba Corp.
- Gamatronic (SolarEdge Technologies Inc.)
- Delta Electronics Inc.
- Kohler Co.
- Legrand SA
- Socomec UPS India Pvt Ltd.
- Caterpillar Inc.
- AEG Power Solutions BV
- Tripp Lite (Eaton)
- Kehua Tech Co. Ltd.

Market Opportunities and Future Outlook
One opportunity is designing and retrofitting UPS systems for AI-era electrical behavior and higher rack power densities, where rapid synchronized transients increase requirements for discharge capability and control loops. This is reinforcing demand for higher-performance three-phase inverter platforms and acceptance-test regimes that reference IEC 62040-3 during Factory Acceptance Testing (FAT) and Site Acceptance Testing (SAT), creating room for suppliers that can package validated performance, monitoring, and commissioning as a single deliverable rather than separate equipment and service line items.
Another opportunity is the convergence of UPS, energy storage, and alternative backup generation into coordinated power architectures that address grid constraints and decarbonization programs. Ballard Power Systems and Vertiv reported development and initial testing in February 2025 of a fully integrated fuel-cell backup system for UPS using Ballard FCWave fuel cells with Vertiv Power Module H2 infrastructure, which indicates a pathway for lower-carbon backup configurations. On the electrical-code side, NEC 2026 introduced provisions tied to power control systems (PCS) that support software-driven load management, which can influence how operators size feeders and manage demand in high-density halls. Together with efficiency-focused requirements such as California Title 24 for new data centers (effective January 1, 2026) and capacity constraints like British Columbia BC Reg. 8/2026, these developments support solution bundles that combine high-efficiency UPS, lithium-ion safety-compliant battery integration, and grid-aware controls for both new builds and constrained-power retrofits.
Recent Industry Developments in Data Center UPS Market
- June 2026: Vertiv completed its acquisition of ThermoKey, expanding its heat rejection portfolio for AI data centers. The deal strengthens Vertiv to deliver integrated power-and-thermal infrastructure packages where UPS selection and cooling design are increasingly co-optimized for high-density compute deployments.
- June 2026: Schneider Electric expanded its EcoCare services to include 3-phase UPS, adding AI-powered condition-based maintenance and predictive analytics. The move increases the share of lifecycle software and service attach around critical power assets, aligning with operators focus on reducing unplanned downtime and managing complex modular fleets.
- December 2024: Schneider Electric introduced new solutions aimed at energy and sustainability challenges associated with AI-driven infrastructure. The announcements reinforced product roadmaps around higher-density electrical rooms and efficiency-oriented architectures, supporting procurement shifts toward compact, scalable UPS and power distribution configurations.


Data Center UPS Market Report Scope and Research Methodology
Market Definition and Coverage
This market covers the revenue earned from UPS systems used inside data centers to provide short-term backup power and power conditioning during outages and switching events. It includes UPS hardware sold for enterprise, colocation, hyperscale, and edge facilities, along with the batteries and monitoring electronics shipped with the UPS.
Scope exclusions: Portable single-phase UPS units mainly sold through retail or SOHO channels are excluded.
Segments Covered in This Report
- By UPS Type
- Standby
- Line-Interactive
- Double-Conversion On-Line
- Modular / Parallel-Redundant
- Rotary and Flywheel
- By Power Capacity
- ≤20 kVA
- 21-200 kVA
- >200 kVA
- By Architecture
- Centralized
- Distributed (Row-Level)
- Modular Scalable
- By Battery Type
- Lead-Acid (VRLA)
- Lithium-Ion
- Nickel-Cadmium and Others
- By Tier Type
- Tier 1 and 2
- Tier 3
- Tier 4
- By Data Center Size
- Small Data Center
- Medium Data Center
- Large Data Center
- Hyperscale Data Center
- By Data Center Type
- Colocation Data Center
- Hyperscalers Data Center/CSPs
- Enterprise and Edge Data Center
- By Geography
- North America
- United States
- Canada
- Mexico
- South America
- Brazil
- Chile
- Argentina
- Rest of South America
- Europe
- United Kingdom
- Germany
- France
- Italy
- Spain
- Rest of Europe
- Asia-Pacific
- China
- Japan
- India
- Singapore
- Australia
- Malaysia
- Rest of Asia-Pacific
- Middle East and Africa
- Middle East
- United Arab Emirates
- Saudi Arabia
- Turkey
- Rest of Middle East
- Africa
- South Africa
- Nigeria
- Rest of Africa
- Middle East
- North America
Data Sources, Market Sizing, and Validation
Desk Research
Desk research started with mapping the demand picture for data center power protection, then narrowing to UPS. We used public sources such as the US Energy Information Administration for electricity indicators, the US Census Bureau and international trade statistics portals for import and export direction, and ITU materials for network and data traffic context tied to facility build-outs.
We also reviewed open sources such as IEA publications on power trends, UN Comtrade style trade line data for electrical equipment mapping, patents databases to understand new UPS and battery technology direction, and peer-reviewed papers on power quality and battery performance in critical facilities. On top of this, we used company filings, investor presentations, earnings transcripts, reputed press coverage, and a subscription for company financials plus a shipment-level trade database to cross-check whether volumes and pricing were moving in the same direction. These sources are illustrative, and many other references were used for data collection, validation, and clarification during the work.
Primary Interviews and Surveys
Primary work was done to validate what the numbers imply in real buying cycles, especially around refresh timing, typical redundancy choices, and when modular versus monolithic systems are preferred. We spoke with a mix of UPS manufacturers, channel partners, data center operators, and electrical contractors across major regions, so assumptions on replacement demand and new build demand could be checked from more than one angle.
Distribution of primary research fieldwork respondents
| Company type | Respondent position | Region |
|---|---|---|
| Top tier: 33% | CXOs: 22% | APAC: 43% |
| Mid tier: 45% | Functional/Unit leaders: 19% | EMEA: 37% |
| Smaller Players: 22% | Managers: 59% | Americas: 20% |
Market-Sizing & Forecasting
Sizing was built using a top-down approach where the demand pool was reconstructed from data center build activity and the electrical critical power share that typically gets allocated to UPS, before being filtered by adoption across facility types. The totals were then corroborated using selective bottom-up approximations, such as sampled average selling prices by kVA band multiplied by estimated unit shipments from channel checks, which helped adjust the final totals when mismatches appeared.
A few inputs that mattered most in the model were the pace of new data center capacity additions, retrofit and replacement cycles for installed UPS fleets, average UPS sizing per rack or room (linked to load and redundancy), battery technology mix and its cost trend, and regional differences in power quality and grid reliability that change backup requirements. Where direct shipment visibility was limited, gaps were handled by using import-export signals for relevant electrical equipment, supplier disclosures, and installer feedback on typical project bill-of-material splits.
Forecasts were developed using scenario analysis, with base, conservative, and accelerated cases tied to data center expansion rates and expected pricing movement for UPS and batteries. The final trajectory was selected after checking that the implied volumes and price steps matched what practitioners expect for upcoming procurement cycles.
Data Validation & Update Cycle
Outputs were checked in more than one step, starting with internal consistency tests such as price times volume logic, regional share sanity checks, and year-over-year movement against known data center build cycles. If an outlier appeared, we revisited the assumptions, re-checked the desk sources, and then re-contacted selected interviewees to confirm whether the variance was real or caused by a modeling input.
Before sign-off, another analyst reviewed the model and the key assumptions so that arithmetic, scope alignment, and unit handling were verified. Reports are refreshed annually, and interim updates are made when material events happen such as major technology shifts, sharp battery price changes, or significant data center capex swings. Right before delivery, a final pass is completed so clients receive the most current view available at that time.
Mordor Intelligence's Data Center Ups Market Market Size Compared With Other Published Estimates
It is common to see different market values for data center UPS, even when the topic name looks the same, because each publisher chooses its own year, inclusion rules, and pricing logic. Differences also come from how replacement demand is treated versus new installs, and whether batteries and monitoring electronics are counted consistently.
Key gaps usually show up in scope and update timing. Some estimates blend broader UPS use cases beyond data centers or rely on a base year that is not aligned to the same equipment cycle, which shifts the starting value. Others apply faster price declines or assume more aggressive modular adoption without checking against actual procurement behavior, and that can expand the forecast curve more than what channel checks support.
Benchmark comparison
| Source | Market Size | Gaps in Research Methodology |
|---|---|---|
| Mordor Intelligence | USD 4.48 B (2026) | |
| Industry Research Firm A | USD 4.04 B (2024) | Uses a 2024 base and may treat some component coverage differently across architectures, so timing and mix assumptions shift the reported value versus a 2026 starting point. |
| Market Publisher B | USD 4.43 B (2025) | Uses a 2025 value with a longer forecast window, and inclusion choices around batteries and monitoring electronics can change totals when priced as separate line items. |
The spread in the table is mostly explained by base-year selection and how adjacent components are counted within a UPS purchase. When the year is moved forward and the included bill-of-material is kept consistent (UPS plus accompanying batteries and monitoring electronics), the estimate stays closer to real project pricing, which is the approach applied by Mordor Intelligence.


Key Questions Answered in the Report
What is the projected value of the data center UPS market by 2031?
The market is forecast to reach USD 6.46 billion by 2031, advancing at a 7.59% CAGR.
Which UPS architecture is growing fastest in large data centers?
Distributed modular systems are expanding at an 8.72% CAGR because they let operators add capacity in increments and cut resistive losses.
How quickly are lithium-ion batteries gaining share in UPS deployments?
Lithium-ion chemistries are growing at an 8.29% CAGR and have reached cost parity with valve-regulated lead-acid in systems above 500 kVA.
Which region will lead growth through 2031?
Asia-Pacific is set to post a 9.02% CAGR, buoyed by policy incentives in China, India, and Singapore.
Page last updated on:


