Modular UPS Market Size and Share
Market Overview
| Study Period | 2020 - 2031 |
|---|---|
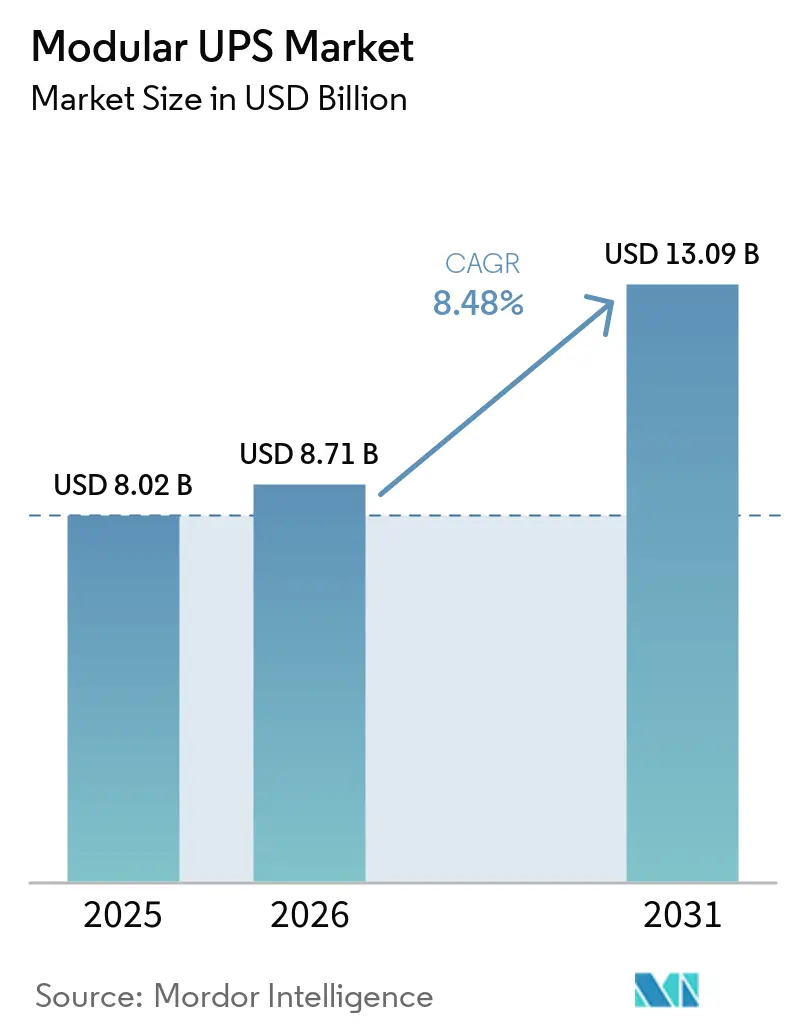
| Market Size (2026) | USD 8.71 Billion |
| Market Size (2031) | USD 13.09 Billion |
| Growth Rate (2026 - 2031) | 8.48% CAGR |
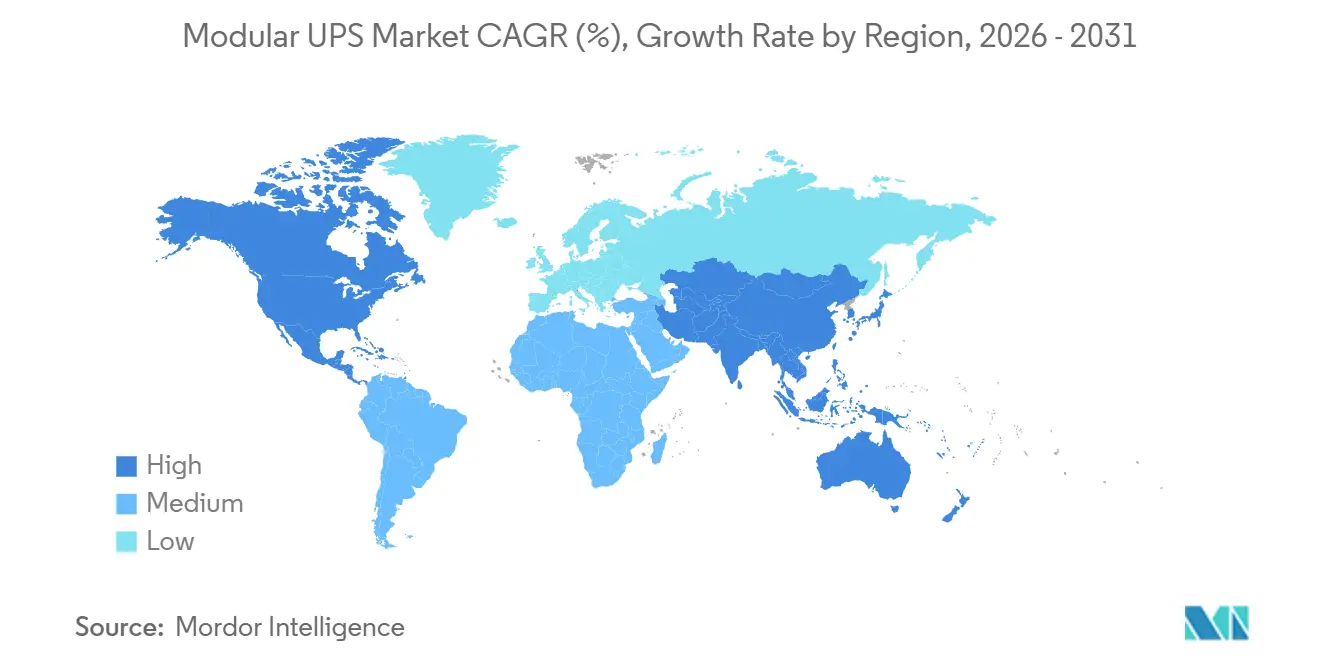
| Fastest Growing Market | Asia Pacific |
| Largest Market | North America |
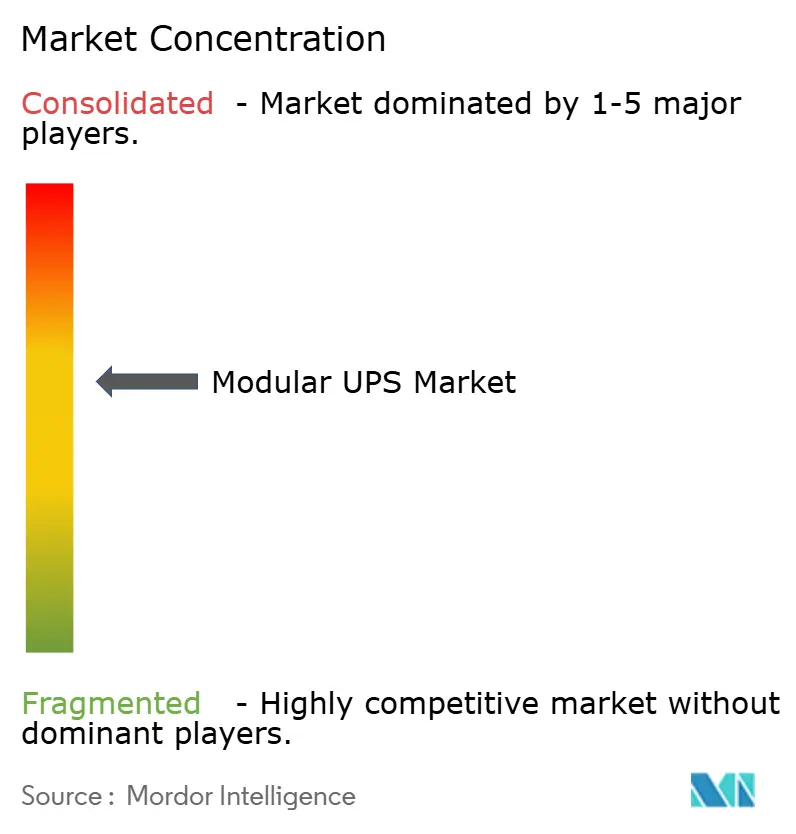
| Market Concentration | Medium |
Major Players *Disclaimer: Major Players sorted in no particular order Image © Mordor Intelligence. Reuse requires attribution under CC BY 4.0. | |
Modular UPS Market Analysis by Mordor Intelligence
The Modular UPS market size is projected to expand from USD 8.02 billion in 2025 and USD 8.71 billion in 2026 to USD 13.09 billion by 2031, registering a CAGR of 8.48% between 2026 and 2031. Rising rack densities above 40 kilowatts, growing reliance on artificial-intelligence workloads, and accelerating adoption of pay-as-you-grow power architectures are reshaping purchase criteria. Vendors able to deliver pre-integrated power blocks are capturing hyperscale demand, while lithium-ion and lithium-iron-phosphate batteries are compressing footprint and maintenance windows. Sovereign-AI programs in the European Union and Asia-Pacific are amplifying the need for factory-built uninterruptible power systems that can be installed within condensed construction timelines. At the same time, network-connected units transmitting live telemetry are forcing suppliers to harden products against cyber-intrusion, adding software validation to the buying checklist.
Key Report Takeaways
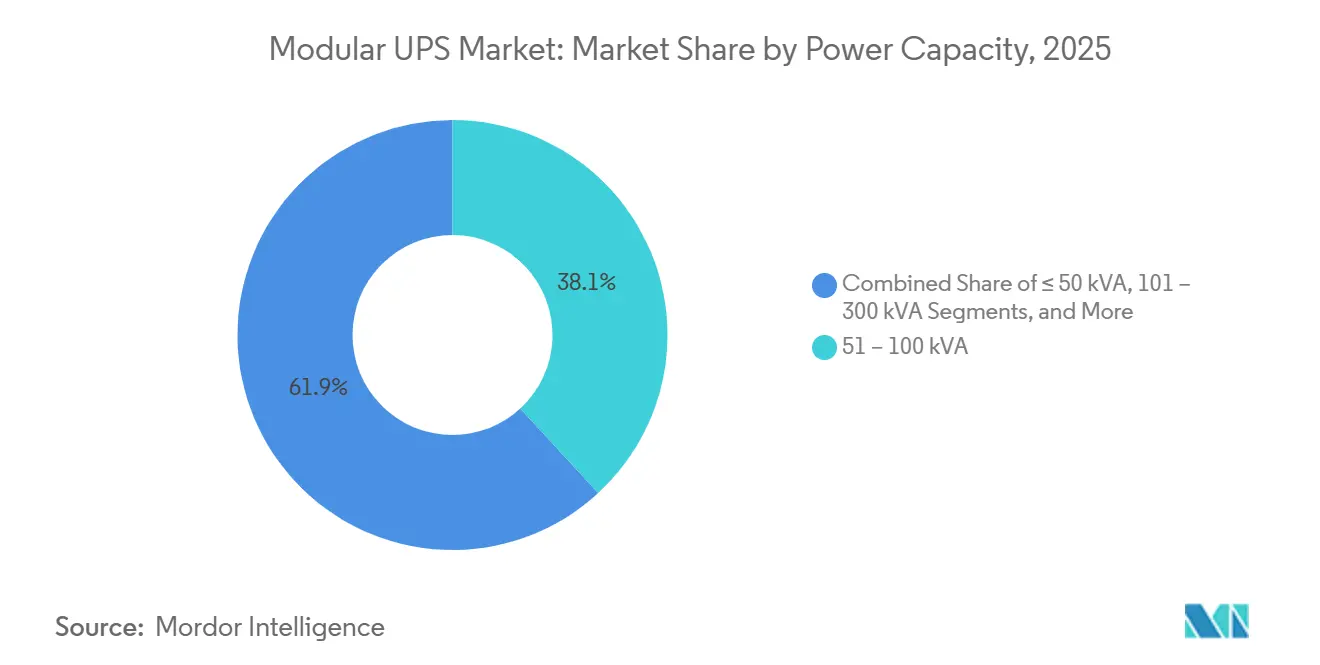
- By power capacity, the 51–100 kVA segment led with 38.14% of the Modular UPS market share in 2025, while installations above 500 kVA are forecast to grow at an 11.53% CAGR through 2031.
- By end-user industry, data centers held 62.14% revenue share in 2025, whereas healthcare is projected to expand at a 9.12% CAGR to 2031.
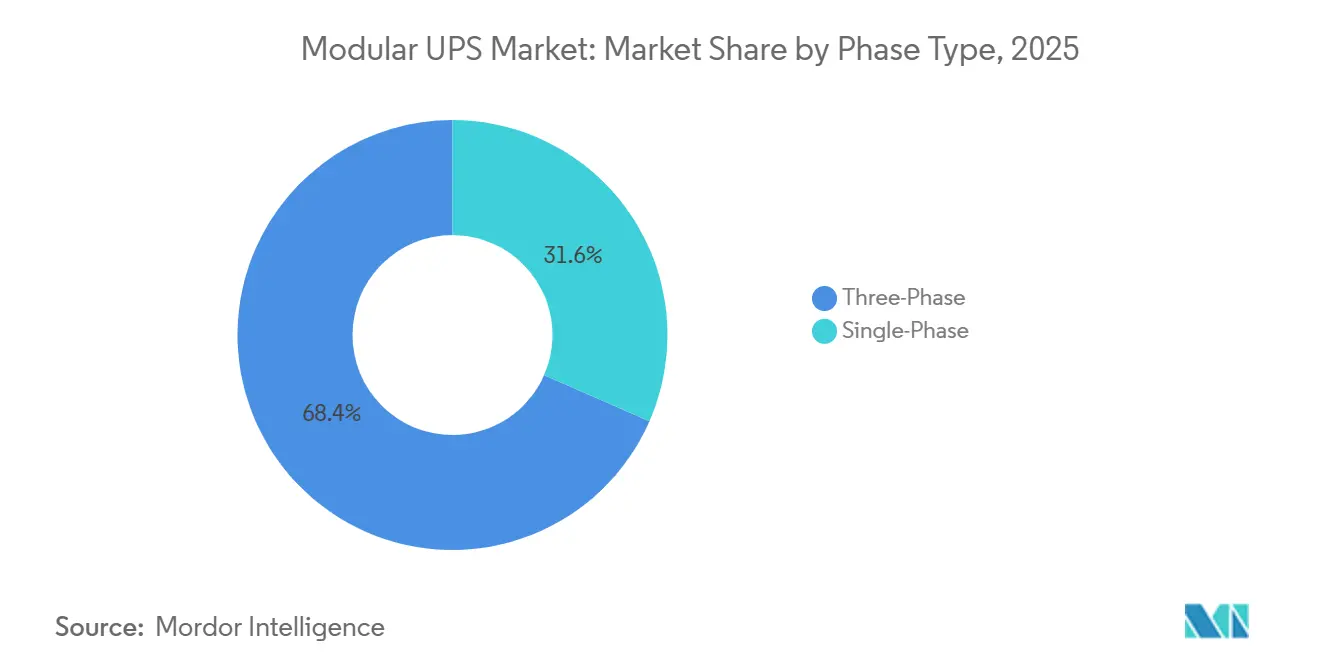
- By phase type, three-phase configurations accounted for 68.43% of 2025 shipments and are advancing at a 9.11% CAGR over the forecast period.
- By component, solutions hardware captured 72.83% of 2025 spending, but services are rising at an 8.58% CAGR through 2031.
- By geography, North America retained 42.53% share in 2025, yet Asia-Pacific is expected to post the fastest regional growth at a 10.32% CAGR to 2031.
Note: Market size and forecast figures in this report are generated using Mordor Intelligence’s proprietary estimation framework, updated with the latest available data and insights as of January 2026.
Global Modular UPS Market Trends and Insights
Drivers Impact Analysis*
| Driver | (~) % Impact on CAGR Forecast | Geographic Relevance | Impact Timeline |
|---|---|---|---|
| Expansion of Hyperscale and Colocation Data Centers | +2.1% | Global, with concentration in North America, Asia-Pacific (China, India, Singapore), and Europe (Frankfurt, Amsterdam, London) | Medium term (2–4 years) |
| Lower Total Cost of Ownership Through Modular Scalability | +1.8% | Global, particularly appealing in emerging markets (Middle East, South America) where capital constraints favor phased investment | Long term (≥4 years) |
| Rapid Edge and 5G Micro-Data-Center Deployment | +1.5% | Asia-Pacific core (South Korea, Japan, China), spill-over to North America and Europe as telecom operators densify networks | Short term (≤2 years) |
| Grid-Interactive UPS Monetization via Demand-Response | +1.2% | North America and Europe, where regulatory frameworks (FERC Order 2222, EU Clean Energy Package) enable aggregated battery participation | Medium term (2–4 years) |
| Lithium-ion Module Adoption Boosting Power Density | +1.0% | Global, with early adoption in North America and Europe; accelerating in Asia-Pacific as battery costs decline | Medium term (2–4 years) |
| Circular-Economy Refurbishment and Redeployment Models | +0.9% | Europe (driven by EU Circular Economy Action Plan), expanding to North America as extended producer responsibility mandates take effect | Long term (≥4 |
| Source: Mordor Intelligence | |||
Expansion of Hyperscale and Colocation Data Centers
Hyperscale cloud providers are specifying modular topologies so that power infrastructure scales only when GPU clusters are installed. Microsoft earmarked 1.5 gigawatts of AI-training capacity for phased rollout, stipulating frame-based UPS systems that accept additional modules on demand.[1]Microsoft Investor Relations, “Azure Infrastructure Expansion Plans,” microsoft.com Leading colocation firms likewise shifted new-build standards, with one operator confirming that more than two-thirds of facilities commissioned in 2025 used modular power frames to defer USD 180 million in initial outlay until tenant contracts closed.[2]Equinix, “Form 10-K Annual Report 2025,” investor.equinix.com Such deferral improves return on invested capital and shields developers from stranded assets when leasing momentum softens.
Lower Total Cost of Ownership Through Modular Scalability
A modular frame achieves N+1 redundancy by adding one extra module rather than oversizing the entire UPS, trimming hardware expense by roughly 15-20%. Routine maintenance becomes simpler because technicians hot-swap units in under 30 minutes, eliminating bypass windows that can cost large data centers USD 9,000 per hour in downtime penalties. Schneider Electric’s EcoStruxure platform links UPS operations with building-management software, optimizing charging based on time-of-use tariffs and reducing electricity bills by 8% in multi-site pilots.[3]Schneider Electric, “EcoStruxure Platform Overview,” se.com
Rapid Edge and 5G Micro-Data-Center Deployment
Telecommunications carriers are increasingly adopting three-phase modular UPS systems housed in compact edge enclosures to enhance the performance and reliability of 5G core functions. By late 2025, SK Telecom successfully deployed this advanced architecture across 1,200 sites, ensuring that latency thresholds remained consistently below 5 milliseconds, a critical requirement for supporting industrial IoT traffic. On the other hand, NTT Docomo reported significant operational improvements after transitioning from traditional rack-mount UPS systems. The company documented a 40% reduction in site-build time, which played a pivotal role in accelerating the monetization of its private-5G contracts and improving overall deployment efficiency.
Grid-Interactive UPS Monetization via Demand-Response
California's Demand Side Grid Support program provides commercial participants with compensation of up to USD 6 per kilowatt-hour for dispatching UPS batteries during periods of peak stress events. This program significantly aids in reducing operational costs by offsetting 12-18% of a large facility's annual power expenditure, making it an attractive option for businesses aiming to optimize energy usage. In PJM Interconnection's 2025 frequency-regulation market, 320 megawatts of UPS capacity was recorded, showcasing the growing role of UPS systems in grid stability. The market also reported average clearing prices reaching USD 42 per megawatt-hour, highlighting the financial potential of participating in such programs. Modular systems further enhance the feasibility of enrollment by allowing specific modules to be allocated for grid services, ensuring operational efficiency while maintaining N+1 redundancy for critical loads. This dual functionality ensures that essential operations remain unaffected while contributing to grid support initiatives.
Restraints Impact Analysis*
| Restraint | (~) % Impact on CAGR Forecast | Geographic Relevance | Impact Timeline |
|---|---|---|---|
| High Up-Front Capital Expenditure Versus Monolithic UPS | -1.4% | Global, with pronounced impact in cost-sensitive markets (South America, Africa, Southeast Asia) | Short term (≤2 years) |
| Limited Awareness Beyond IT-Intensive Verticals | -1.1% | Emerging markets (Middle East, Africa, South America) and non-data-center sectors (manufacturing, commercial real estate) | Medium term (2–4 years) |
| Power-Electronics Component Supply Volatility | -0.8% | Global, with acute pressure in Asia-Pacific manufacturing hubs (China, Taiwan, South Korea) | Short term (≤2 years) |
| Cyber-Security Exposure in Networked UPS Architectures | -0.6% | North America and Europe, where regulatory scrutiny (CISA, ENISA) and liability concerns are highest | Medium term (2–4 years) |
| Source: Mordor Intelligence | |||
High Up-Front Capital Expenditure Versus Monolithic UPS
When fully populated, modular frames come with a 25-35% purchase premium. This higher price tag often discourages buyers who focus more on the initial cost rather than considering the long-term benefits of lifecycle economics. In emerging markets, surveys consistently reveal that 62% of data-center developers identify limited access to project financing as the primary obstacle to adopting modular designs. While power-as-a-service offerings provide a way to shift capital expenditures (capex) into operational expenditures (opex), they come with the requirement of investment-grade credit ratings. Unfortunately, many regional operators find it challenging to meet this benchmark, further hindering their ability to leverage such solutions.
Limited Awareness Beyond IT-Intensive Verticals
Capital committees at hospitals, manufacturing plants, and commercial real estate firms typically refresh their power infrastructure on multi-decade cycles. They often opt for like-for-like replacements, as modular UPS systems are perceived as untested and less reliable. This perception persists despite the American Society for Healthcare Engineering highlighting that modular options can save an average of 60% in footprint, offering significant space efficiency. However, only 18% of hospital equipment boards have considered modular systems during evaluations, indicating a slow adoption rate. In response, vendors have introduced vertical-specific reference sites and developed training programs to address these concerns and promote modular solutions. Nevertheless, achieving widespread adoption of modular UPS systems will require several budget cycles, as organizations gradually overcome existing barriers and shift their investment strategies.
*Our forecasts treat driver/restraint impacts as directional, not additive. The impact forecasts reflect baseline growth, mix effects, and variable interactions.
Segment Analysis
By Power Capacity: Hyperscale Demand Lifts High-End Modules
Large-scale installations above 500 kVA are projected to post an 11.53% CAGR to 2031, the fastest within the Modular UPS market. Operators deploy containerized power blocks that combine UPS, switchgear, and liquid-cooled busways, allowing 10 megawatts of protected load to leave the factory in a single ISO container. This approach compresses construction schedules from 18 to 6 months and aligns well with AI training clusters that can double rack density year-over-year. The 51–100 kVA bracket, which held 38.14% of the Modular UPS market share in 2025, remains the baseline choice for mid-tier colocation and enterprise refresh projects where load ramps follow predictable annual cycles.
The pivot toward high-capacity modules mirrors consolidation trends across the digital-infrastructure landscape. Average rack density in new hyperscale halls already exceeds 15 kilowatts and is projected to reach 20 kilowatts by 2027. Standardization around IEC 62040-3 performance classes enables operators to mix modules from several suppliers inside one frame, avoiding vendor lock-in and maintaining components in competitive tension.


By End User Industry: Healthcare Accelerates Digital Transformation
Data centers captured 62.14% of 2025 value, underscoring their historical dominance in the Modular UPS market size. Growth within this segment is moderating, however, as land constraints and utility interconnection queues elongate development timelines. Healthcare, by contrast, is forecast to expand at 9.12% through 2031. Hospital groups are migrating from centralized, monolithic systems to distributed modular units that sit nearer to clinical loads, trimming battery-room footprint by two-thirds and freeing expensive floor space for revenue-generating medical equipment.
Industrial manufacturing, telecommunications, and banking installations represent secondary growth engines. In telecommunications, modular UPS secures always-on operation of 5G core nodes, while in manufacturing the architecture underpins Industry 4.0 assembly lines that cannot tolerate unexpected voltage sags. Commercial buildings and government facilities are also incrementally adopting the technology to protect edge compute and public-safety systems, although penetration here remains below 15%.
By Phase Type: Three-Phase Dominates Dense Deployments
In 2025, three-phase designs dominated the market, making up 68.43% of shipments and are projected to expand at a rate of 9.11% through 2031. These designs facilitate 480-volt distribution, reduce conductor costs, and streamline overhead cabling, especially in setups with rack densities surpassing 30 kilowatts. The adoption of three-phase designs is driven by their ability to handle higher power loads efficiently, making them a preferred choice for modern data centers and industrial applications. While single-phase units remain in use at small offices and retail locations, their significance is dwindling. This decline is attributed to enterprises increasingly centralizing their IT hardware into consolidated closets and shared colocation suites, which demand higher power capacities and more efficient distribution systems.
To address this shift, hybrid products are being developed. They connect traditional facilities, which rely on single-phase utility services, to three-phase internal distributions. These hybrid solutions are particularly valuable in scenarios where upgrading the entire electrical infrastructure is not immediately feasible. A notable example of this trend is Delta Electronics, which introduced a 98.5%-efficient module in 2025. This module not only self-balances phases but also exemplifies the industry's move towards greater efficiency. Such advancements not only bridge the efficiency divide but also provide operators with the advantage of postponing expensive building rewiring. By enabling a gradual transition to three-phase systems, hybrid products play a crucial role in modernizing legacy facilities while minimizing operational disruptions and costs.
By Component: Services Gain Share Through Predictive Analytics
Solutions hardware made up 72.83% of global spending in 2025, but service revenue is climbing at an 8.58% CAGR as buyers subscribe to analytics platforms that forecast capacitor aging, thermal stress, and battery end-of-life. Schneider Electric reported preventing 1,200 incipient failures during 2025 by flagging component drift 30 days before threshold alarms. Eaton’s PredictPulse algorithm predicts battery replacement windows with a 90-day horizon, letting operators avoid emergency call-outs that cost triple the planned-maintenance rate.
Intensifying hardware commoditization, especially from Chinese producers that undercut Western list prices by up to 30%, is steering vendors toward outcome-based maintenance contracts. Installation, commissioning, and operator training now account for roughly 15% of project cost, turning service capability into a key differentiator once performance specifications converge.
Geography Analysis
Asia-Pacific is forecast to add the greatest incremental value to the Modular UPS market size, expanding at a 10.32% CAGR through 2031. China’s National Development and Reform Commission cleared USD 13.6 billion of computing-infrastructure projects during 2024, with 78% specifying modular UPS frames to enable staged rollout. India’s Digital India initiative is channeling USD 1.2 billion toward AI-ready data halls in Tier 2 cities, likewise favoring pay-as-you-grow power protection. Japan and South Korea are adding edge micro-sites that anchor autonomous-vehicle and mixed-reality ecosystems, all of which demand resilient three-phase UPS to guarantee sub-10-millisecond latency.
North America retained a commanding 42.53% share in 2025 thanks to a 2.8-gigawatt pipeline of announced U.S. data-center projects. Growth is slowing, however, as queue times for grid interconnection average 24-36 months in Virginia, Texas, and California. Operators are mitigating delay risk by incorporating grid-interactive UPS systems capable of earning revenue in wholesale power markets while awaiting permanent feeds.
Europe remains a technology test-bed for renewable-grid integration. Germany registered 47 megawatt-hours of modular UPS capacity in ancillary-services markets by end-2025, monetizing batteries during solar-induced midday oversupply. The Middle East is another emerging node; Saudi Arabia’s Public Investment Fund financed four colocation campuses in 2025 that specified lithium-iron-phosphate-based modular UPS suitable for 50 °C ambient temperatures. South America and Africa trail on adoption, hampered by limited project finance and weaker grid stability, yet pilot deployments in Brazil and South Africa are demonstrating the architecture’s resilience during frequent voltage excursions.

Competitive Landscape
The Modular UPS market shows moderate fragmentation, with Schneider Electric, Vertiv, Eaton, Huawei, and ABB combining for roughly 45% share. These incumbents defend their position by bundling UPS with integrated monitoring platforms such as EcoStruxure and Trellis that unify power, cooling, and IT telemetry. Schneider expanded its Bangalore plant in January 2026, boosting annual capacity to 12,000 units and shortening factory test cycles from eight hours to 90 minutes, a move aimed at capturing Asia-Pacific hyperscale orders. Vertiv’s November 2025 acquisition of CoolTera adds liquid-cooling to its power portfolio, enabling turnkey packages for racks exceeding 40 kilowatts.
Chinese challengers Kehua Data, KSTAR, and Zhongheng Electric leverage domestic scale and local-currency invoicing to price modules 20-30% below Western counterparts, gaining share across Southeast Asia and the Middle East. Technology innovation is another battlefield. ABB introduced silicon-carbide inverters achieving 98.7% double-conversion efficiency, cutting cooling loads and earning early wins among operators prioritizing PUE reduction. Eaton’s 2025 patent covering gallium-nitride transistors promises lighter modules that lower freight costs for containerized deployments.
Cybersecurity now influences procurement. After eight UPS-related advisories from the U.S. Cybersecurity and Infrastructure Security Agency during 2024-2025, buyers stipulate IEC 62443 compliance and role-based access controls as minimum bid requirements. Regional specialists such as Salicru in Iberia and Centiel in Switzerland exploit proximity advantages, offering 24-hour spare-parts delivery and local-language support that large multinationals sometimes cannot match.
Modular UPS Industry Leaders
Schneider Electric SE
Vertiv Holdings Co.
Eaton Corporation plc
ABB Ltd.
Huawei Technologies Co. Ltd.
- *Disclaimer: Major Players sorted in no particular order

Recent Industry Developments
- February 2026: Schneider Electric confirmed a USD 120 million expansion of its modular UPS plant in Bangalore, India, adding 250,000 square feet of automated production capable of 12,000 units per year by Q4 2026.
- November 2025: Vertiv finalized the USD 285 million acquisition of liquid-cooling firm CoolTera, integrating rear-door heat exchangers with its modular UPS catalog to address AI clusters above 40 kW per rack.
- September 2025: Eaton introduced Energy Aware UPS, automating grid-service participation; Texas pilot sites generated USD 2.1 million in ancillary-services revenue during the Aug 2025 heat wave.
- July 2025: Huawei Digital Power signed a USD 45 million memorandum with Saudi Aramco to supply modular UPS for 15 edge data centers supporting digital-oilfield operations.


Research Methodology Framework and Report Scope
Market Definitions and Key Coverage
Our study defines the modular uninterruptible power supply market as yearly revenue from new, factory-built UPS frames that hold hot-swappable power modules, battery drawers, and control logic, with ratings from roughly 20 kVA up to 2 MW, deployed across data centers, telecom edge rooms, industrial production lines, hospitals, and other critical facilities. We also count the embedded monitoring software and start-up services shipped with each frame.
Scope Exclusions: Stand-alone monolithic UPS, rack-mount line-interactive units below 10 kVA, diesel rotary UPS, and pure service contracts are excluded.
Segmentation Overview
- By Power Capacity
- ≤ 50 kVA
- 51 – 100 kVA
- 101 – 300 kVA
- 301 – 500 kVA
- > 500 kVA
- By End User Industry
- Data Centers
- Industrial Manufacturing
- Telecommunications
- Commercial Buildings
- Banking, Financial Services and Insurance
- Government and Public Infrastructure
- Healthcare
- Rest of End User Industries
- By Phase Type
- Single-Phase
- Three-Phase
- By Component
- Solutions (Hardware)
- Services
- By Geography
- North America
- United States
- Canada
- Mexico
- South America
- Brazil
- Argentina
- Rest of South America
- Europe
- Germany
- United Kingdom
- France
- Italy
- Spain
- Rest of Europe
- Asia Pacific
- China
- Japan
- South Korea
- India
- Australia
- New Zealand
- Rest of Asia-Pacific
- Middle East and Africa
- Middle East
- United Arab Emirates
- Saudi Arabia
- Turkey
- Rest of Middle East
- Africa
- South Africa
- Nigeria
- Kenya
- Rest of Africa
- Middle East
- North America
Detailed Research Methodology and Data Validation
Primary Research
Mordor analysts spoke with electrical engineers who specify UPS frames for hyperscale builds in North America and Asia, facility heads at 5G edge nodes, and operations managers inside heavy factories. Their remarks on module sizing, lithium-ion adoption, and swap cycles validated desk inputs and refined price assumptions.
Desk Research
We begin with UN Comtrade and national customs portals to chart shipment flows, then layer International Energy Agency data on data-center electricity draw. Public vendor filings, procurement alerts from Tenders Info, and patent sets pulled via Questel let us gauge technology diffusion. Industry bodies such as the Open Compute Project and AFCOM provide rack-density ratios, while EcoDesign Lot 9 rules clarify efficiency thresholds. News streams on Dow Jones Factiva and corporate investor decks round out trend signals.
These examples illustrate our secondary base; many additional journals, trade registries, and statistics portals were consulted for confirmation and gap-filling.
Market-Sizing & Forecasting
We run a top-down demand pool in which annual hyperscale megawatt additions, average kVA per rack, and telecom edge-site counts yield potential capacity. Sales weights from vendor disclosures convert that capacity to value. Select bottom-up checks, sampled average selling prices multiplied by quarterly shipment volumes from five leading suppliers, test and adjust the totals. Key drivers include new white-space (m²), rack power density (kW), lithium-ion battery cost per kWh, module swap interval, EU Lot 9 targets, and industrial IoT penetration. A multivariate regression projects each driver, and scenario analysis captures policy or supply-chain shocks before values cascade through 2030.
Data Validation & Update Cycle
Outputs face variance tests against historic CAGRs, peer datasets, and fresh primary feedback. Senior reviewers flag anomalies, and we refresh the model every twelve months, with interim updates when events such as a greater than 5% quarterly jump in data-center capex occur.
Why Mordor's Modular UPS Baseline Commands Reliability
Published estimates often diverge because firms adopt different scopes, convert currencies at varied dates, and update on uneven cycles, leaving planners with billion-dollar spreads.
Key gap drivers include studies counting only double-conversion units, omitting industrial demand, or projecting 2022 shipments forward without new field checks, while some rely on list prices rather than realized ASPs.
Benchmark comparison
| Market Size | Anonymized source | Primary gap driver |
|---|---|---|
| USD 8.02 B (2025) | Mordor Intelligence | |
| USD 5.44 B (2024) | Global Consultancy A | Excludes installations above 400 kVA and Latin America |
| USD 4.68 B (2022) | Trade Journal B | Uses pre-AI rack-density norms and no currency realignment |
| USD 6.06 B (2024) | Industry Analyst C | Counts only online UPS; omits healthcare and industrial demand |
The comparison shows that Mordor's disciplined scope, annual refresh, and dual-path validation yield a balanced, transparent baseline that decision-makers can trace to clear variables and repeatable steps.


Key Questions Answered in the Report
What CAGR is projected for global demand between 2026 and 2031?
Modular UPS market is forecast to grow at 8.48% over the 2026-2031 period.
Which capacity bracket is expanding the fastest?
Installations above 500 kVA lead the growth table, advancing at an 11.53% CAGR through 2031.
Why are healthcare facilities accelerating adoption?
Hospitals are replacing bulky monolithic units with modular systems that cut battery-room footprint by two-thirds and align redundancy levels with departmental IT loads.
How are operators monetizing idle UPS assets?
Grid-interactive platforms let data-center owners discharge batteries into demand-response markets, earning up to USD 6 per kWh in certain U.S. programs.
Page last updated on:


