Cysteine Market Size and Share
Market Overview
| Study Period | 2020 - 2031 |
|---|---|
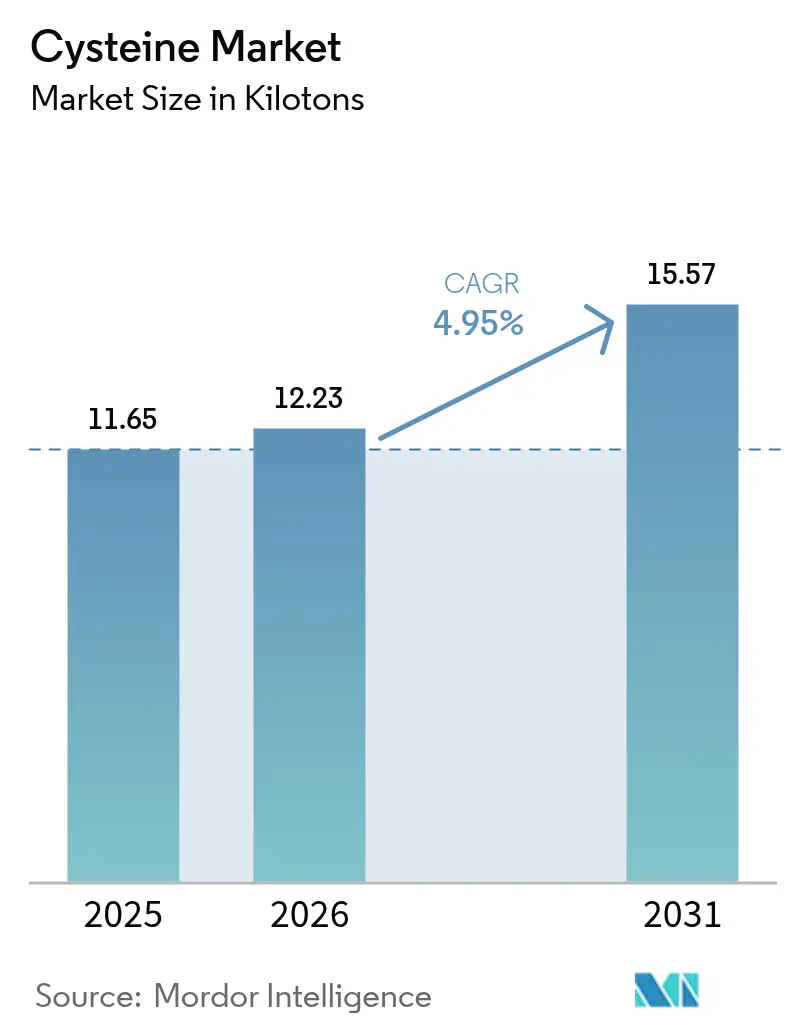
| Market Volume (2026) | 12.23 kilotons |
| Market Volume (2031) | 15.57 kilotons |
| Growth Rate (2026 - 2031) | 4.95% CAGR |
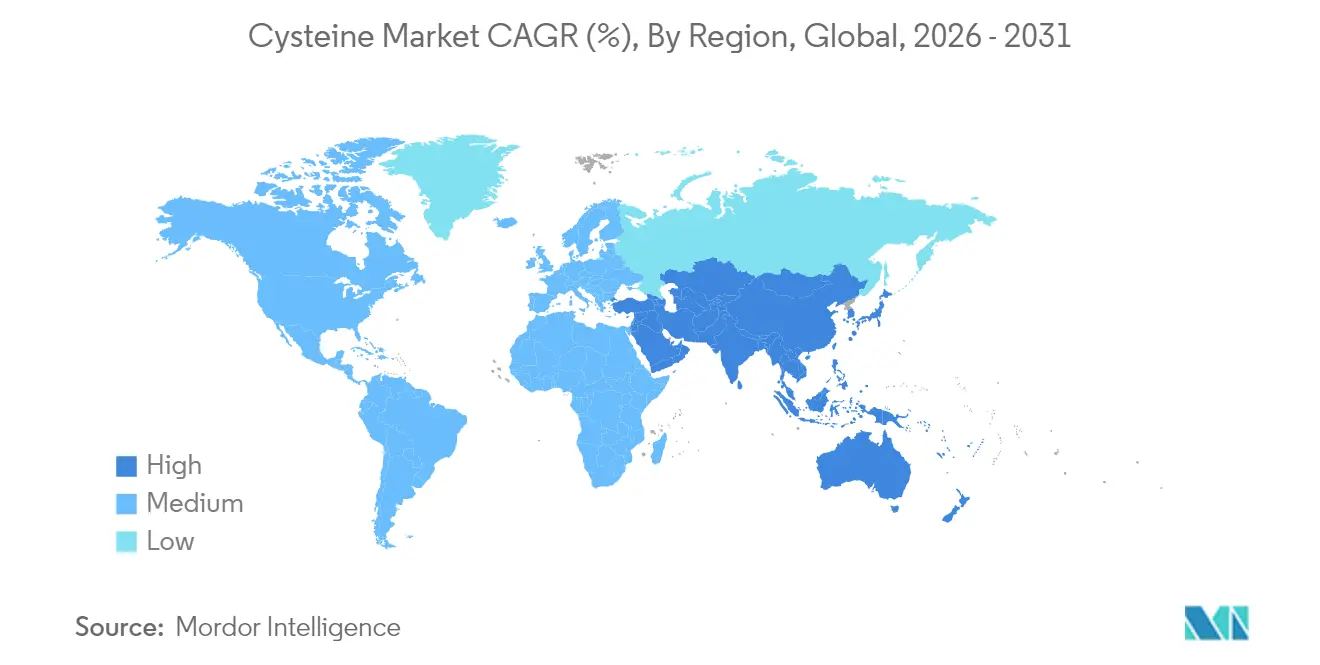
| Fastest Growing Market | Asia Pacific |
| Largest Market | Asia Pacific |
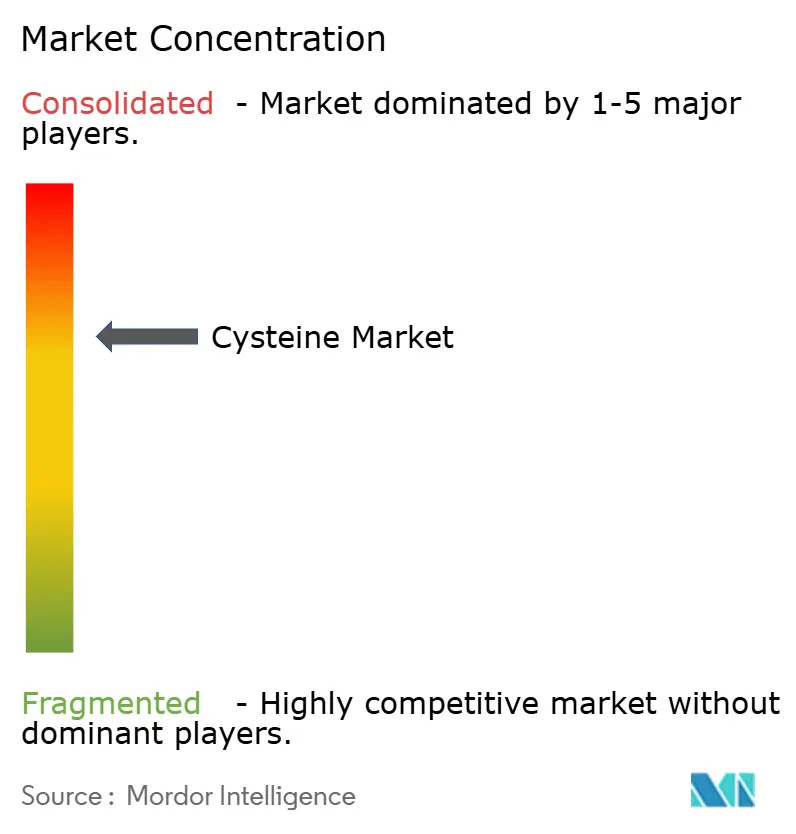
| Market Concentration | Medium |
Major Players
*Disclaimer: Major Players sorted in no particular order Image © Mordor Intelligence. Reuse requires attribution under CC BY 4.0. |
|
Cysteine Market Analysis by Mordor Intelligence
The cysteine market size is expected to grow from 11.65 kilotons in 2025 to 12.23 kilotons in 2026 and is forecast to reach 15.57 kilotons by 2031 at 4.95% CAGR over 2026-2031. Moderate expansion continues as the amino acid’s sulfur chemistry underpins food processing, pharmaceutical, and personal-care applications that cannot be easily substituted. Bio-fermentation drives production realignment, enabling higher purity and vegan certification at competitive cost. Synthetic routes scale in parallel as producers seek additional flexibility. Demand is reinforced by the clean-label movement in packaged foods, pharmaceutical migration to plant-derived sources, and hair-care innovations that position cysteine as a safer alternative to formaldehyde-based treatments. Asia-Pacific retains its role as the supply hub, supported by large-scale fermenters, favorable feedstock economics, and expanding domestic consumption.
Key Report Takeaways
- By production process, natural fermentation held 68.34% of the cysteine market share in 2025, while the synthetic route is advancing at a 6.05% CAGR to 2031.
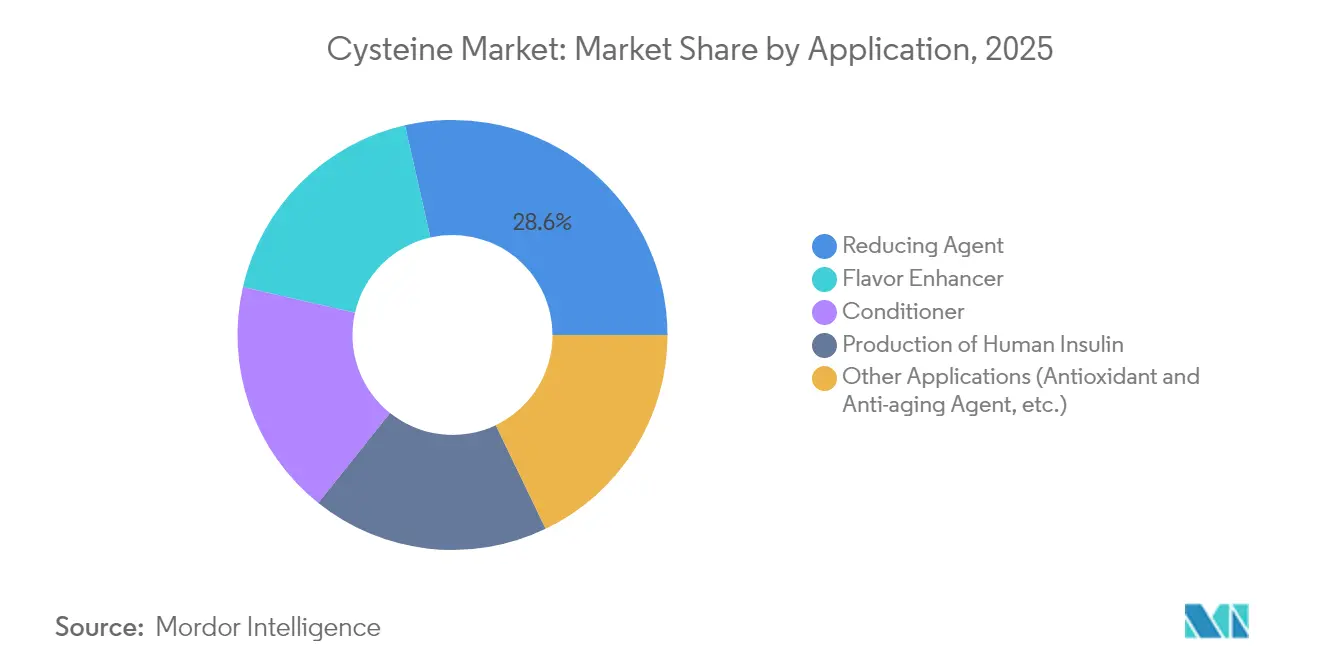
- By application, the reducing-agent segment captured 28.55% share of the cysteine market size in 2025; conditioner applications are expanding at a 6.12% CAGR through 2031.
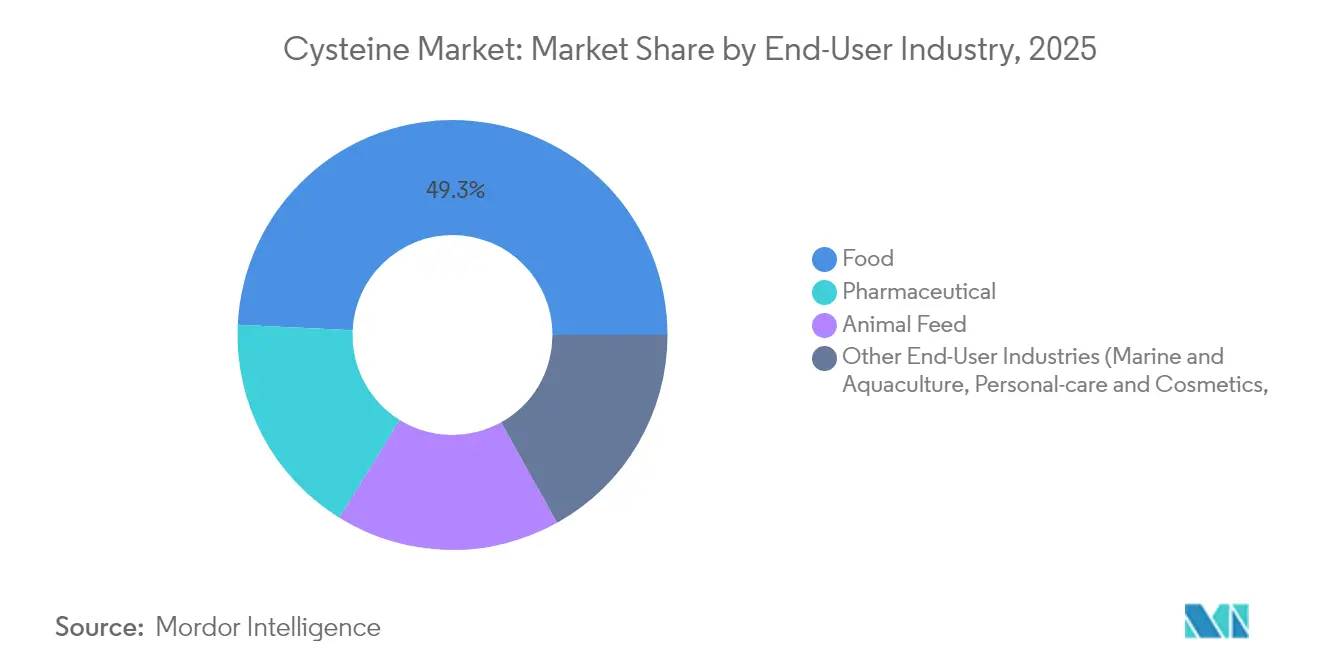
- By end user, the food sector accounted for 49.25% of the cysteine market size in 2025 and is progressing at a 5.91% CAGR to 2031.
- By geography, Asia-Pacific led with 47.60% cysteine market share in 2025 and is on track for a 5.82% CAGR to 2031.
Note: Market size and forecast figures in this report are generated using Mordor Intelligence’s proprietary estimation framework, updated with the latest available data and insights as of 2026.
Global Cysteine Market Trends and Insights
Driver Impact Analysis*
| Driver | (~) % Impact on CAGR Forecast | Geographic Relevance | Impact Timeline |
|---|---|---|---|
| Expansion of bio-fermentation capacity | +1.2% | Global, APAC lead | Medium term (2-4 years) |
| Growing clean-label demand for natural flavor enhancers | +0.8% | North America & EU primary | Short term (≤ 2 years) |
| Pharmaceutical switch to plant-derived L-cysteine | +0.6% | Global, EU regulatory pull | Medium term (2-4 years) |
| Hair-care brands adopting high-dose cysteine kits | +0.4% | APAC core, LATAM spill-over | Long term (≥ 4 years) |
| Integration in green-hydrogen fuel-cell membranes | +0.3% | North America & EU | Long term (≥ 4 years) |
| Source: Mordor Intelligence | |||
Expansion of Bio-Fermentation Capacity
Global producers continue to add fermenters that replace animal-hair extraction with microbial systems able to reach pharmaceutical-grade purity. Wacker Chemie’s FERMOPURE platform achieves this while cutting hydrochloric acid consumption and wastewater volumes. Engineering advances have lifted final L-cysteine titers to 33.8 g/L, a 37% improvement that lowers unit cost and widens pharmaceutical access. Fermentation aligns with vegan labeling requirements and preempts regulatory action against animal-derived inputs. New capacity in Spain, China, and India secures regional supply and hedges freight volatility. These investments raise baseline output, temper price spikes, and reinforce long-run growth for the cysteine market.
Growing Clean-Label Demand for Natural Flavor Enhancers in Processed Foods
Food formulators replace synthetic dough-conditioners and flavor boosters with amino acid alternatives that satisfy plain-language labeling rules. The U.S. Code of Federal Regulations grants GRAS status to L-cysteine monohydrochloride at 0.009 parts per 100 of flour, offering regulatory certainty for bakers[1]United States Government, “21 CFR § 184.1272 – L-Cysteine Monohydrochloride,” ecfr.gov. Thermal reaction trials confirm that cysteine enhances savory notes via sulfur-containing volatiles under Maillard conditions. CJ Food & Nutrition Tech’s FlavorNrich launch underscores commercial appetite for non-electrolytic grades that serve clean-label positioned snacks, sauces, and meat alternatives. As retailers tighten additive blacklists, natural amino acids gain shelf-life and sensory functions without regulatory friction, bolstering the cysteine market.
Pharmaceutical Switch from Animal- to Plant-Derived L-Cysteine for Parenteral Nutrition
Hospital demand for parenteral amino acids is shifting toward fermentation-origin inputs that eliminate bovine or porcine risk. Evonik’s cQrex KC dipeptide delivers 1,000-fold higher solubility than free L-cystine, streamlining high-density cell-culture feeds for healthcare[2]Evonik Health Care, "High-purity amino acids for various applications," healthcare.evonik.com. BioSpectra and other GMP suppliers follow suit, citing the regulator's preference for animal-free excipients. Parallel research links cysteine supplementation with improved redox balance in anxiety disorders, suggesting wider therapeutic utility. These trends support a durable uplift in pharmaceutical volumes in the cysteine market.
Hair-Care Brands Launching High-Dose Cysteine Smoothing Kits in Emerging Economies
Salons in India, Brazil, and Indonesia introduce formaldehyde-free smoothing services that rely on cysteine to realign disulfide bonds while limiting scalp irritation. Ingredient vendors combine plant-sourced amino acids with hydrolyzed keratin to extend treatment longevity to 4 weeks. Academic studies on lysine carboxymethyl cysteinate indicate parallel benefits in skin photoprotection, hinting at cross-category expansion. Rising disposable income and stricter cosmetic safety rules hasten substitution away from aldehyde-based straighteners. Consequently, conditioner formulations become the fastest-growing slice of the cysteine market.
Restraint Impact Analysis*
| Restraint | (~) % Impact on CAGR Forecast | Geographic Relevance | Impact Timeline |
|---|---|---|---|
| Volatile prices of raw materials (sugar, corn steep liquor) | -0.7% | Global, with acute impact in APAC production hubs | Short term (≤ 2 years) |
| Increasing concerns related to animal-sourced cysteine | -0.5% | EU & North America regulatory pressure, APAC consumer shift | Medium term (2-4 years) |
| Harmful effects of cysteine on human body | -0.3% | Global, with regulatory scrutiny in pharmaceutical applications | Medium term (2-4 years) |
| Source: Mordor Intelligence | |||
Volatile Prices of Raw Materials (Sugar, Corn Steep Liquor)
Fermentation margins tighten when feed corn and refined sugar spike, costs that mirror fertilizer and natural-gas swings. Bio-processors in Shandong and Gujarat report wider EBITDA variance when grain prices rise faster than amino acid spot values. Some producers trial molasses or upcycled starch waste to immunize cost curves, yet scale-up remains preliminary. Until substrate hedging tools mature, raw material inflation continues to temper the cysteine market’s growth pace.
Increasing Concerns Related to Animal-Sourced Cysteine
Regulators and consumers increasingly question the allergenicity and traceability of cysteine derived from hog hair or duck feathers. The UK Food Standards Agency calls for enhanced protein authentication protocols, reinforcing demand for DNA- or isotope-based origin testing. Quick-service restaurant chains react by specifying vegan-certified dough improvers, sidelining animal-origin material. The trend accelerates the pivot to bio-fermentation but also triggers short-term reformulation costs, applying moderate drag on the cysteine market.
*Our forecasts treat driver/restraint impacts as directional, not additive. The impact forecasts reflect baseline growth, mix effects, and variable interactions.
Segment Analysis
By Production Process: Natural Fermentation Outpaces Synthetic Uptake
Natural fermentation commands 68.34% of the cysteine market share in 2025, translating into the largest contribution to overall volume. The segment benefits from consumer alignment with vegan and halal standards, strengthening its position as the default source for pharmaceutical and food producers. Synthetic pathways are smaller yet notable for a 6.05% CAGR, reflecting corporate initiatives to secure dual-sourced supply and circumvent fermentation capacity bottlenecks.
Recent investments have lifted fermenter yields through metabolic-pathway engineering that shortens reaction cycles and raises titers. As installed stainless-steel capacity ramps in China, Spain, and the Midwestern United States, fermentation retains cost leadership at full load factors. Chemical synthesis remains advantageous in niche derivative production where complex thiocarbonylation offers purity benefits. The interplay keeps both routes active but leaves natural fermentation as the anchor of the cysteine market.
By Application: Reducing Agents Lead While Conditioners Accelerate
The reducing-agent category captured 28.55% of the cysteine market size in 2025 due to extensive use in dough softening, injectable drugs, and industrial redox systems. Its dominance reflects longstanding formulation standards and predictable purchasing cycles across bakeries and pharmaceutical fill-finish lines. Conditioner applications, however, post a 6.12% CAGR, as cosmetic brands market plant-based smoothing lotions and shampoos in Asia-Pacific malls and Latin American salons.
Flavor enhancer volumes tick upward as snack and broth manufacturers seek natural savory tonalities. Niche adoption in fuel-cell membrane fabrication remains early but signals longer-run optionality. Overall, broadening personal-care use balances the maturity of food and pharma staples, sustaining healthy diversity within the cysteine market.


By End-User Industry: Food Sector Remains Growth Engine
Food processors accounted for 49.25% of the cysteine market size in 2025 and are forecast to grow 5.91% annually to 2031. The segment relies on cysteine for dough elasticity, flavor development, and antioxidant function, with clean-label claims enabling price premiums. Pharmaceutical producers follow a mid-single-digit expansion as plant-based parenteral nutrition and peptide synthesis absorb more volume.
Animal feed integrators and aquaculture farms add incremental demand by supplementing sulfur amino acids to boost weight gain and immunity. Personal-care formulators inject further upside through skin-care antioxidants and hair-bond builders. The composite picture illustrates how diversified demand anchors the cysteine market against any industry's cyclical downturns.
Geography Analysis
Asia-Pacific generated 47.60% of the cysteine market size in 2025, underpinned by integrated sugar refining, low-cost labor, and government-supported biotech parks. Regional producers benefit from captive demand within China’s bakery, instant-noodle, and generics sectors, while export lanes serve price-sensitive users in Africa and the Middle East. Growth remains strongest at 5.82% CAGR as India’s injectable-nutrition manufacturers and Korea’s cosmetic giants widen procurement volumes.
North America ranks second, propelled by well-defined FDA pathways and abundant corn substrates that lower feedstock costs. Fermentation investments cluster around the Midwest, where ethanol by-products feed amino acid lines, reducing inbound logistics. Regulatory emphasis on animal-free sourcing further redirects domestic buyers to fermentation grades, lifting the regional cysteine market.
Europe contributes steady mid-single-digit growth, anchored by Germany and Spain’s pharmaceutical-grade facilities that operate under stringent GMP and sustainability codes. Carbon-neutral production targets attract premium buyers in medical nutrition and infant formula. EU labeling laws restrict animal-hair origin inputs, consolidating demand around plant-based supply. Collectively, these dynamics place Europe as an innovation node that cross-pollinates process advances throughout the cysteine market.

Competitive Landscape
The cysteine market features moderate consolidation, with a handful of integrated chemical and nutrition players controlling key patents, strains, and customer relationships. Wacker Chemie extends its FERMOPURE range to specialty derivatives that satisfy ICH Q7 pharmaceutical guidelines, leveraging multi-continent production to guarantee continuity[3]Wacker Chemie, “FERMOPURE Sustainable L-Cysteine,” wacker.com.
Process innovation remains the primary differentiation lever. Evonik pioneers dipeptide solutions that unlock high-density cell culture, securing long-term supply contracts with vaccine developers, healthcare.evonik.com. Smaller firms explore waste-to-value feedstocks to cut operating costs and carbon footprints. Patent filings in palladium-mediated S-arylation and solvent-assisted peptide folding illustrate ongoing chemistry breakthroughs that spawn new niches inside the cysteine market.
Cysteine Industry Leaders
-
Wacker Chemie AG
-
Merck KGaA
-
Ajinomoto Co., Inc.
-
CJ CHEILJEDANG CORP
-
Evonik Industries AG
- *Disclaimer: Major Players sorted in no particular order

Recent Industry Developments
- March 2024: Xi'an Jiaotong-Liverpool University and Nanyang Technological University researchers developed a revolutionary method for producing cysteine-rich peptides over 100,000 times faster than traditional methods, potentially transforming pharmaceutical manufacturing economics.
- February 2023: CJ Food & Nutrition Tech launched FlavorNrich, the world's first non-electrolytic functional amino acid cysteine product, targeting the United States market as part of their strategy to become a total solutions provider in food and nutrition.


Research Methodology Framework and Report Scope
Market Definitions and Key Coverage
Our study treats the global cysteine market as the annual output and trade of pure L-cysteine, whether obtained through microbial fermentation, enzymatic hydrolysis, or traditional protein hydrolysis, and supplied in food, pharma, personal care, feed, and industrial grades.
Scope exclusion: Derivative molecules such as N-acetyl-cysteine and cystine are analyzed qualitatively but excluded from quantitative sizing.
Segmentation Overview
-
By Production Process
- Natural (Fermentation)
- Synthetic (Hydrolysis)
-
By Application
- Flavor Enhancer
- Reducing Agent
- Conditioner
- Production of Human Insulin
- Other Applications (Antioxidant & Anti-aging Agent, etc.)
-
By End-user Industry
- Food
- Pharmaceutical
- Animal Feed
- Other End-User Industries (Marine & Aquaculture, Personal-care & Cosmetics, etc.)
-
By Geography
-
Asia-Pacific
- China
- India
- Japan
- South Korea
- ASEAN Countries
- Rest of Asia-Pacific
-
North America
- United States
- Canada
- Mexico
-
Europe
- Germany
- United Kingdom
- France
- Italy
- Russia
- Nordic Countries
- Rest of Europe
-
South America
- Brazil
- Argentina
- Rest of South America
-
Middle East and Africa
- GCC Countries
- South Africa
- Rest of Middle East and Africa
-
Asia-Pacific
Detailed Research Methodology and Data Validation
Primary Research
To close information gaps, we conducted interviews with procurement managers at bakery improver firms, formulation chemists at multinational hair care brands, and distributors covering Southeast Asia, North America, and Europe. Their insights on contract pricing spreads, fermentation plant utilization, and synthetic-grade substitution rates helped us fine-tune cost curves and regional demand pools.
Desk Research
Analysts first mapped production and trade using freely available customs data sets such as UN Comtrade, USDA Foreign Agricultural Service shipment records, and Eurostat's Prodcom tables, which list bulk amino acid volumes and values by HS code. Price movements and purity specifications were tracked through industry association bulletins like the European Amino Acid Producers Group and monthly spot quotations gathered from the Japan External Trade Organization. Company 10-K filings, investor decks, and press releases helped us trace capacity expansions, average selling prices, and forward contracts, while patents pulled via Questel signaled upcoming process yields and cost curves. D&B Hoovers supplied privately held producer revenues that are otherwise opaque. This list is illustrative; many additional open databases and publications informed the desk phase.
Market-Sizing & Forecasting
A top-down reconstruction of global supply, built from production capacity, typical utilization, and net trade balances, yielded the 2025 baseline. Selective bottom-up checks, for example, rolling up sampled ASP × volume from six leading suppliers, ensured totals stayed within commercially plausible bounds. Key model drivers include average fermentation yield per cubic meter, food grade adoption in clean label dough conditioners, hair smoothing kit penetration in salon outlets, regulatory phase-outs of animal-sourced hydrolysate, and regional corn or sugar feedstock prices. Multivariate regression aligns these variables with historical volume swings, after which scenario analysis captures price elastic shifts in downstream applications. Where supplier data were thin, volumes were interpolated from import declarations and validated with distributor feedback.
Data Validation & Update Cycle
Outputs undergo multi-source triangulation, variance checks against external price and volume signals, and senior analyst review before sign-off. Mordor refreshes every twelve months, with mid-cycle revisions triggered by plant shutdowns, trade policy shifts, or material price shocks, and clients receive the freshly vetted file prior to delivery.
Why Mordor's Cysteine Baseline Earns Stakeholder Confidence
Published figures vary because providers choose different molecular scopes, price assumptions, and refresh cadences.
Key gap drivers include whether derivatives are bundled, the aggressiveness of ASP escalation, and how frequently producer surveys are repeated, which can inflate or deflate totals compared with Mordor's annually updated pure compound view.
Benchmark comparison
| Market Size | Anonymized source | Primary gap driver |
|---|---|---|
| 11.65 kilotons (2025) | Mordor Intelligence | - |
| USD 154.6 million (2025) | Global Consultancy A | Bundles cysteine and all derivatives, uses fixed 2019 ASP, five-year refresh |
| USD 462.1 million (2024) | Trade Journal B | Applies aggressive pharma grade price premium, lacks capacity cross-check |
The comparison shows that figures swing widely when scope or price logic drifts. By isolating pure L-cysteine, updating yields and prices each year, and validating numbers through producer and buyer dialogues, Mordor Intelligence supplies a balanced, transparent baseline that decision makers can replicate and trust.


Key Questions Answered in the Report
How big is the Cysteine Market?
The Cysteine Market size is valued at 12.23 kilotons in 2026 and and is projected to reach 15.57 kilotons by 2031.
Which region leads the cysteine market?
Asia-Pacific leads with 47.60% market share in 2025 and shows the fastest growth at a 5.82% CAGR through 2031.
Why is bio-fermentation important for cysteine supply?
Bio-fermentation is crucial for cysteine production because it offers a renewable and sustainable alternative to traditional methods like keratin extraction, which have safety and environmental concerns.
Which application segment is expanding the fastest?
Conditioner formulations used in haircare and personal-care products are advancing at a 6.12% CAGR to 2031.
How are raw material prices affecting cysteine producers?
Volatile sugar and corn-steep liquor prices compress fermentation margins, posing a -0.7% drag on forecast CAGR.
Page last updated on:


