
AdBlue Market Size and Share
Market Overview
| Study Period | 2020 - 2031 |
|---|---|
| Market Size (2026) | USD 33.93 Billion |
| Market Size (2031) | USD 43.81 Billion |
| Growth Rate (2026 - 2031) | 5.23 % |
| Fastest Growing Market | Asia Pacific |
| Largest Market | Europe |
| Market Concentration | Low |
Major Players *Disclaimer: Major Players sorted in no particular order Image © Mordor Intelligence. Reuse requires attribution under CC BY 4.0. | |
AdBlue Market Analysis by Mordor Intelligence
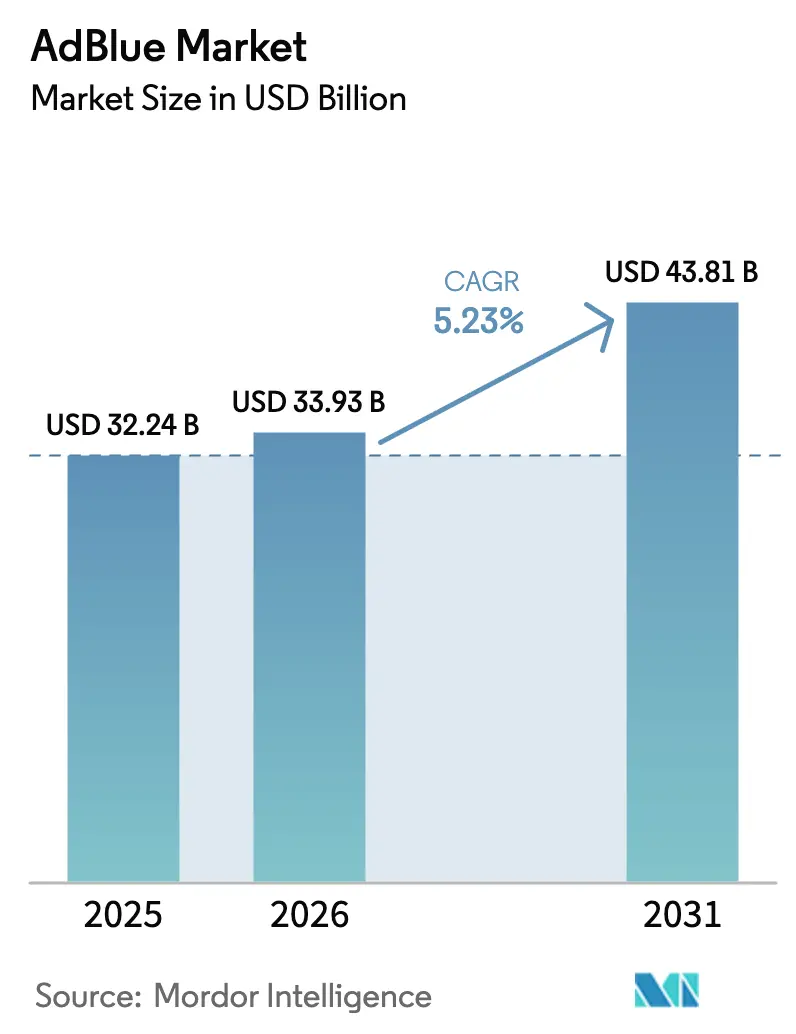
The AdBlue market size is expected to grow from USD 32.24 billion in 2025 to USD 33.93 billion in 2026 and is forecast to reach USD 43.81 billion by 2031 at 5.23% CAGR over 2026-2031. Continuing reliance on diesel powertrains in heavy-duty transport anchors near-term demand even as e-truck registrations trend higher, because selective catalytic reduction remains mandatory for the vast diesel fleet on the road. Progressive NOx rules in Europe, China, and India lift fluid consumption per vehicle by requiring tighter ammonia-slip controls and longer durability periods. The rapid roll-out of dispensing infrastructure in emerging markets enhances refill convenience and reduces system derate incidents, thereby supporting uptake among first-time users. Telematics-enabled dosing cuts unnecessary injections by linking urea flow to real-time NOx data, lowering operating cost while safeguarding compliance margins. Volatile urea feedstock prices and the gradual shift to zero-emission vehicles pose headwinds; however, these risks are partly offset by the expanding use in non-road machinery and retrofit programs in regions that tighten local ordinances.
Key Report Takeaways
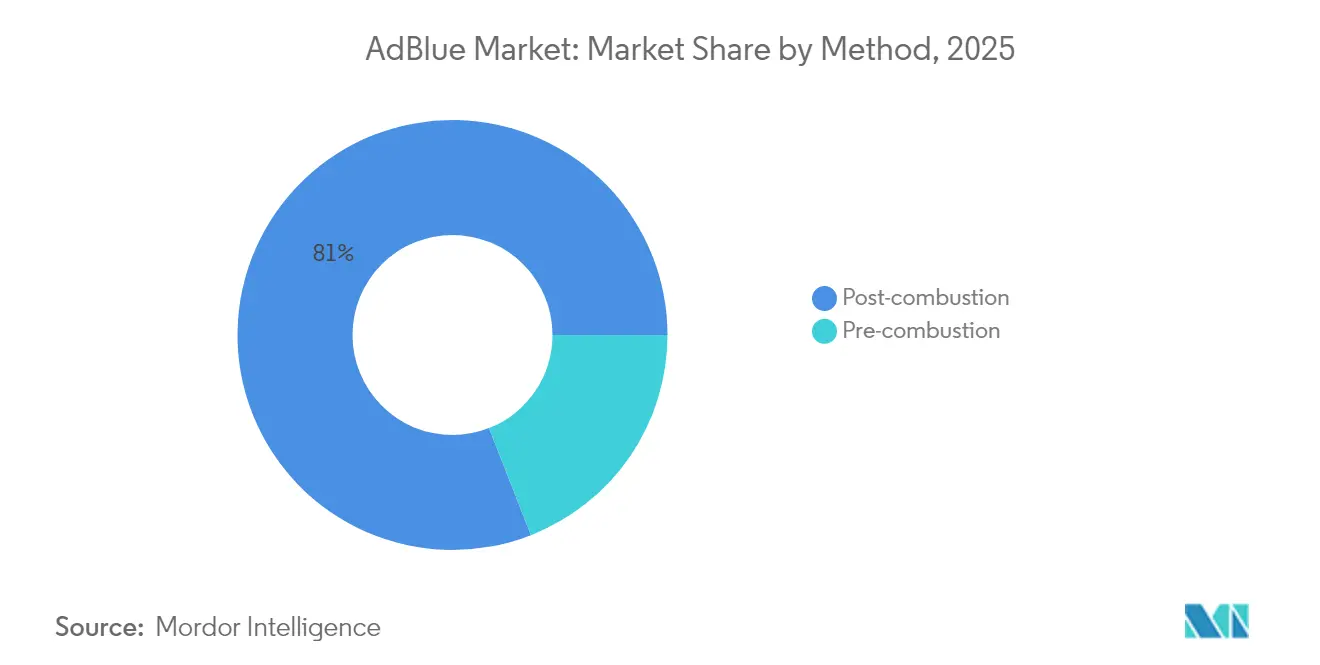
- By method, post-combustion selective catalytic reduction led with an 80.95% AdBlue market share in 2025, while pre-combustion dosing is forecast to expand at a 5.58% CAGR through 2031.
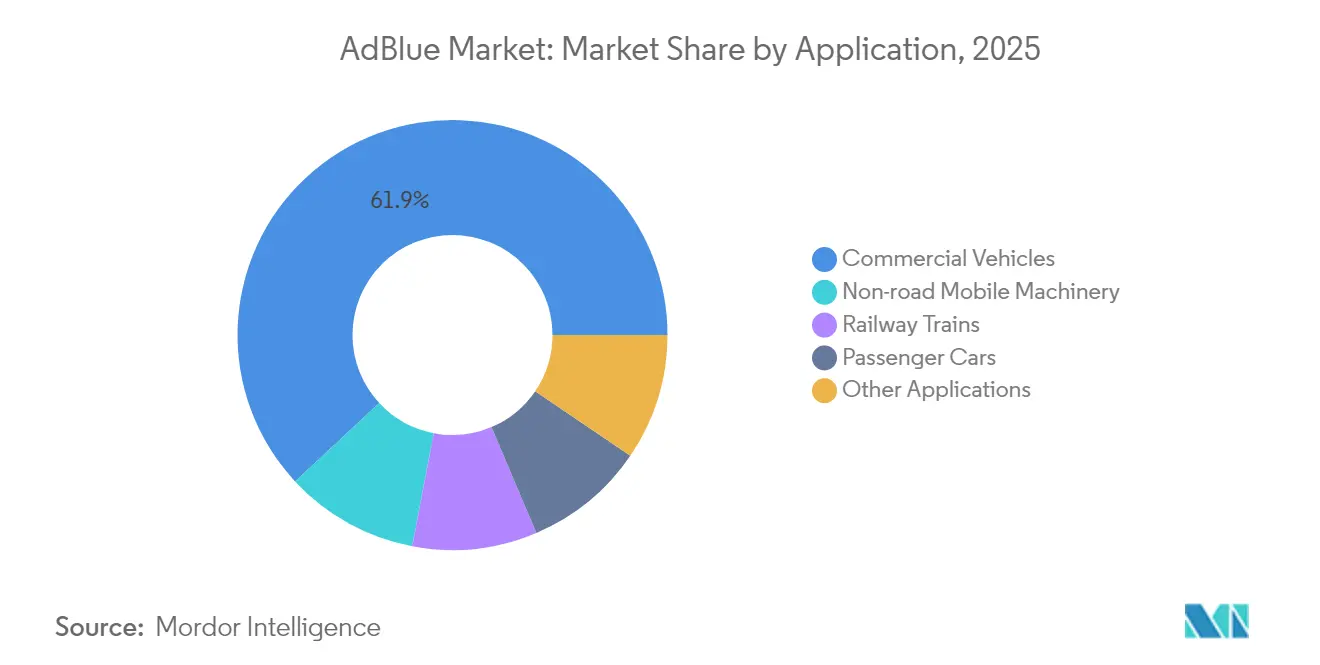
- By application, commercial vehicles accounted for 61.92% of the AdBlue market size in 2025, and non-road mobile machinery is projected to advance at a 5.96% CAGR through 2031.
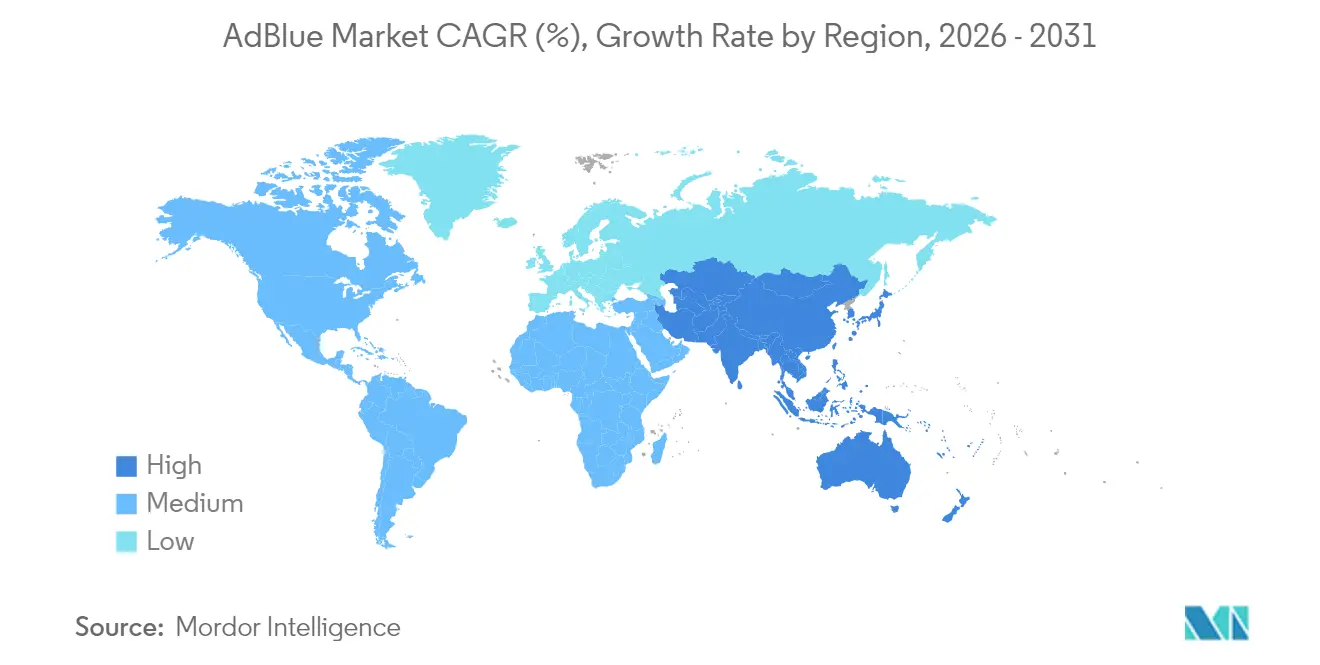
- By geography, Europe captured 38.12% of the AdBlue market share in 2025, whereas Asia-Pacific is projected to grow fastest at a 6.05% CAGR between 2026 and 2031.
Note: Market size and forecast figures in this report are generated using Mordor Intelligence’s proprietary estimation framework, updated with the latest available data and insights as of 2026.
Market Trends and Insights
Drivers Impact Analysis of AdBlue Market*
| Driver | (~) % Impact on CAGR Forecast | Geographic Relevance | Impact Timeline |
|---|---|---|---|
| Stricter Global NOx-Emission Regulations | +1.8% | EU, China, India | Medium term (2-4 years) |
| Rapid SCR Uptake Across Non-Road Machinery | +1.2% | EU, North America, China | Medium term (2-4 years) |
| Expansion of AdBlue Retail Infrastructure in Emerging Markets | +0.9% | APAC, Middle East, Africa | Long term (≥4 years) |
| Surge in E-Commerce Logistics Diesel Mileage | +0.7% | North America, EU, China | Short term (≤2 years) |
| Telematics-Driven Dosing and Fleet Analytics | +0.5% | Global | Medium term (2-4 years) |
| Source: Mordor Intelligence | |||
Stricter Global NOx-Emission Regulations
Euro 7 limits effective from 2026 for light-duty vehicles and 2028 for heavy-duty trucks tighten real-driving NOx caps to 60 mg/km and introduce ammonia-slip ceilings, obligating manufacturers to integrate NH3 sensors and larger urea tanks[1]European Commission, “Proposal for Euro 7 Standards,” europa.eu. China’s National VI rule mandates on-board monitoring that uploads SCR data to provincial servers, discouraging underdosing to save fluid. India’s BS-VI Phase 2 introduces real-driving-emissions tests, which accelerate the roll-out of highway dispensers by state fuel retailers. The United States finalizes EPA 2027 requirements, demanding a 90% NOx cut by 2031, which pushes engine makers toward dual-dosing architectures. ASEAN economies trail, but Vietnam’s Euro 5 adoption signals regional tightening that widens the addressable AdBlue market.
Rapid SCR Uptake Across Non-Road Machinery
EU Stage V rules require SCR-plus-DPF systems on engines exceeding 56 kW, including excavators, wheel loaders, and tractors, where refill intervals remain a significant operational challenge. North America’s Tier 4 Final drives are similar to those in agricultural and construction fleets, with telematics alerts preventing mid-shift derates. Mining haul trucks in Canada and Chile validate low-temperature formulations to prevent crystallization at high altitudes. China’s move to National IV in non-road engines spurs Sinopec to market a dedicated low-biuret grade for urban equipment. These developments collectively lift AdBlue intensity per machine and diversify demand beyond on-road vehicles.
Expansion of AdBlue Retail Infrastructure in Emerging Markets
Indian Oil, Bharat Petroleum, and Hindustan Petroleum plan to install 500 new dispensers by 2026, targeting Tier 2 and Tier 3 corridors where BS-VI fleets operate. Petronas and PTT expand coverage along pan-ASEAN routes, although Indonesia and Vietnam still rely on more costly drum supply. In the Middle East, Saudi Aramco and ADNOC are rolling out highway dispensers to support Euro 5-compliant imports, aiming to reach 200 sites by 2026. South Africa’s network primarily grows around Gauteng and the Western Cape, yet rural gaps persist, limiting the uptake of Euro 5 trucks. Better availability helps trim system derates and supports the AdBlue market in first-time adopter regions.
Surge in E-Commerce Logistics Diesel Mileage
Last-mile delivery pushes diesel vans and light trucks to higher annual mileage, sustaining demand for fluid despite the parallel electrification of dense urban routes. China’s express-delivery sector used approximately 12 million tonnes of diesel in 2024, translating to roughly 0.5–0.6 million tonnes of AdBlue at 4–5% dosing rates. European parcel carriers report an 8–10% yearly growth in mileage, offsetting per-vehicle efficiency gains. North American LTL fleets shift toward larger Class 8 trucks, which consume more AdBlue per ton-mile. The logistics boom, therefore, underpins steady baseline demand through the forecast period.
Restraints Impact Analysis of AdBlue Market*
| Restraint | (~) % Impact on CAGR Forecast | Geographic Relevance | Impact Timeline |
|---|---|---|---|
| Rising Light-Duty EV Penetration | -1.1% | EU, China, North America | Medium term (2-4 years) |
| Volatile Urea Feedstock Prices | -0.6% | Global | Short term (≤2 years) |
| Counterfeit / Contaminated AdBlue Risk | -0.4% | APAC, Middle East, Africa | Long term (≥4 years) |
| Source: Mordor Intelligence | |||
Rising Light-Duty EV Penetration
Battery-electric trucks achieved total cost parity with diesel in several urban duty cycles by 2024, accelerating electrification in delivery and regional haul segments[2]Nature Energy, “Total Cost Parity for Electric Trucks,” nature.com. California’s Advanced Clean Trucks rule demands up to 75% zero-emission Class 7–8 sales by 2035, shrinking diesel’s addressable base in the state that holds 12% of U.S. heavy-duty registrations. China mandates 100% electric buses and taxis in key cities, eroding demand for AdBlue in the 3.5–7.5 t bracket. Europe’s CO2 standards push OEMs toward battery and fuel-cell options for urban distribution vehicles. Although long-haul diesel remains prevalent, these urban shifts modestly alter the trajectory of the AdBlue market.
Volatile Urea Feedstock Prices
Urea trades about 45% above pre-2022 averages due to gas supply fragility, export quotas, and geopolitical tensions. Regional divergence is pronounced, with the Middle East FOB up 30.3% in 2025, while China FOB fell 12.6%, complicating procurement for global distributors. Producers under long-term fleet contracts often struggle to pass through cost spikes, which squeezes their margins and deters new entrants. Integrated fertilizer majors absorb volatility better, consolidating supply in the AdBlue market. Persistent feedstock swings therefore shave growth momentum, especially for independent blenders.
*Our forecasts treat driver/restraint impacts as directional, not additive. The impact forecasts reflect baseline growth, mix effects, and variable interactions.
AdBlue Market Segment Analysis
By Method:
Post-Combustion Dominance Anchors Baseline DemandPost-combustion method captured 80.95% of the AdBlue market share in 2025, reflecting near-universal use in on-road diesel engines where urea is injected into the exhaust stream to convert NOx. This layout is embedded in Euro 7, EPA 2027, and China National VI, making it the industry baseline well past 2030. Pre-combustion dosing is forecast to grow at a rate of 5.58% as specialized sectors, such as marine diesel and stationary generators, pursue fuel efficiency gains. Railway locomotives and hybrid EGR-SCR setups in mining equipment strike a balance between durability and fluid consumption, ensuring ongoing relevance after combustion. Passenger cars carry 10–20 l tanks aligned with oil-change intervals, while commercial vehicles use 40–80 l tanks monitored by telematics that warn operators before derate thresholds activate.
Pre-combustion approaches inject ammonia directly into the cylinder, lowering peak combustion temperature and cutting NOx at the source. Technical hurdles include higher thermal stress and the risk of NH3 slip, yet 2–3% fuel-efficiency gains appeal to marine and fixed-plant operators. IMO Tier III stimulates trials on coastal vessels that cannot accommodate bulky SCR reactors. China’s industrial zones cap stack NOx at 50 mg/Nm³, prompting power plants to test pre-combustion dosing that circumvents retrofit space constraints. Even so, the AdBlue market remains anchored by post-combustion SCR, which offers proven compliance across the broadest range of mobile engines.



By Application:
Commercial Vehicles Lead, Non-Road Machinery AcceleratesCommercial vehicles accounted for 61.92% of the AdBlue market size in 2025, underpinned by the heavy-duty truck fleet that consumed 16.8 million barrels per day of oil in 2023 at dosing ratios of 4–5%. Long-haul tractors, regional haul rigs, and intercity buses rely on fluid availability along highway corridors, prompting retailers to integrate dispensers at service stations in Europe and North America. Delivery vans sustain demand in last-mile logistics despite partial electrification, because suburban and rural routes still favor diesel. Engine makers introduce predictive dosing, which reduces consumption without compromising compliance, marginally moderating per-vehicle fluid growth while improving fleet economics.
Non-road mobile machinery is advancing at a 5.96% CAGR, lifted by EU Stage V and EPA Tier 4 Final requirements on equipment above 56 kW. Construction, mining, and agricultural segments integrate 20–50 l tanks, supplemented by telemetry that guides operators on refill timing. China transitions to National IV in non-road engines, creating the world’s largest incremental pool for AdBlue suppliers. Passenger-car demand softens in Europe, where diesel registrations fade, yet remains stable in India and parts of ASEAN, where fuel economics favor diesel. Rail and marine applications add a smaller but steady contribution, supported by long equipment life and retrofit mandates.
Geography Analysis
Europe AdBlue Market
Europe commanded a 38.12% market share of the AdBlue market in 2025, largely due to the implementation of the Euro 7 rules and a vast long-haul truck fleet. Germany, France, and the United Kingdom maintain high per-vehicle dosing due to strict ammonia-slip limits and extended durability testing. Nordic fleets test cold-weather dual-dosing to secure compliance at sub-20 °C, illustrating regional engineering adaptations. Spain and Italy face gaps in rural dispensers that TotalEnergies and Shell aim to close along the Mediterranean freight corridors. Post-Brexit divergence obliges fleets to navigate separate EU and UK rules; however, both regimes maintain SCR obligations, preserving a baseline of fluid demand.
APAC AdBlue Market
The Asia-Pacific region is the fastest-growing, with a 6.05% CAGR to 2031, driven by China’s OBM enforcement and India’s BS-VI Phase 2 RDE testing. Sinopec’s nationwide network of 30,000 stations alleviates refill anxiety and fosters domestic brand loyalty. Indian Oil and peers expand infrastructure along the Golden Quadrilateral, yet rural gaps encourage fleet stockpiling. Japan’s mature market stabilizes as diesel share in passenger cars shrinks, while South Korea posts modest growth tied to trucking and construction. ASEAN’s fragmented standards delay uniform uptake, but Vietnam and Malaysia show early momentum as Euro 5 rules take hold.
The Americas and MEA AdBlue Market
North America held a mid-teens share in 2024. EPA 2027 pushes engine builders toward higher-efficiency SCR, sustaining fluid use per vehicle. California’s zero-emission sales mandates tighten long-term diesel prospects, yet the multi-year phase-in keeps the existing fleet reliant on AdBlue. Canada’s demand concentrates along the Trans-Canada Highway, with Petro-Canada and Shell hosting the largest dispenser networks. Mexico’s cross-border operators adopt SCR to meet U.S. entry rules, prompting Pemex to bolster supply in northern states. Brazil leads South America after PROCONVE P8 enforcement, yet vast interior regions remain underserved. Saudi Arabia and the UAE invest in highway networks that underpin early Euro 5 truck adoption, while South Africa’s mining logistics maintain demand around Gauteng and the Western Cape.

Regulatory Landscape
AdBlue demand is tied to diesel NOx-compliance frameworks that require SCR across much of the on-road and off-road fleet, with real-driving and durability expectations tightening over time. In Europe, Euro 7 introduces tougher real-driving NOx limits for light-duty vehicles from 2026 and for heavy-duty trucks from 2028, along with stricter ammonia-slip control. That combination pushes OEMs toward aftertreatment monitoring and dosing strategies that keep AdBlue consumption closely linked to compliance.
In North America, the US EPA has taken steps on DEF system implementation, with August 2025 and March 2026 actions addressing derate behavior and enabling software revisions, including allowances around sensing approaches. A July 2026 proposal retained emissions standards while adjusting elements such as warranty requirements and compliance timing. In parallel, EU Regulation 2026/1046 on CO2 targets for new heavy-duty vehicles reinforces OEM attention on efficient aftertreatment and verified emissions control, which keeps AdBlue quality, dispensing integrity, and onboard monitoring central to regulatory compliance.
Value Chain Analysis
The AdBlue value chain begins with upstream natural gas and hydrogen inputs used to produce ammonia and urea. It then moves through purification and blending into automotive-grade urea solution, followed by quality assurance, packaging, and distribution. Integrated producers with fertilizer and industrial nitrogen footprints, such as BASF and Yara, manage feedstock and supply variability through captive or tightly contracted procurement and large-scale plants. Independent blenders depend more on merchant urea procurement and third-party logistics.
Downstream, distribution covers bulk delivery to fleet depots and workshops, retail dispensing at fuel stations, and packaged formats (IBC and drums) for remote and non-road users. Yara operates a global network spanning multiple large-scale production assets and terminals, while retail-led players and channel partners broaden access through service-station dispensers and private-label formats. Traceability and contamination control requirements are increasingly shaping the chain, with telematics-enabled tanks and automated replenishment models gaining traction where fleets aim to avoid derates and lower total compliance costs.
Competitive Landscape
The AdBlue Market is fragmented. Integrated fertilizer majors BASF, Yara, and CF Industries combine captive urea production with broad distribution, enabling them to better absorb feedstock volatility than independent blenders. Sinopec dominates China with projected consumption exceeding 25 million tons in 2025 under National VI truck subsidies. TotalEnergies and Shell lead the European retail sector, embedding fluid dispensers at service stations and introducing RFID-enabled traceability to mitigate the risk of counterfeit products. Cummins and Bosch differentiate themselves through predictive dosing, which reduces consumption by up to 5%, appealing to cost-sensitive fleets.
AdBlue Industry Leaders
Shell plc
BASF
Yara
CF Industries Holdings, Inc.
GreenChem
- *Disclaimer: Major Players sorted in no particular order

AdBlue Market Companies Covered in this Report
- BASF
- Bosch Limited
- Brenntag SpA
- CF Industries Holdings, Inc.
- China Petrochemical corporation (Sinopec)
- CrossChem
- Cummins Inc.,
- Enilive S.p.A.
- GreenChem
- Komatsu.
- LAT Nitrogen Austria GmbH
- Mitsui Chemicals Inc.
- NANDAN PETROCHEM LTD
- Old World Industries
- S.C. OMV PETROM S.A.
- Shell plc
- STOCKMEIER Group
- TotalEnergies
- Yara

Market Opportunities and Future Outlook
Decarbonized AdBlue supply and differentiated, low-carbon product grades are creating whitespace for suppliers that can document lower manufacturing-related emissions without changing end-user operating practices. In February 2026, BASF launched AdBlue GE (Green Electricity), produced using renewable electricity attributed via mass balance, and started market introduction with a distribution partner in Switzerland, pointing to a premiumization track for fleet procurement programs that incorporate carbon-footprint criteria alongside ISO and quality requirements.
Opportunity also sits in upstream integration and regional resilience, given the market sensitivity to urea and ammonia economics. In July 2026, Yara announced a USD 1.3 billion acquisition of a Gulf Coast ammonia plant, aligned with its ammonia investment strategy and improving access to US-linked feedstock economics. That structure can support more stable AdBlue supply for North American distributors and fleets. On the demand side, regulatory and operational shifts that emphasize verified emissions performance, including EPA actions on DEF system implementation and Euro 7 requirements, open room for Fluid-as-a-Service models that combine IoT-enabled storage, automatic replenishment, and data-backed compliance support for both commercial and non-road operators.
Recent Industry Developments in AdBlue Market
- March 2026: BASF reports that regional transport and logistics disruptions have pressured European AdBlue prices due to supply chain disruptions linked to the conflict in the Middle East. The action highlights the need for risk management across feedstock and logistics, with potential margin pressures for AdBlue players.
- February 2026: BASF launched AdBlue GE (Green Electricity), produced using 100% renewable electricity from offshore wind and mass-balance attribution. The launch supports a decarbonization-focused AdBlue variant and helps lower the product carbon footprint while aligning with sustainability agendas.
- February 2026: BASF initiated the market introduction of AdBlue GE in Switzerland in collaboration with Thommen Furler, with phased European expansion planned. The entry strengthens BASF distribution footprint and regional adoption of renewable-energy AdBlue, while setting the stage for broader European rollout.


AdBlue Market Report Scope and Research Methodology
Market Definition and Coverage
For this report, we define the AdBlue market as the value of standardized aqueous urea solution sold for use in selective catalytic reduction systems that reduce NOx from diesel exhaust across on-road and off-road equipment.
Scope exclusions: This sizing excludes SCR hardware and sensors, installation or servicing labor, and other fuel or exhaust aftertreatment chemicals that are not ISO 22241 AdBlue.
Segments Covered in This Report
- By Method
- Pre-combustion
- Post-combustion
- By Application
- Commercial Vehicles
- Passenger Cars
- Railway Trains
- Non-road Mobile Machinery
- Other Applications
- Geography
- Asia-Pacific
- China
- India
- Japan
- South Korea
- ASEAN Countries
- Rest of Asia-Pacific
- North America
- United States
- Canada
- Mexico
- Europe
- Germany
- United Kingdom
- France
- Italy
- Russia
- Spain
- NORDIC Countries
- Rest of Europe
- South America
- Brazil
- Argentina
- Rest of South America
- Middle-East and Africa
- Saudi Arabia
- South Africa
- Rest of Middle East and Africa
- Asia-Pacific
Data Sources, Market Sizing, and Validation
Desk Research
We started by mapping the demand pool and the supply chain, so later assumptions could be tested against real-world activity. For this, we relied on public rulebooks and datasets such as the European Commission emissions standards library, the US EPA heavy-duty diesel program materials, UNECE vehicle regulations, and national transport statistics that track vehicle parc and new registrations.
Next, we gathered context on consumption intensity and compliance behavior using sources such as ISO 22241 documentation, technical papers from SAE International and other peer-reviewed journals, and trade and customs releases where urea solution trade is visible. Company annual reports, investor presentations, and reputable press were used to understand plant additions, distribution footprints, and price movements, which were then checked against a paid subscription for company financials and a shipment-level import and export database when country trade needed more granularity. This list is illustrative, and other public and paid sources were also used to collect data, validate assumptions, and clarify open points.
Primary Interviews and Surveys
To pressure-test the desk view, we spoke with industry participants across production, blending and packaging, distribution and retail dispensing, fleet operations, and aftertreatment service networks. Inputs focused on typical dosing rates, channel margins, contract versus spot buying, seasonal refill patterns, and how compliance rules translate into real consumption by region, so gaps in public data could be closed and assumptions triangulated.
Distribution of primary research fieldwork respondents
| Company type | Respondent position | Region |
|---|---|---|
| Top tier: 30% | CXOs: 16% | APAC: 49% |
| Mid tier: 49% | Functional/Unit leaders: 36% | EMEA: 29% |
| Smaller Players: 21% | Managers: 48% | Americas: 22% |
Market-Sizing & Forecasting
The core model was built using a top-down approach where vehicle parc and diesel activity are translated into AdBlue consumption, and then value is reconstructed using observed price bands by packaging format and channel. To keep it grounded, we corroborated the results with selective bottom-up checks such as supplier revenue roll-ups where disclosures exist, distributor channel checks, and sampled volume times ASP calculations in a few anchor countries, and then adjusted totals if the cross-checks showed consistent bias.
Key inputs included heavy-duty truck and bus parc, non-road machinery population, typical SCR dosing rates (as a percent of diesel use), refill infrastructure density, urea feedstock price trends, and the share of fleets operating under tighter NOx regimes. Forecasts were shaped using scenario analysis, where base, conservative, and high-compliance cases were run and then aligned to what primary respondents expect for regulation enforcement and diesel fleet turnover. Where bottom-up visibility was weak, we used proxy indicators such as diesel consumption trends and fleet utilization, followed by interview-based correction factors.
Data Validation & Update Cycle
Outputs were validated through multiple passes, starting with internal consistency checks across volume, price, and implied per-vehicle consumption, which were then compared with independent signals like diesel demand direction, urea pricing moves, and reported capacity changes. When an outlier appeared, we revisited the assumption, rechecked the data point, and triggered follow-up calls if the variance could not be explained by seasonality or temporary supply disruptions.
Before sign-off, another analyst reviews the model logic, key inputs, and sensitivity ranges so the final numbers are not dependent on a single judgment call. Reports are refreshed on an annual cycle, and interim updates are made when material events occur, such as major regulation shifts, sharp urea price changes, or meaningful capacity additions. Right before delivery, we do a fresh scan of recent developments so clients receive the latest updated view.
Mordor Intelligence's Adblue Market Size Compared Against Other Published Estimates
Published market values for AdBlue can look far apart, even when they seem to describe the same thing, because the boundary between product types, use-cases, and price points is not always handled the same way. Differences usually come from what is counted as AdBlue versus adjacent urea solutions, which geographies are fully covered, and whether prices are treated as stable averages or as time-specific snapshots.
A practical driver of gaps is refresh cadence and currency timing, since urea-linked pricing can move quickly and exchange rates can change the reported USD value even when physical consumption is steady. Those timing choices can also affect how bulk versus packaged ASPs are blended in the total. In this case, the checks that anchor the ASP ladder to observed channel behavior are updated before the market-year close and then revalidated in the publication pass, which is why the 2026 figure lands where it does in the table, a refresh-led choice applied by Mordor Intelligence.
Benchmark comparison
| Source | Market Size | Gaps in Research Methodology |
|---|---|---|
| Mordor Intelligence | USD 33.93 B (2026) | |
| Industry Research Desk A | USD 31.30 B (2025) | Uses a prior-year base and typically applies a smoother price curve, which can understate the impact of near-term urea swings and shifts in bulk versus packaged mix when converting to USD value. |
| Industry Release B | USD 34.20 B (2024) | Often reports an earlier snapshot year and may blend in broader urea solution demand tied to emissions control without consistently separating ISO 22241 AdBlue volumes, which can lift the stated market value. |
Overall, the spread is mainly explained by timing (base year and currency conversion point) and by how strictly AdBlue is separated from nearby urea solution categories. By keeping the model tied to vehicle activity, dosing intensity, and a channel-specific ASP ladder that is periodically rechecked, the market value stays traceable to a few repeatable steps that clients can challenge and reproduce.


Key Questions Answered in the Report
How large is the AdBlue market in 2026?
The AdBlue market size stands at USD 33.93 billion in 2026.
What growth rate is expected for AdBlue between 2026 and 2031?
The market is forecast to grow at a 5.23% CAGR, reaching USD 43.81 billion by 2031.
Which region leads AdBlue consumption today?
Europe leads with 38.12% share thanks to stringent Euro emission rules.
Where is the fastest growth expected?
Asia-Pacific is projected to expand at a 6.05% CAGR through 2031 as China and India tighten NOx standards.
Which application segment dominates AdBlue demand?
Commercial vehicles contribute 61.92% of global demand, driven by long-haul trucks and buses.
Page last updated on:


 Your data is secure and never sold or shared.


