
Triacetin Market Size and Share
Market Overview
| Study Period | 2021 - 2031 |
|---|---|
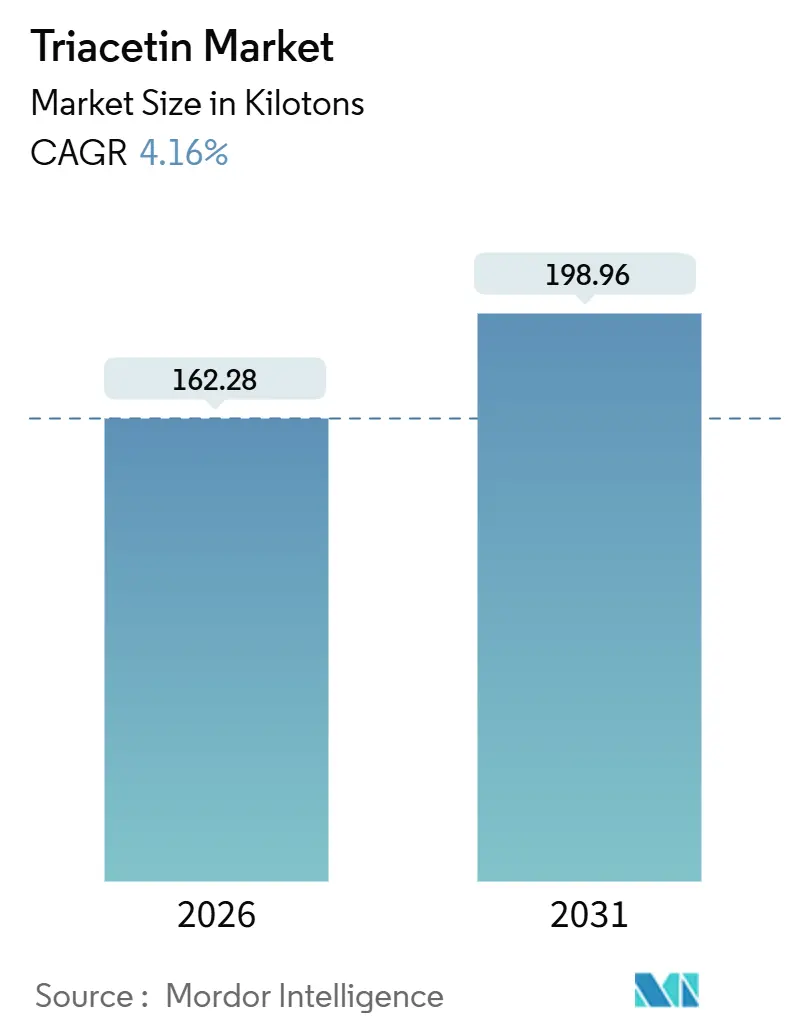
| Market Volume (2026) | 162.28 kilotons |
| Market Volume (2031) | 198.96 kilotons |
| Growth Rate (2026 - 2031) | 4.16 % |
| Fastest Growing Market | Asia Pacific |
| Largest Market | Asia Pacific |
| Market Concentration | Medium |
Major Players *Disclaimer: Major Players sorted in no particular order Image © Mordor Intelligence. Reuse requires attribution under CC BY 4.0. | |
Triacetin Market Analysis by Mordor Intelligence
The Triacetin Market size is estimated at 162.28 kilotons in 2026 and is expected to reach 198.96 kilotons by 2031, at a CAGR of 4.16% during the forecast period (2026-2031). Strong demand for triacetin-plasticized cellulose-acetate filters in Asia, rising usage in nutraceutical soft-gel capsules, and emerging solvent roles in high-solid ink-jet inks are the principal growth engines. Process-intensification technologies, notably continuous reactive distillation, are compressing production costs and widening the adoption window for bio-based glycerin feedstocks. Meanwhile, tightening European Union purity rules and sporadic acetic-anhydride price spikes inject compliance and margin risk. Competitive strategies now revolve around vertical acetyl-chemical integration, sustainability-certified offerings, and long-term offtake deals with cigarette majors, while diversified opportunities in cosmetics and flexible packaging begin to offset a maturing tobacco segment.
Key Report Takeaways
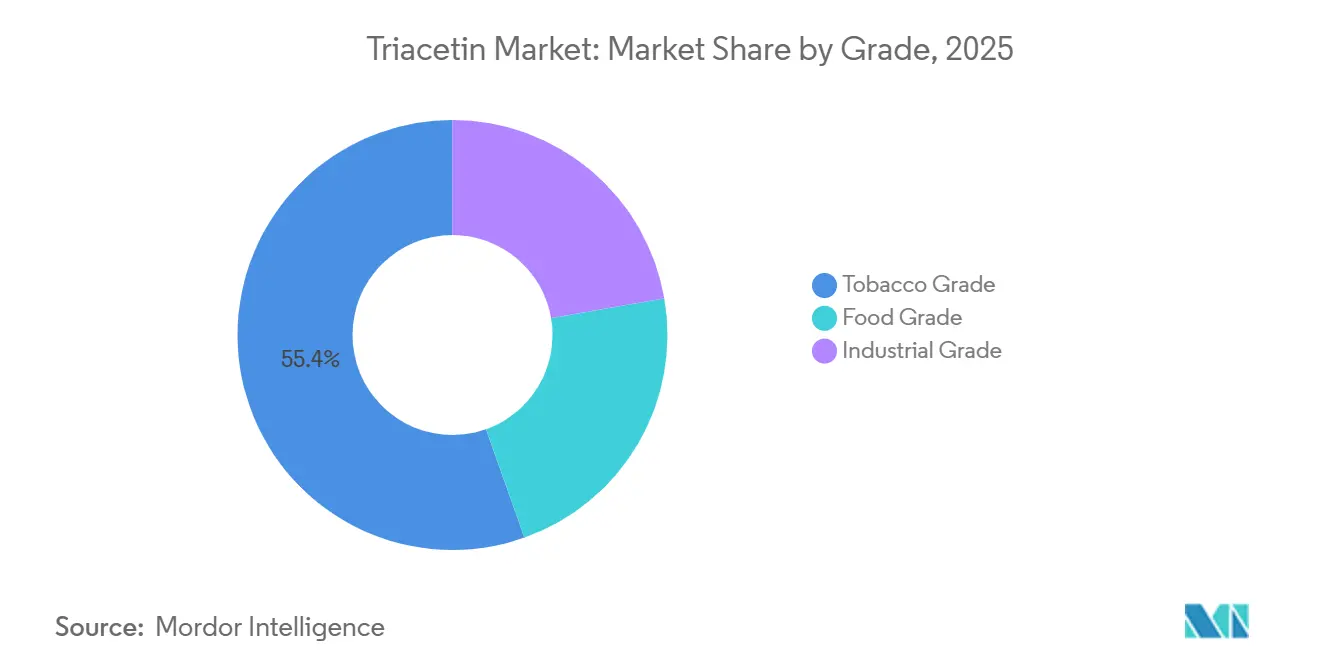
- By grade, tobacco grade led with 55.45% of 2025 volume; food grade is advancing at a 5.56% CAGR to 2031.
- By product type, plasticizers contributed 45.32% of 2025 demand, whereas solvents are forecast to grow at a 6.61% CAGR through 2031.
- By source, synthetic-glycerin routes supplied 60.65% of output in 2025, while vegetable-glycerin sourcing expanded at a 6.69% CAGR through 2031.
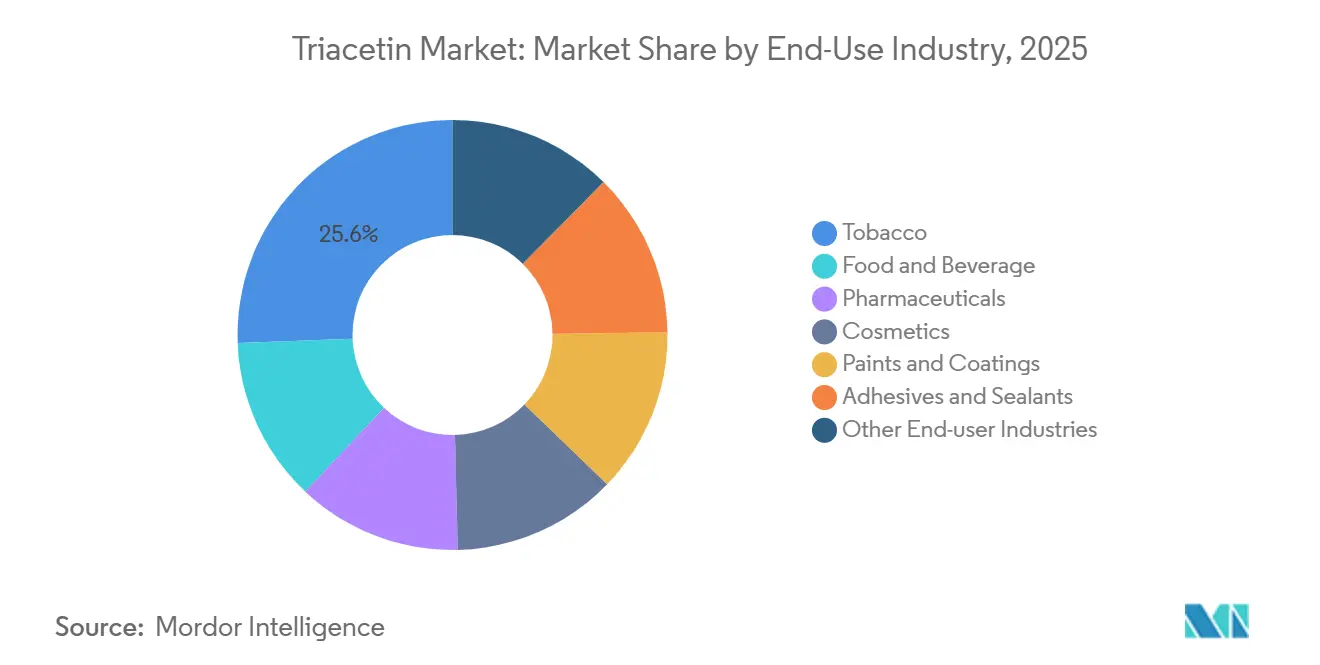
- By end-use industry, tobacco captured 25.59% of demand in 2025; cosmetics head the growth league at 6.18% CAGR to 2031.
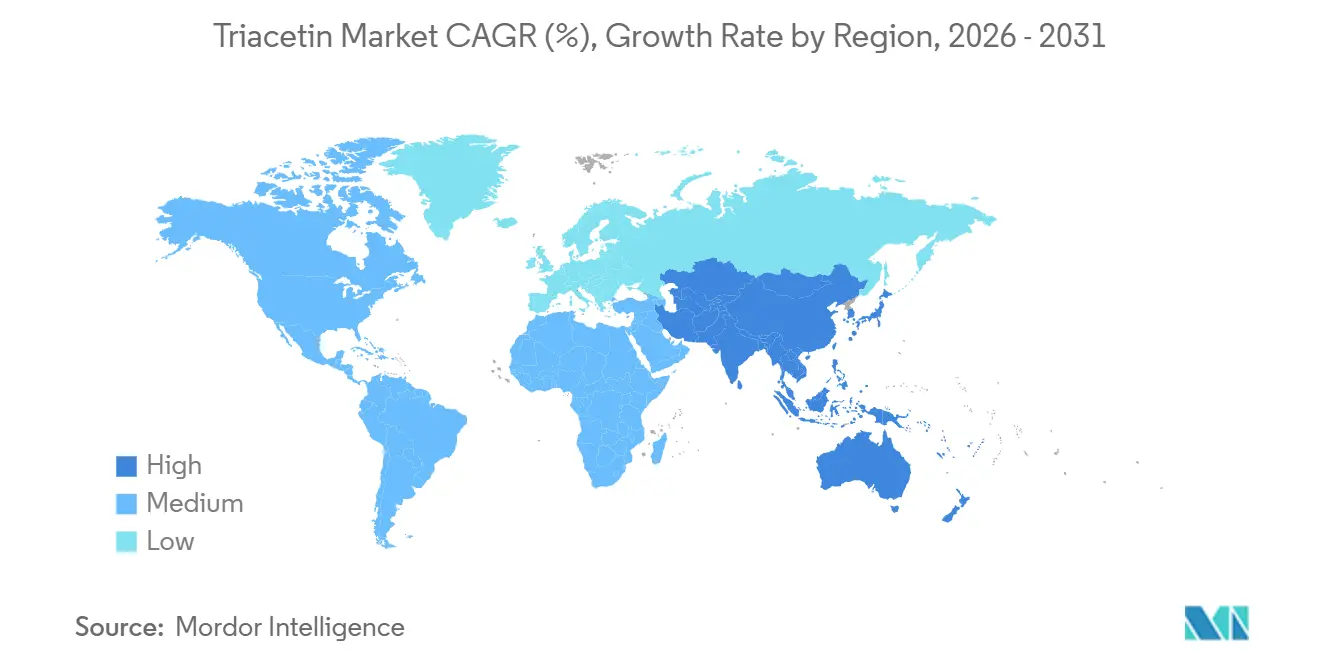
- By geography, Asia-Pacific commanded 55.71% of volume in 2025 and is set to post a 5.22% CAGR, the strongest regional pace.
Note: Market size and forecast figures in this report are generated using Mordor Intelligence’s proprietary estimation framework, updated with the latest available data and insights as of January 2026.
Global Triacetin Market Trends and Insights
Drivers Impact Analysis*
| Drivers | (~) % Impact on CAGR Forecast | Geographic Relevance | Impact Timeline |
|---|---|---|---|
| Growing implementation of triacetin-plasticized cellulose-acetate tow in Asian cigarette filters | +1.2% | China, India, Indonesia, Middle East | Medium term (2–4 years) |
| Surging demand for gel-caps in nutraceuticals | +0.9% | North America, Europe, global spillover | Long term (≥4 years) |
| Shift toward bio-based plasticizers under Europe’s paints and coatings regulations | +0.7% | Germany, France, United Kingdom, North America | Long term (≥4 years) |
| Emergence of triacetin as carrier solvent in high-solid ink-jet inks for flexible packaging | +0.5% | Asia-Pacific, North America | Medium term (2–4 years) |
| Adoption of continuous reactive-distillation units lowering production cost and carbon footprint | +0.6% | China, Europe, global early adopters | Short term (≤2 years) |
| Source: Mordor Intelligence | |||
Growing Implementation of Triacetin-Plasticized Cellulose-Acetate Tow in Asian Cigarette Filters
China’s filter-rod lines operating at 400–800 m/min require a stable plasticizer to control tow density at 1.28–1.32 g/cm³; triacetin delivers the needed migration profile, locking it into cigarette specifications. Daicel’s two-band patent quantifies typical triacetin dosing at 6–8 wt%, translating into repeat purchases with every rod formed. Eastman’s Fibers unit logged USD 1,318 million sales in 2024, 60% of which came from the ten largest cigarette manufacturers, underscoring volume certainty but also concentration risk[1]Eastman Chemical Company, “2024 Annual Report,” eastman.com. India and Indonesia continue to shift smokers toward filtered formats, lengthening rods to cut tar yields and pushing per-stick triacetin demand upward. Regulatory traceability requirements from the FDA and the EU’s Tobacco Products Directive elevate the barriers for low-cost suppliers, reinforcing incumbent dominance.
Surging Demand for Gel-Caps in Nutraceuticals
Soft-gel capsules rely on plasticizers to curb shell brittleness during high-speed encapsulation; triacetin’s dual hydrophilic and lipophilic miscibility tailors release profiles in both gelatin and carrageenan systems[2]PharmaCompass, “Triacetin – Excipient Profile,” pharmacompass.com. BASF’s Kollisolv GTA positions triacetin as a film-forming excipient compliant with Ph.Eur. and USP/NF monographs, lending regulatory confidence to contract manufacturers. Vegetarian soft-gel capacity additions in Bahrain and India intensify pharmaceutical-grade pull. FDA GRAS affirmation and the presence of multiple Type IV Drug Master Files bolster adoption in liability-sensitive nutraceuticals. Limited comparative data on polysaccharide shells present a research and development gap, yet early evidence favors triacetin’s hydrophilicity for carrageenan formulations.
Shift Toward Bio-Based Plasticizers Under Europe’s Paints and Coatings Regulations
REACH lists triacetin at 10,000–100,000 tons/year with 23 active registrants; the February 2025 high-purity amendment to Regulation (EU) 10/2011 tightens migration thresholds to 0.05 mg/kg, spurring demand for certified bio-routes. Eastman’s Triacetin Renew 59 uses mass-balance to deliver 59% recycled plus 41% bio-based content, satisfying brand sustainability scorecards. Academic work confirms triacetin’s effective plasticization of PVC up to 200 °C while avoiding phthalates, supporting uptake in wire and cable coatings. A Danish EPA survey pegged triacetin at EUR 1.50/kg in 2010, a 150% premium over DEHP; although no 2026 update is available, purity overheads likely keep a price delta in place. Incremental demand emerges from architectural paint formulators seeking non-phthalate solutions.
Emergence of Triacetin as Carrier Solvent in High-Solid Ink-Jet Inks for Flexible Packaging
Triacetin’s boiling point of 258 °C and viscosity of 21–24 mPa·s enable high-solid pigment loads while curbing VOC emissions during industrial printing runs. Eastman markets the molecule for “inks on plastics,” signaling acceptance across graphic-arts lines. Its refractive index of 1.4305 aids droplet precision in piezo heads, while a 138 °C flash point maintains plant safety margins. Flexible packaging converters in Asia are early adopters that value print-speed gains without solvent-recovery retrofits. Forthcoming REACH revisions could add testing costs, yet the solvent’s non-listed toxicity profile keeps it competitive against ketones and glycol ethers.
Restraints Impact Analysis*
| Restraints | (~) % Impact on CAGR Forecast | Geographic Relevance | Impact Timeline |
|---|---|---|---|
| Volatility in acetic-anhydride prices linked to methanol supply constraints | -0.5% | Global, acute in China coal-to-methanol clusters | Short term (≤2 years) |
| Regulatory scrutiny on plasticizers in Europe | -0.3% | Europe, North America spillover | Medium term (2–4 years) |
| Anti-smoking policies targeting single-use cellulose filters | -0.8% | EU, Australia, Canada, global echo | Long term (≥4 years) |
| Source: Mordor Intelligence | |||
Volatility in Acetic-Anhydride Prices Linked to Methanol Supply Constraints
Triacetin producers dependent on acetic anhydride endure feedstock swings tied to natural-gas and coal markets; a 2024 Renewable Energy simulation flagged route-2 economics (acetic anhydride) as uncompetitive under recent price decks. Eastman hedges 75% of raw-material exposure yet still devotes 45% of operations cost to feedstocks, illustrating systemic sensitivity. Coal-gasified methanol hubs in China amplify volatility during power rationing or safety inspections. Hedging and dual-feed strategies partially mitigate, but regional cost gaps persist.
Regulatory Scrutiny on Plasticizers in Europe
Regulation (EU) 2025/351 now forces documentation of non-intentionally added substances down to 0.05 mg/kg migration, raising analytical spend for every food-contact triacetin batch. REACH’s forthcoming overhaul could impose authorization barriers, adding lead times and risk premiums. UK e-liquid rules call for toxicological data in both heated and unheated states, and peer-reviewed aerosol tests linked triacetin to elevated acrolein levels at 3–6 wt%, fuelling precautionary bans in some vaping segments. Compliance budgets now form a competitive moat for incumbents with QC laboratories.
*Our forecasts treat driver/restraint impacts as directional, not additive. The impact forecasts reflect baseline growth, mix effects, and variable interactions.
Segment Analysis
By Grade: Tobacco Dominance Amid Food Acceleration
Tobacco grade anchored 55.45% of 2025 volume, benefiting from entrenched filter specifications in China’s 400-billion-stick output. The triacetin market size for tobacco grade is projected to inch forward at low single-digit rates, constrained by anti-smoking drives. By contrast, food grade is expanding at 5.56% CAGR, propelled by flavor-solvent roles in confectionery and dairy, where GRAS status eases formulation. Pricing power remains higher in food and pharma channels that demand USP/NF documentation and lot traceability. The shift underscores a gradual pivot toward regulated, high-purity niches that cushion volatility in tobacco volumes.
Legacy acetyl-chemical integration grants incumbents a cost edge in commodity tobacco streams, yet the compliance premium in food-grade widens gross margins despite lower tonnage. Suppliers with dual capabilities—Eastman, BASF, Polynt—can arbitrage between grades, redirecting output as filter demand moderates. Start-ups chasing food-grade must absorb high analytical overheads and build brand trust, elongating break-even timelines.



By Product Type: Solvent Gains as Plasticizer Matures
Plasticizers accounted for 45.32% of 2025 demand on the back of filter rods, soft-gel shells, and PVC blends. However, the solvent segment is forecast to grow 6.61% CAGR, outpacing plasticizers as flexible-packaging printers shift to high-solid inks and pharma formulators exploit dual miscibility. The triacetin market share for solvents is set to widen as VOC caps tighten in major print hubs.
Humectant roles in food and topical pharma hold niche but steady slices, while explosive and foundry uses retreat amid safety and environmental audits. Process-intensified capacity keeps supply agile, allowing producers to pivot volumes toward solvent buyers without major plant revamps. High-purity needs in inks intended for food wrappers weave regulatory synergy with food-grade requirements.
By Source: Vegetable Glycerin Gains on Sustainability Push
Synthetic glycerin still fed 60.65% of 2025 output thanks to predictable purity and global petrochemical supply chains. Yet vegetable-derived glycerin is charting a 6.69% CAGR, catalyzed by REACH purity demands and brand sustainability scorecards. The triacetin market size for vegetable routes is small but lucrative, leveraging ISCC plus mass-balance certifications such as Eastman’s Renew 59.
Biodiesel side-streams keep crude glycerol prices discounted, but upfront purification to pharma grade adds equipment and energy load. Reactive-distillation gains narrow that gap, enhancing the carbon narrative and supporting scope-3 emissions cuts for downstream users. Regional biofuel policy swings still dictate feedstock availability, urging multi-source procurement strategies.
By End-Use Industry: Cosmetics Outpaces as Tobacco Plateaus
Tobacco retained 25.59% of 2025 consumption, yet a flat outlook signals diminishing marginal utility from price hikes. Cosmetics is clocking 6.18% CAGR, with formulators abandoning phthalates in nail lacquers and fragrances, areas where triacetin offers biodegradability and film flexibility. The triacetin market size for cosmetics could surpass tobacco by value before 2031 if current price differentials persist.
Food and beverage leverage humectant and solvent roles, sustaining mid-single-digit growth underpinned by emerging-market confectionery demand. Pharmaceuticals absorb premium-priced volumes tied to soft-gel expansions and topical creams. Adhesives, sealants, and coatings remain price-sensitive adopters; bio-based certification could unlock future demand if cost gaps shrink.
Geography Analysis
Asia-Pacific commanded 55.71% of 2025 shipments, with China’s 35% share of global cigarette production anchoring basal demand. The triacetin market size in Asia-Pacific will expand at a 5.22% CAGR through 2031, buoyed by integrated acetate-tow supply chains and rising contract capsule output in India. Eastman supplies 100% acetate flake to its Chinese venture from Kingsport, illustrating trans-Pacific feedstock dependency.
North America contributes a significant share of Eastman’s fiber sales; vertical coal-to-acetyl integration ensures cost resilience, while mature smoking trends curb volume upside. Nevertheless, pharmaceutical-grade pull and bio-jet-fuel glycerol streams support modest growth. Europe, Middle East, and Africa face the most stringent plasticizer rules, forcing capacity upgrades or exit decisions among smaller players.
South America benefits from biodiesel-derived glycerin surpluses in Brazil and Argentina, offering feedstock leverage for local triacetin projects. The Middle East eye acetyl diversification in Saudi Arabia’s downstream push, though water scarcity and glycerol availability temper near-term scale. Overall, geographic diversification hedges policy and commodity risk, yet Asia remains the gravitational center.

Regulatory Landscape
Triacetin (glyceryl triacetate) sits within a mature, multi-end-use compliance stack. In the United States, it is affirmed as GRAS under 21 CFR 184.1901 for specified food-use functions (including flavoring agent, formulation aid, humectant, and solvent), which supports broad formulation access for food and nutraceutical applications. Internationally, JECFA assigns triacetin an ADI of "not specified" for its use as a flavoring agent, and compendial specifications commonly anchor to high assay thresholds (e.g., minimum assay around 98.5%), shaping QC practices for food and pharma grades.
In Europe, triacetin is addressed under the REACH framework (ECHA registration), and available dossier information indicates it does not meet the criteria for classification as hazardous under CLP (Regulation (EC) 1272/2008). Separately, the EU food-contact and plastics environment is tightening documentation and migration-limit expectations, with Regulation (EU) 2025/351 and the February 2025 amendment tightening migration thresholds in Regulation (EU) 10/2011 increasing batch-level analytical and traceability demands, particularly for triacetin used in food-contact and high-purity downstream chains.
Value Chain Analysis
The triacetin value chain starts with glycerin sourcing (synthetic glycerin streams and purified vegetable/crude glycerol from biodiesel) and acetylating agents (acetic acid or acetic anhydride), then moves through esterification to triacetin, separation, polishing, and grade-specific QC. Producers with upstream acetyl-chemicals integration and secure glycerin access typically have advantages on cost and reliability, while bio-based and mass-balance positioning depends on traceable vegetable-glycerin procurement and certification-ready chain-of-custody controls.
Manufacturing is increasingly shaped by process-intensification approaches, notably reactive distillation. Academic studies in 2025 associate this route with materially fewer unit operations, large potential capital-cost reduction versus conventional multi-step setups, and high conversion alongside high product purity. Downstream, triacetin moves via direct contracts and specialty distributors into tobacco (cellulose acetate tow plasticization), pharmaceuticals and nutraceuticals (soft-gel and excipient uses), food and beverage (carrier solvent and humectant roles), cosmetics, and industrial solvent applications for inks and coatings. Key bottlenecks cluster around feedstock price volatility (especially acetic anhydride), energy-intensive separation, and the analytical burden created by higher-purity and migration-limit compliance in regulated end uses.
Competitive Landscape
The triacetin market is moderately consolidated. Process innovation is the new battleground. Reactive-distillation license deals promise 70% cost savings, a threat to incumbents clinging to batch reactors. Eastman’s Triacetin Renew exemplifies sustainability branding, while Daicel defends tobacco niches with patented tow-band technologies. Indian CDMOs such as Mohini Organics exploit ISO and Kosher badges to carve pharma-grade export lanes. Potential entrants weigh purification capital against rising compliance hurdles. Feedstock control, particularly over bio-glycerin streams, and analytical-lab depth now delineate competitive moats. Strategic partnerships between biodiesel refiners and acetyl chemists could rewrite cost curves and regional power balances by 2030.
Triacetin Industry Leaders
Eastman Chemical Company
Daicel Corporation
LANXESS
Polynt S.p.A
BASF
- *Disclaimer: Major Players sorted in no particular order


Market Opportunities and Future Outlook
An opportunity is forming around high-purity and traceability-driven supply for food-contact, nutraceutical, and pharmaceutical channels. EU tightening of migration and purity documentation, including Regulation (EU) 2025/351 and the February 2025 change to Regulation (EU) 10/2011 with a 0.05 mg/kg migration threshold, increases the value of producers with validated analytical capability, REACH-anchored dossiers, and consistent assay control. This supports differentiation beyond commodity tobacco-grade volumes. At the same time, triacetin continues to support broad access in food applications through established acceptance markers, including US FDA GRAS (21 CFR 184.1901) and JECFA’s ADI of "not specified," which lowers formulation friction for flavor-carrier and humectant use cases.
On the supply side, the whitespace is focused on lowering cost and improving sustainability without sacrificing purity. 2025 peer-reviewed work on reactive distillation shows high conversion and high purity with fewer unit operations, alongside large estimated capex reductions versus conventional routes. Continuous production designs based on biodiesel-derived crude glycerol have also been validated at industrially relevant design scales, about 18,000 to 22,000 metric tons per year. Together, this combination supports new-build and retrofit business cases near biodiesel hubs, where discounted crude glycerol can be upgraded into regulated-grade triacetin when paired with adequate purification and QC. On the demand side, diversification away from a maturing tobacco base is supported by adoption in solvents for high-solid ink-jet inks in flexible packaging, and by non-phthalate positioning in cosmetics and coatings. In these areas, suppliers that can document food-contact compatible impurity profiles gain easier access to packaging-linked applications.
Recent Industry Developments
- February 2026: LANXESS highlighted its triacetin offering to the paints and coatings industry at Paint India 2026 in Mumbai (February 19-21, 2026). The emphasis on non-phthalate plasticizer and solvent use cases supports broader penetration beyond tobacco-grade demand and signals continued supplier focus on regulated, formulation-driven end markets.
- January 2025: Eastman announced an off-list price increase of USD 0.10/lb for its triacetin product line in North America and Latin America, effective January 1, 2025. The move reflected raw-material and energy cost pressures and highlighted the role of pricing actions and offtake relationships in protecting margins in a feedstock-volatile acetyl-chemicals chain.
- October 2024: BASF PETRONAS Chemicals doubled 2-ethylhexanoic acid capacity to 60,000 tons per year at its Kuantan site. While not a triacetin capacity change, the investment strengthened Southeast Asian acetyl-related value chains and improved regional availability of adjacent specialty intermediates used by coatings and plasticizer ecosystems that overlap with triacetin demand centers.


Research Methodology Framework and Report Scope
Market Definition and Coverage
For this study, the triacetin market is defined as revenue generated from sales of triacetin (glyceryl triacetate) supplied to end users as a functional ingredient, mainly for plasticizing, solvency, and humectancy needs across industrial and consumer-linked manufacturing.
Scope exclusions: We exclude finished formulations where triacetin is only a minor component, such as ready-to-use blends and compounded products.
Segmentation Overview
- By Grade
- Tobacco Grade
- Food Grade
- Industrial Grade
- By Product Type
- Plasticizer
- Solvent
- Humectant
- Other Product Types
- By Source
- Vegetable-Glycerin-Based
- Synthetic-Glycerin-Based
- By End-Use Industry
- Tobacco
- Food and Beverage
- Pharmaceuticals
- Cosmetics
- Paints and Coatings
- Adhesives and Sealants
- Other End-user Industries
- By Geography
- Asia-Pacific
- China
- India
- Japan
- South Korea
- Rest of Asia-Pacific
- North America
- United States
- Canada
- Mexico
- Europe
- Germany
- United Kingdom
- Italy
- France
- Rest of Europe
- South America
- Brazil
- Argentina
- Rest of South America
- Middle East and Africa
- Saudi Arabia
- South Africa
- Rest of Middle East and Africa
- Asia-Pacific
Data Sources, Market Sizing, and Validation
Desk Research
Desk research was used to set the fact base for supply, demand signals, and trade direction before the model was built. We relied on public sources such as UN Comtrade trade statistics, USITC import and export data, Eurostat chemical trade series, the US EPA chemical substance information, and publicly available standards and guidance from bodies such as ISO when quality and testing references were needed.
To ground assumptions in real market positioning, we also reviewed company annual reports and investor decks for capacity mentions, product descriptions, and end-use exposure. We then checked association websites and credible press for regulatory and usage updates across tobacco, food, and pharma related channels. Patent databases were used to gauge application momentum and track substitution discussion in plasticizers and solvents. The source list here is illustrative only, and additional public references were also reviewed for data collection, validation, and research clarification.
Primary Interviews and Surveys
Primary work focused on confirming how triacetin is purchased and sold by grade and end use, and how pricing moves with feedstock costs and compliance requirements. We spoke with producers, distributors, and downstream users, then tested key assumptions with domain experts across APAC, EMEA, and the Americas to keep the regional demand split grounded.
Distribution of primary research fieldwork respondents
| Company type | Respondent position | Region |
|---|---|---|
| Top tier: 27% | CXOs: 14% | APAC: 45% |
| Mid tier: 59% | Functional/Unit leaders: 31% | EMEA: 37% |
| Smaller Players: 14% | Managers: 55% | Americas: 18% |
Market-Sizing & Forecasting
Sizing started from a top-down build where production, trade flows, and apparent consumption signals were used to reconstruct the addressable triacetin pool by region, then converted into value using observed price bands. The totals were stress-tested using selective bottom-up approximations, including supplier revenue splits, channel checks on typical contract sizes, and an ASP times volume view for major end uses, so that outliers could be corrected.
Key model inputs included proxy indicators like cigarette and filter tow demand direction, since triacetin is used as a plasticizer in that chain. We also used pharma and nutraceutical output trends that influence excipient usage, food additive demand cues, and changes in chemical feedstock pricing that affect triacetin realizations. We tracked the mix between industrial and higher purity uses because it shifts the average price level. Forecasting relied on scenario analysis supported by a simple multivariate regression, where demand growth was linked to end-use output indicators and moderated using expert checks on substitution risk and regulatory tightness. When a country-level volume split could not be built cleanly from public data, the gap was handled using trade shares and validated interview ranges before the results were rolled up.
Data Validation & Update Cycle
Outputs were validated through triangulation across independent signals, including trade-derived volume direction, announced capacity changes, and price movement logic, before final numbers were set. Any large variance between the model and an external indicator triggered a step-back review, followed by a re-check of conversion factors, currency timing, and regional allocation.
A multi-step internal review was completed before sign-off so assumptions stayed consistent across chapters and exhibits. The report is refreshed on an annual cycle, and interim updates are made when material events occur, such as major supply additions, policy changes, or sharp feedstock shocks. Before delivery, an analyst performs a fresh pass so the final view reflects the latest available information.
Mordor Intelligence's Triacetin Market Estimate Compared With Other Published Estimates
Published triacetin market values can look far apart even when they refer to the same chemical, because each publisher makes different choices on what to count and how to convert volumes into revenue. The differences often come from scope creep into downstream mixtures, grade-specific price assumptions, and the year and currency timing used to convert regional sales into USD.
Some estimates expand the market to include finished formulations and blended products where triacetin is only one input. In Mordor Intelligence, only neat triacetin sales are counted, and downstream blending and packaged formulation markups are kept out, so the total remains tied to chemical demand and trade volume checks.
Benchmark comparison
| Source | Market Size | Gaps in Research Methodology |
|---|---|---|
| Mordor Intelligence | USD 363.10 M (2024) | |
| Global Consultancy A | USD 327.43 M (2024) | Uses a broader application list and applies uniform growth and pricing logic across end uses, with limited evidence of trade and volume cross-checks by region. |
| Industry Publisher B | USD 308.84 M (2025) | Base year differs and the value build relies more on stated market value and CAGR projection, with less clarity on grade mix, regional price dispersion, and currency conversion timing. |
The table shows that much of the spread can be explained by what is included in the revenue pool and how price levels are carried forward by grade and region. By keeping the sizing traceable to volume signals, end-use output cues, and realistic price bands that are re-tested in interviews, our estimate is easier to reproduce and adjust when a key assumption changes.


Key Questions Answered in the Report
What volume is the triacetin market projected to reach by 2031?
The triacetin market is forecast to hit 198.96 kilotons by 2031, reflecting a 4.16% CAGR across the period.
Which region will add the most incremental triacetin demand through 2031?
Asia-Pacific is expected to register the strongest absolute increase, powered by cigarette filter production and expanding pharmaceutical capacity.
How fast is food-grade triacetin growing relative to tobacco grade?
Food grade is advancing at 5.56% CAGR, outpacing the mature tobacco grade that presently dominates volume.
What technological shift could lower triacetin production costs?
Continuous reactive-distillation technology can trim specific production costs by about 70%, as validated in a 2025 Scientific Reports study.
Which end-use segment is emerging as the fastest growth avenue?
Cosmetics, particularly nail lacquers and fragrances, is expanding at 6.18% CAGR due to the move toward non-phthalate, biodegradable plasticizers.
How stringent are new EU rules on triacetin purity?
Regulation (EU) 2025/351 enforces “high degree of purity” and migration limits of 0.05 mg/kg, compelling exhaustive analytical documentation for each batch.
Page last updated on:


 Your data is secure and never sold or shared.


