
Market Overview
| Study Period | 2021 - 2031 |
|---|---|
| Market Size (2026) | USD 5.10 Billion |
| Market Size (2031) | USD 7.06 Billion |
| Growth Rate (2026 - 2031) | 6.72 % |
| Fastest Growing Market | Asia Pacific |
| Largest Market | Asia Pacific |
| Market Concentration | Low |
Major Players *Disclaimer: Major Players sorted in no particular order Image © Mordor Intelligence. Reuse requires attribution under CC BY 4.0. | |
Surface Treatment Chemicals Market Analysis by Mordor Intelligence
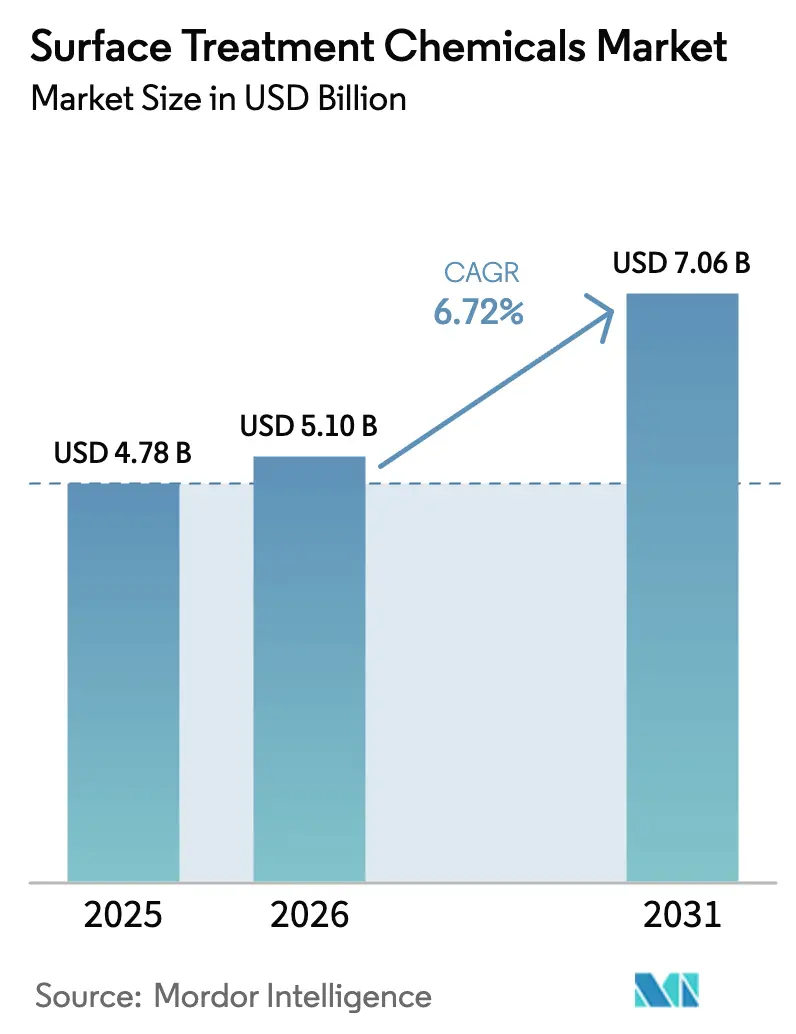
The Surface Treatment Chemicals Market size was valued at USD 4.78 billion in 2025 and is estimated to grow from USD 5.10 billion in 2026 to reach USD 7.06 billion by 2031, at a CAGR of 6.72% during the forecast period (2026-2031). Demand for specialized chemistries is surging, driven by a rise in multi-metal pretreatment lines for electric-vehicle (EV) body-in-white, wafer-level electroplating for advanced semiconductor packaging, and stricter corrosion-control regulations in offshore wind towers. In China, the United States, and Europe, aluminum-intensive EV platforms are transitioning from iron-phosphate baths to zirconium and titanium conversion coatings. These new coatings, effective at ambient temperatures, reduce sludge volumes significantly and ensure strong adhesion on steel-aluminum joints. Additionally, as electronics continue to miniaturize, there's a heightened demand for ultra-pure additives in copper-pillar and through-silicon via (TSV) plating. These additives must be free of PFAS surfactants, especially with a European phase-out looming in 2027. The surface treatment chemicals market is also reaping benefits from on-site additive-manufacturing cells in aerospace and medical sectors. Here, processes like post-print pickling, electropolishing, and passivation are crucial for eliminating stress risers and surface oxides formed during laser fusion.
Key Report Takeaways
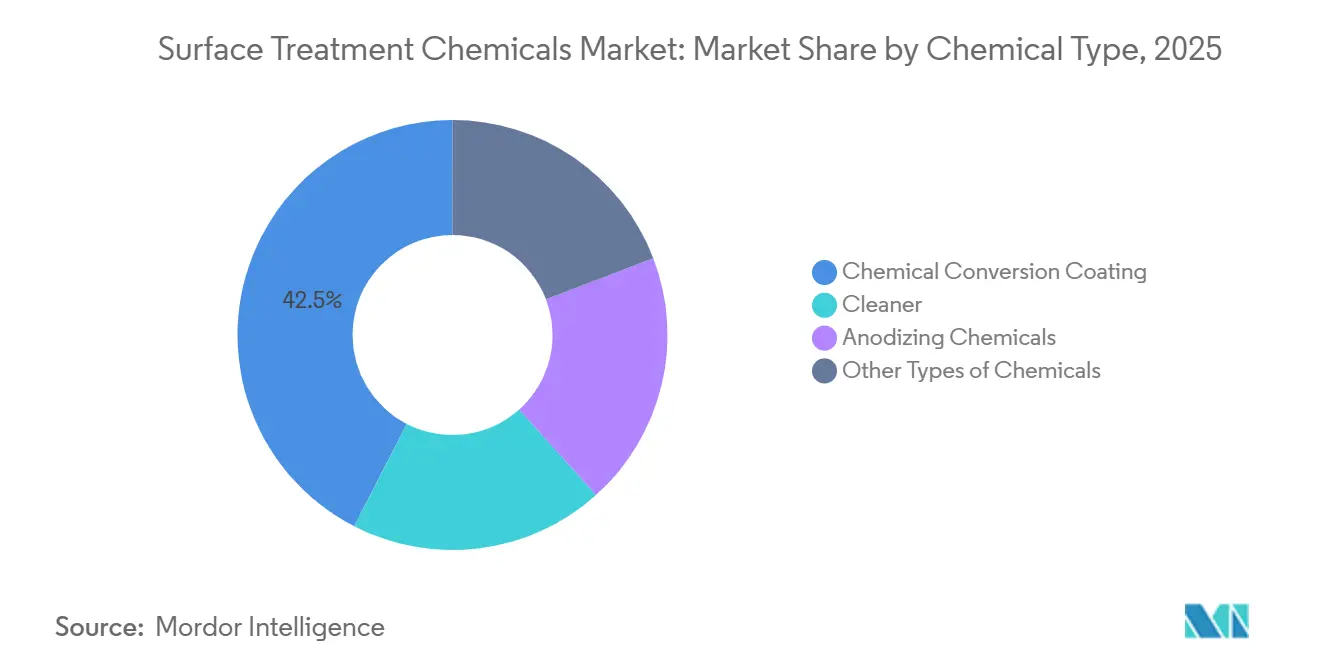
- By chemical type, conversion coatings led with 42.45% of surface treatment chemicals market share in 2025, while the cleaners segment is expanding at a 7.12% CAGR through 2031.
- By base material, metal substrates accounted for 60.12% of the surface treatment chemicals market size in 2025; plastic treatments are advancing at a 7.11% CAGR.
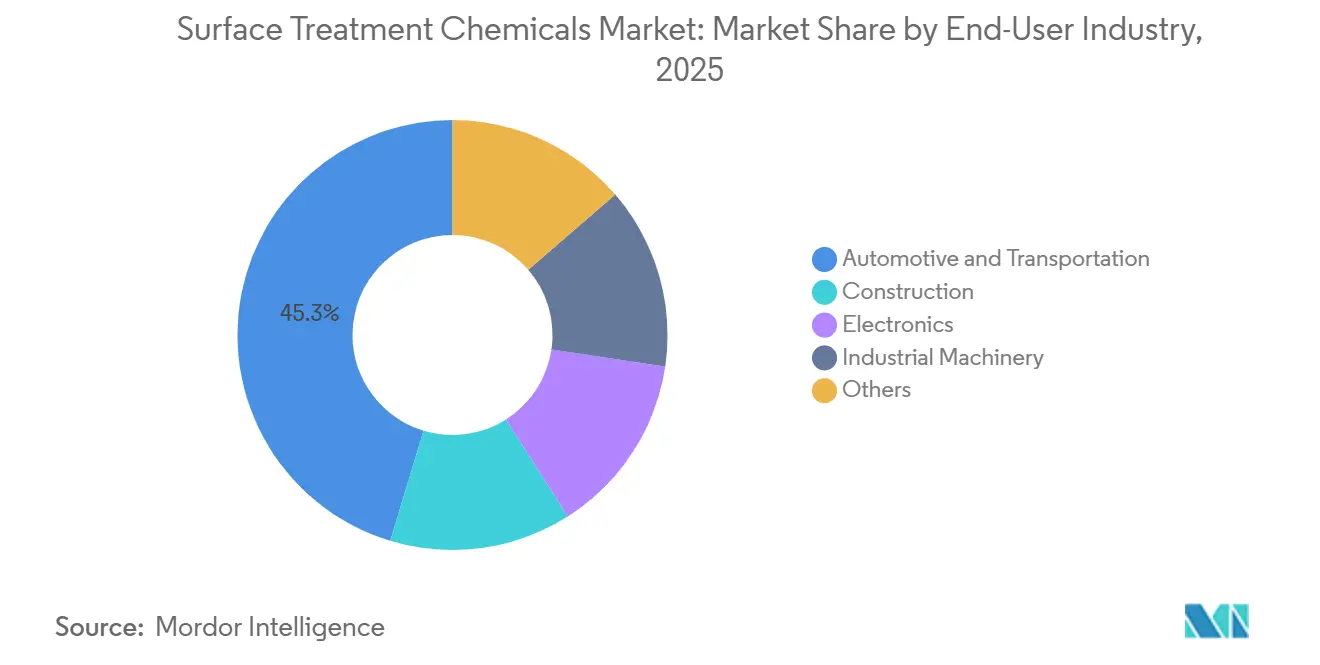
- By end-user industry, automotive and transportation captured 45.34% revenue in 2025 and is growing at a 7.12% CAGR to 2031.
- By geography, Asia-Pacific commanded 42.95% of the surface treatment chemicals market share in 2025 and is projected to expand at a 7.05% CAGR through 2031.
Note: Market size and forecast figures in this report are generated using Mordor Intelligence’s proprietary estimation framework, updated with the latest available data and insights as of 2026.
Market Trends and Insights
Drivers Impact Analysis of Surface Treatment Chemicals Market*
| Drivers | (~) % Impact on CAGR Forecast | Geographic Relevance | Impact Timeline |
|---|---|---|---|
| Rapid expansion of automotive production in Asia | +1.8% | APAC core (China, India, ASEAN), spill-over to MEA | Medium term (2-4 years) |
| Electronics miniaturization demanding high-precision plating | +1.5% | Global, concentrated in APAC (Taiwan, South Korea, China) and select North America sites | Short term (≤ 2 years) |
| Stringent anti-corrosion standards in wind-turbine towers | +0.9% | North America, Europe (offshore wind), APAC coastal provinces | Long term (≥ 4 years) |
| On-site 3D-printed metal parts requiring post-print surface prep | +0.7% | North America, Europe (aerospace, medical devices), early APAC adoption | Medium term (2-4 years) |
| Surge in aluminum use in EV platforms necessitating multi-metal cleaners | +1.4% | APAC (China, South Korea), North America, Europe | Short term (≤ 2 years) |
| Source: Mordor Intelligence | |||
Rapid Expansion of Automotive Production in Asia
In 2024, China rolled out vehicles, with many being new-energy units. This surge in production has led pretreatment lines to swiftly alternate between steel and aluminum bodies. Meanwhile, India's FAME initiative aims for significant annual EV sales by 2030. This ambition necessitates an increase in conversion-coating capacity for battery trays and motor housings. In 2024, ASEAN attracted fresh investments for automotive and electronics plants, heightening the demand for localized chemical supplies. As the industry pivots towards multi-material body structures, there's a notable shift to zirconium coatings, which offer comparable corrosion protection without the downsides of phosphate sludge. Suppliers collaborating with regional OEM labs to co-develop chemistries are securing a coveted preferred-vendor status.
Electronics Miniaturization Demanding High-Precision Plating
In 2024, TSMC's advanced packaging revenue grew, fueled by the demand for copper TSV and micro-bump plating, both requiring sub-10 nm uniformity. Meanwhile, Samsung's 3D integration strategy is anchored on using nickel-gold and copper-tin alloys, a move aimed at preventing voids in high-current lines. With the plated surface area per wafer having significantly increased, there's a corresponding surge in demand for suppressors, levelers, and brighteners. However, looming EU PFAS restrictions on common surfactants are pushing for additive reformulations ahead of the 2027 deadline. As a result, foundries are on the lookout for suppliers boasting proven PFAS-free systems and inline bath analytics to monitor organic breakdown.
Stringent Anti-Corrosion Standards in Wind-Turbine Towers
IEC 61400 designates offshore turbine towers with a C5-M corrosivity rating, mandating multi-layer coatings post near-white blasting[1]. In 2024, a three-coat zinc-rich epoxy system was implemented on offshore towers. Blade-edge erosion resistance is being enhanced by first using solvent-based cleaning, then plasma activation to boost polyurethane adhesion. With the U.S. targeting offshore wind by 2030, this translates to an estimated number of towers, each requiring surface-treatment chemicals over its lifespan. To streamline operations, suppliers are establishing service centers directly at fabrication yards, reducing logistics lead times.
On-Site 3D-Printed Metal Parts Requiring Post-Print Surface Prep
To meet the stringent requirements for fatigue-critical aerospace components, the surface roughness produced by laser powder-bed fusion must be refined to a smoother level. GE Additive enhances the fatigue life of its LEAP nozzles through a two-step process: acid pickling followed by electropolishing. Boeing, adhering to MIL-A-8625 Type III standards, anodizes its 3D-printed titanium brackets, achieving an oxide thickness within the required range. This process necessitates meticulous control over sulfuric acid and current density. After sintering, Desktop Metal's binder-jet steel components undergo chemical descaling to eliminate surface oxides. Furthermore, medical implants incorporate ASTM F86 nitric-acid passivation, broadening the scope of addressable chemical treatments.
Restraints Impact Analysis of Surface Treatment Chemicals Market*
| Restraints | (~) % Impact on CAGR Forecast | Geographic Relevance | Impact Timeline |
|---|---|---|---|
| Regulatory clamp-down on hexavalent chromium | -1.2% | Europe (REACH Authorization), North America (EPA, California Prop 65), China (RoHS) | Short term (≤ 2 years) |
| Shift toward bio-based coatings reduces legacy chemical demand | -0.8% | Europe, North America (architectural, appliance segments) | Medium term (2-4 years) |
| Rising total-cost-of-ownership of captive metal finishing lines | -0.6% | North America, Europe (environmental compliance, labor costs) | Long term (≥ 4 years) |
| Source: Mordor Intelligence | |||
Regulatory Clamp-Down on Hexavalent Chromium
With sunset windows closing in 2026, the EU REACH has flagged 12 hexavalent chromium salts. This move compels players in aerospace, defense, and heavy equipment to requalify alternatives that align with ASTM B117 cycles, a task stretching over 18-24 months[2]. Meanwhile, the U.S. EPA is set to designate specific Cr(VI) compounds as hazardous air pollutants. This classification mandates continuous monitoring, a process that could drain significant resources for each site. In California, under Proposition 65, consumer-warning labels are now a requirement, leading appliance manufacturers to shift their plating processes overseas. While trivalent chromium falls short on abrasion resistance, zirconium systems, reliant on silane coupling agents for high-copper aluminum, underscore the enduring demand for hexavalent processes in specialized applications.
Shift Toward Bio-Based Coatings Reduces Legacy Chemical Demand
In 2024, the global sustainable-coatings segment experienced growth, driven by the EU's VOC-reduction mandates and the U.S.'s Safer Choice labeling initiatives. Sherwin-Williams has introduced soy-polyol interior paints that eliminate the need for phosphate pretreatments on residential steel doors. In a significant move towards sustainability, IKEA has managed to powder-coat most of its metal furniture directly after mechanical cleaning, achieving a remarkable reduction in water usage. Despite their promise, bio-resins face challenges: they cannot withstand thermal conditions exceeding 150 °C, limiting their adoption in automotive under-hood applications.
*Our forecasts treat driver/restraint impacts as directional, not additive. The impact forecasts reflect baseline growth, mix effects, and variable interactions.
Surface Treatment Chemicals Market Segment Analysis
By Chemical Type:
Conversion Coatings Lead, Cleaners AccelerateConversion coatings captured 42.45% of the surface treatment chemicals market share in 2025 as they remain the principal adhesion promoter for automotive and appliance lines. Cleaners are projected to deliver a 7.12% CAGR to 2031, reflecting recycled-aluminum feedstocks that arrive coated with legacy lubricants. Acidic cleaners gain traction in electronics because high alkalinity can undercut copper traces. The surface treatment chemicals market size for anodizing chemicals remains modest yet resilient, supported by architectural cladding and smartphone housings that demand Type II colorable oxides.
Zirconium formulations are replacing iron-phosphate baths on EV assembly lines, lowering rinse temperatures and sludge. BASF’s Gardobond and Chemetall’s Oxsilan series run at room temperature and cut wastewater. Cleaner demand rides the circular-economy trend; Tesla’s 4680 recycled-aluminum cans pass through three cleaning stages before anodizing, underscoring volume upside. Hard-anodized architectural panels, such as the Louvre Abu Dhabi’s dyed bronze cladding, illustrate how premium design keeps anodizing chemicals in high-margin niches.

By Base Material:
Metal Substrates Dominate, Plastics Gain GroundMetal substrates delivered 60.12% of revenue in 2025, anchored in automotive chassis and wind-tower steel that cannot tolerate corrosion failure. Plastic treatments are advancing at a 7.11% CAGR to 2031, lifted by conductive primers on polycarbonate instrument clusters and smartphone frames. While steel and aluminum dominate, making up the majority of the automotive body-in-white mass, the increasing share of aluminum is prompting a shift towards mixed-metal pretreatment conversions.
The surge in plastics is largely attributed to plasma activation techniques. These methods elevate surface energy from a lower range to a higher range, paving the way for enhanced metallization and paint adhesion. A testament to this trend, Apple's iPhone 15 Pro features polycarbonate structural components. These parts undergo atmospheric-plasma cleaning, a crucial step before they receive thermal-management coatings, underscoring the electronics industry's influence. Similarly, BMW's carbon-fiber roofs are treated with plasma and primer processes before being affixed to aluminum frames, highlighting a notable convergence across sectors.
By End-User Industry:
Automotive Leads, Electronics SurgesAutomotive and transportation consumed 45.34% of the surface treatment chemicals market size in 2025, and is tracking a 7.12% CAGR, driven by battery-tray isolation layers and sensor housings that must resist road salt for 10 years. Electronics, on the other hand, is emerging as the fastest-growing sector. Innovations like copper-pillar plating and PCB via-fill are amplifying the chemical load per wafer by several times. Meanwhile, the construction sector commands a considerable market share, buoyed by powder-coated aluminum curtain walls that meet low-VOC standards under LEED v4.1.
Electric vehicles (EVs) utilize more chemicals compared to internal combustion engine (ICE) models, underscoring the automotive sector's volume intensity. Intel's Foveros stacked dies necessitate sub-5 µm pitch copper pillars, which depend on plating baths free of defects, measured in parts per billion. As green-building codes become more stringent, construction demand is expected to stabilize, particularly for powder and water-borne primers that require minimal liquid pretreatment. While the slower capital expenditure cycle in industrial machinery moderates its demand for chemicals, the introduction of electric powertrains in excavators and tractors is driving the need for new aluminum housings with corrosion-proof coatings.
Geography Analysis
APAC Surface Treatment Chemicals Market
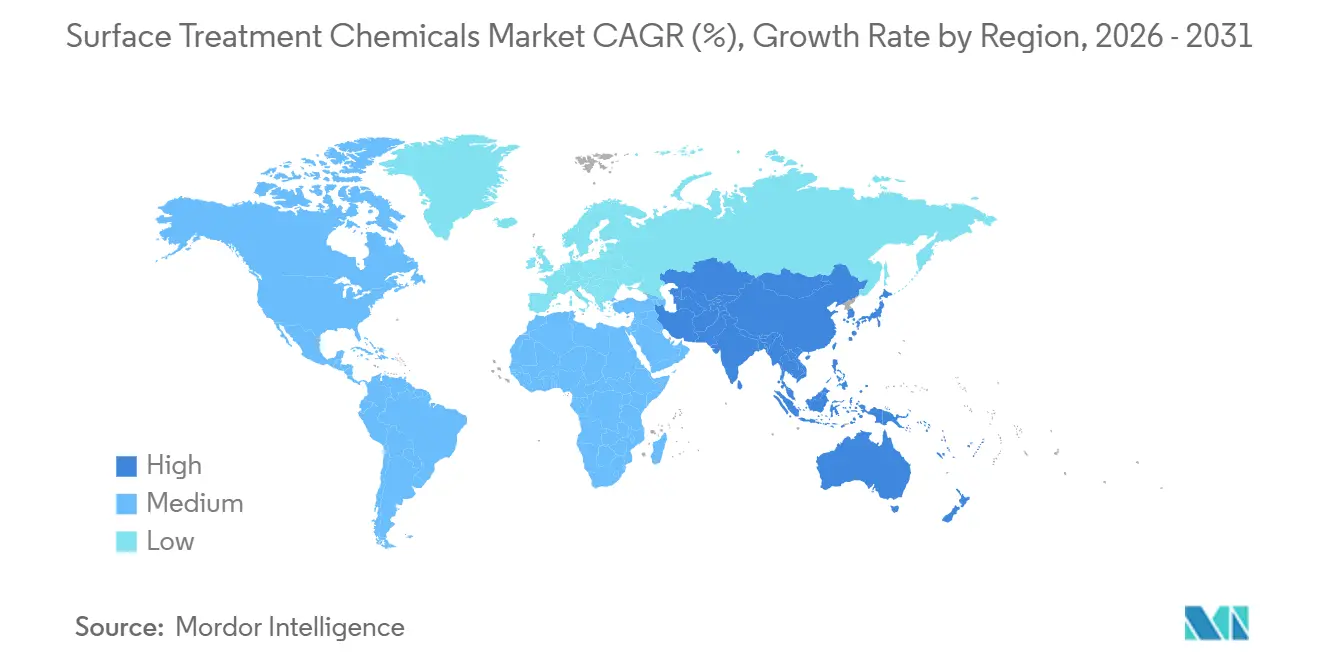
Asia-Pacific accounted for 42.95% of the 2025 surface treatment chemicals market share and is growing at 7.05% through 2031. China's burgeoning demand for conversion coatings is driven by its new-energy vehicles, while India's ambitious semiconductor initiative is fueling the need for additional electroplating lines. In 2024, ASEAN's allure for auto and electronics plants solidified its status as a hub for localized supply clusters. Meanwhile, Japan and South Korea, while contributing high-purity niche volumes for semiconductor materials, face limitations on absolute growth due to their already mature automotive outputs. Early 2025 witnessed regional shortages of zirconium precursors, leading to stretched lead times and prompting OEMs to adopt a dual-sourcing strategy.
North America Surface Treatment Chemicals Market
North America commands a significant revenue share. The region's commitment to electric vehicles (EVs) is underscored by the Inflation Reduction Act, which catalyzed a substantial investment in EV and battery plants. This surge has led to the establishment of new pretreatment lines across states like Michigan, Ohio, Tennessee, and Georgia. In 2024, Mexico's automotive prowess was evident as it rolled out vehicles, bolstered by the presence of Tesla in Monterey and BMW in San Luis Potosí. This automotive boom has subsequently driven sales in cleaner and electro-coating solutions. However, California's draft Rule 1469 poses challenges, potentially compelling a portion of job shops to pivot to trivalent chromium or cease operations altogether. While this may dampen near-term volumes, it could benefit suppliers who align with the new regulations. Additionally, labor shortages are further constraining capacity utilization.
EMEA and South America Surface Treatment Chemicals Market
Europe accounted for a notable share of the spending in 2025. The UK's offshore wind initiatives have surpassed significant milestones, with ambitious projects in the pipeline. This expansion necessitates the use of C5-M coating systems at the Humberside yards. Despite facing energy-price challenges, Germany successfully assembled vehicles, with a commendable share being battery electric vehicles (BEVs). France's Airbus is ramping up its A320neo output, but supply chain snags are hindering the corresponding chemical demand. Southern Europe is carving out a niche, benefiting from treatments for solar-panel glass. Meanwhile, both South America and the Middle-East Africa regions contribute to the market, with Brazil's production of vehicles and downstream projects in Saudi Arabia leading the charge.
Regulatory Landscape
Regulatory pressure is increasingly focused on restricting high-concern substances used across pretreatment, plating, and functional coatings. That shift is driving faster reformulation cycles and larger requalification workloads for end users. In Europe, the European Chemicals Agency (ECHA) continues to advance a broad, class-based PFAS restriction under REACH (EC) No 1907/2006, with the SEAC draft-opinion public consultation closing on May 25, 2026. This direction strengthens supplier and OEM demand for PFAS-free additives and coatings, particularly where surfactants and repellency chemistries have been common in surface finishing.
Compliance for metal finishing operations also remains tied to chromium and wastewater requirements. The EU REACH authorization pathway for hexavalent chromium continues to compress availability windows, pushing aerospace, defense, and heavy-equipment finishers to qualify alternatives while maintaining performance requirements, including salt-spray durability. Separately, the revised EU Water Framework Directive trajectory (provisional 2025 agreement referenced in regulatory updates) tightens PFAS thresholds in surface and groundwater over time, increasing pressure to reduce persistent substances and improve rinse-water management across finishing lines.
Value Chain Analysis
The value chain covers upstream production of acids, alkalis, metal salts, surfactants and additives, and specialty resins. It then moves into formulation into cleaners, conversion coatings, anodizing chemistries, and functional topcoats. Midstream value is created through application engineering and qualification support at OEMs and tier suppliers, where bath stability, contamination control, and multi-metal compatibility determine switching costs. Suppliers also differentiate by bundling chemistry with process know-how for high-throughput automotive pretreatment lines, electronics plating, and corrosion-control systems used in wind-tower fabrication.
At the downstream end, chemical systems are sold directly to large OEM sites, and also through distributors and job shops running captive or contract finishing lines. Technical service, bath analytics, and waste minimization are taking on more weight in these sales models. Industry engagement at technical forums and trade events, including SUR/FIN 2026 in the United States and China DieCasting 2026, supports commercialization of newer chromium-free, nickel-free, and phosphate-free processes, with suppliers using application demonstrations and line trials to accelerate adoption.
Competitive Landscape
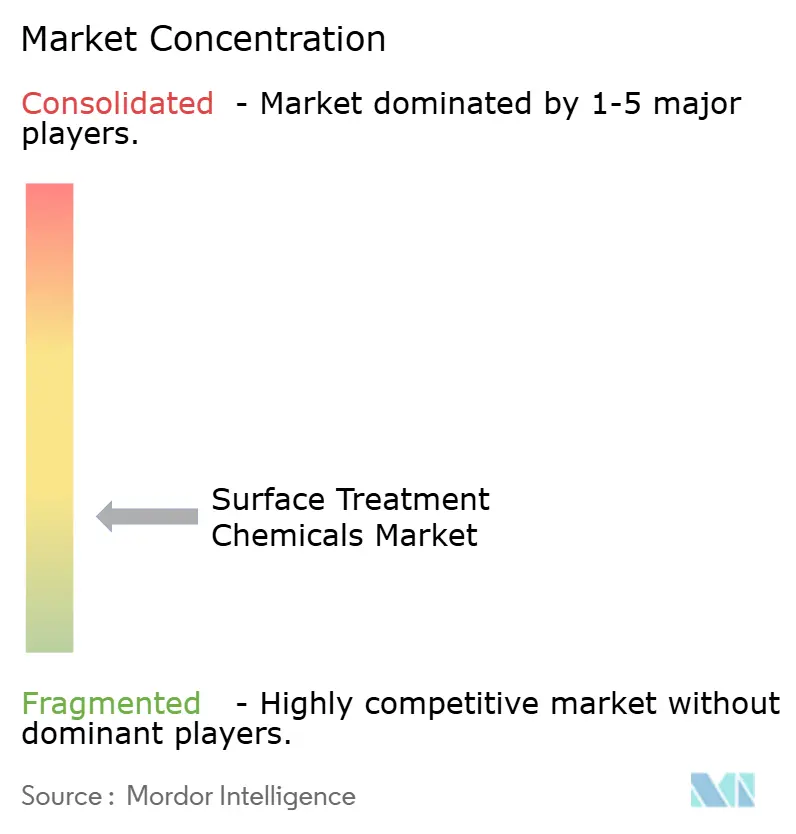
The surface treatment chemicals market is fragmented. Environmental credentials matter; ISO 14001 certification and closed-loop take-back programs often decide OEM vendor lists. White-space opportunities include on-site electrochemical regeneration that recycles spent cleaners, bio-based adhesion promoters tuned for low-stress applications, and AI-driven bath control that predicts contaminant spikes before yield loss. Suppliers able to bundle chemistry, analytics, and waste services into subscription models may lock in multi-year contracts as OEMs outsource non-core finishing steps to cut environmental liability.
Surface Treatment Chemicals Industry Leaders
-
Henkel AG and Co. KGaA
-
BASF
-
MKS | Atotech
-
PPG Industries, Inc.
-
Element Solutions Inc
- *Disclaimer: Major Players sorted in no particular order
Surface Treatment Chemicals Market Companies Covered in this Report
- Aalberts Surface Technologies GmbH
- ALANOD GmbH and Co. KG
- Asterion LLC
- BASF
- Bulk Chemicals Inc.
- ChemTech Surface Finishing Pvt. Ltd.
- Dow
- Element Solutions Inc
- Henkel AG and Co. KGaA
- MKS | Atotech
- Nihon Parkerizing Co., Ltd.
- Nippon Paint Holdings Co. Ltd.
- OC Oerlikon Management AG
- PPG Industries, Inc.
- Quaker Chemical Corporation
- The Sherwin-Williams Company
- YUKEN INDUSTRY CO.,LTD.
Market Opportunities and Future Outlook
PFAS-free surface-treatment and functional-coating systems are a clear whitespace as REACH-driven restriction work advances in Europe and downstream brands tighten material declarations. Henkel's April 2026 launch of Loctite anti-fingerprint coatings (AF 8810 and AF 8812) for automotive displays is one concrete example, with formulations designed without PFAS or fluorine ingredients to meet compliance and OEM interior-surface durability needs. Demand for PFAS-free reformulations also extends to plating additives and wet-process aids, where PFAS chemistries have historically been used for wetting and defect control.
Process intensification is strongest in chemistries that reduce energy, water, and sludge in multi-metal lines supporting EV platforms and lightweighting. Nickel-free, lower-temperature anodizing and sealing steps offer a measurable route to cut utilities and simplify EHS management. Henkel's April 2026 introduction of Bonderite M-ED 11204 targets mid-temperature sealing for aluminum anodizing, and the broader market continues shifting from phosphate-heavy pretreatments toward zirconium and titanium conversion systems in automotive. In electronics and power infrastructure, suppliers highlighting solutions for power distribution and advanced manufacturing, including Atotech programs referenced around SUR/FIN 2026, point to demand for higher-purity and more controllable surface-finishing chemistries that can be integrated with digital bath monitoring and service models.
Recent Industry Developments in Surface Treatment Chemicals Market
- April 2026: Henkel AG & Co. KGaA launched Bonderite M-ED 11204, nickel-free mid-temperature sealing solution for aluminum anodizing. The launch expands Henkel's surface finishing capabilities for aluminum parts, enabling customers to pursue lower energy use and environmental impact. The new sealant supports stronger adhesion and process compatibility in mixed metal lines.
- February 2026: Henkel AG & Co. KGaA agreed to acquire specialty coatings company Stahl for 2.1 billion euros to expand Adhesive Technologies portfolio. The acquisition strengthens specialty coatings presence within the surface treatment ecosystem and broadens the companys coating capabilities. It also extends customer reach into high-performance, water-based segments.
- January 2026: Henkel AG & Co. KGaA acquired ATP Adhesive Systems to increase capabilities in high-performance water-based specialty tapes. The deal adds tape technologies to the surface treatments portfolio and broadens product capabilities for automotive and electronics applications.
Surface Treatment Chemicals Market Report Scope and Research Methodology
Market Definition and Coverage
This market covers chemicals used to prepare, clean, modify, and protect a surface before or during manufacturing, so the surface meets performance needs like adhesion, corrosion resistance, conductivity, or appearance. The sizing is value based and tracks revenue generated from chemical products sold for these treatment steps.
Scope exclusions: Equipment, process hardware, and outsourced surface treatment services are excluded from the market value.
Segments Covered in This Report
- By Chemical Type
- Cleaner
- Chemical Conversion Coating
- Anodizing Chemicals
- Other Types of Chemicals
- By Base Material
- Metal
- Plastic
- Other Base Materials (Glass, Alloys, Wood)
- By End-User Industry
- Automotive and Transportation
- Construction
- Electronics
- Industrial Machinery
- Others (Oil and Gas Pipeline, Power, Military, Packaging, etc.)
- Geography
- Asia-Pacific
- China
- India
- Japan
- South Korea
- ASEAN
- Rest of Asia-Pacific
- North America
- United States
- Canada
- Mexico
- Europe
- Germany
- United Kingdom
- France
- Italy
- Spain
- Russia
- Rest of Europe
- South America
- Brazil
- Argentina
- Rest of South America
- Middle-East and Africa
- Saudi Arabia
- South Africa
- Rest of Middle-East and Africa
- Asia-Pacific
Data Sources, Market Sizing, and Validation
Desk Research
To build the base structure of the model, we start with desk research that maps how demand forms across metals, plastics, and other substrates, and how it links to manufacturing output. Public sources are used to anchor the overall activity level and the direction of key end-use industries, and then we test those assumptions through interviews.
Common inputs came from macro indicators from the World Bank and IMF, trade flows from UN Comtrade for relevant chemical categories, and industrial production series from agencies such as the US Federal Reserve. For restrictions that affect chromates and other substances, we referenced the US EPA and the European Chemicals Agency, and for typical treatment steps we used technical publications from standards bodies such as ISO. We also pulled in company filings, investor presentations, reputable press coverage, patent databases, and a paid subscription for company financials and news to confirm revenue splits and recent capacity moves. This list is illustrative and many other sources were also consulted for data collection, validation, and research clarification.
Primary Interviews and Surveys
Primary interviews and surveys were used to pressure test what we saw in desk research and to tighten the assumptions that convert end-use activity into chemical demand. We spoke with formulators, distributors, applicators, and end users, then validated themes across APAC, EMEA, and the Americas so the regional mix, compliance impacts, and pricing movement were not overgeneralized.
Distribution of primary research fieldwork respondents
| Company type | Respondent position | Region |
|---|---|---|
| Top tier: 35% | CXOs: 17% | APAC: 43% |
| Mid tier: 47% | Functional/Unit leaders: 31% | EMEA: 33% |
| Smaller Players: 18% | Managers: 52% | Americas: 24% |
Market-Sizing & Forecasting
Market sizing was built using top-down and bottom-up checks so the total stays tied to real manufacturing demand and not just supplier narratives. On the top-down side, end-use production indicators were used to reconstruct the likely treatment chemical demand pool, mapped to typical chemical intensity by process step, and then converted to value using an ASP layer. We then corroborated the outcome using selective bottom-up approximations, such as sampled supplier revenue by region, distributor channel checks, and spot validation using volume x price for common chemistries where data was available.
Key model inputs included automotive and industrial production trends, aerospace build and maintenance activity, electronics output signals, and the pace of metal substitution and corrosion-protection requirements. We also tracked regulatory direction for chrome-free conversion systems, observed shifts in pretreatment lines and plating use, and used pricing movement for major chemical inputs to avoid holding ASPs flat through the forecast. Where gaps existed in smaller country markets, we first applied proxies such as industrial output and import patterns, then adjusted after expert feedback.
For forecasting, we used scenario analysis supported by a light multivariate regression on the most stable demand drivers, and then rechecked the trajectory using interview based expectations on capacity additions, substitution rates, and price normalization. This approach keeps the forecast explainable, and it can be replicated with the same public indicators and the same set of tested assumptions.
Data Validation & Update Cycle
Validation is done through multiple checks so one weak assumption does not distort the final market value. We compare outputs against independent signals, including end-use production movement, trade direction, and reasonable price bands by chemistry, and then investigate outliers before sign-off.
A second analyst reviews the calculation logic, unit conversions, and regional rollups. If large variance is detected, we re-check underlying inputs and sometimes re-contact interviewees for clarification. The report is refreshed annually, and interim updates are made when a material event changes demand, regulation, or pricing conditions. Before delivery, a fresh pass is completed so clients receive the latest updated view.
Mordor Intelligence's Surface Treatments Chemicals Market Size Compared With Other Published Estimates
Published market values for surface treatment chemicals often vary because the scope line is drawn differently and because pricing and end-use linkages are not always handled in the same way. Differences in the base year, currency conversion timing, and how fast chemistry shifts are assumed to happen can also move the final number by a wide margin.
Some estimates bundle adjacent items like outsourced finishing services or broader coatings related consumables, and then the total inflates even when the underlying manufacturing activity is similar. In Mordor Intelligence's model, only chemical products used for surface preparation and treatment are counted, and equipment and service revenues are excluded, which is then cross-checked using end-use production signals and interview based ASP ranges.
Benchmark comparison
| Source | Market Size | Gaps in Research Methodology |
|---|---|---|
| Mordor Intelligence | USD 5.10 B (2026) | |
| Industry Publisher A | USD 11.43 B (2025) | Uses a different base year and appears to include a wider product scope across surface-related consumables, and it applies a longer, more aggressive forecast window that lifts the implied growth path. |
| Industry Portal B | USD 16.85 B (2025) | Likely blends chemical sales with broader surface-treatment spend and uses less transparent price and volume linkages to end-use activity, which can push totals upward in high-output regions. |
Looking across the table, the spread is mainly explained by what gets counted as part of surface treatment and how prices and end-use demand are connected to the model. By keeping inputs tied to observable manufacturing indicators and then confirming assumptions through interviews, the final value stays traceable and can be repeated using the same steps.
Key Questions Answered in the Report
What CAGR is projected for surface treatment chemicals between 2026-2031?
Global consumption is USD 5.10 billion in 2026 and is projected to reach USD 7.06 billion by 2031, reflecting a 6.72% CAGR.
How will the EU phase-out of hexavalent chromium affect sourcing decisions?
OEMs have 18-24 months to re-qualify trivalent-chromium or zirconium alternatives, so many are lining up dual suppliers and stocking compliant chemistries early.
Why are zirconium conversion coatings overtaking phosphate baths on EV lines?
They run at room temperature, curb sludge by up to 90%, and work on steel-aluminum assemblies in a single tank, lowering energy and floor-space costs.
What revenue share does Asia-Pacific hold, and how is it trending?
The region accounted for 42.95% of 2025 spending and is advancing at a 7.05% CAGR through 2031.