
Customer Success Management Market Size and Share
Market Overview
| Study Period | 2020 - 2031 |
|---|---|
| Market Size (2026) | USD 2.68 Billion |
| Market Size (2031) | USD 7.14 Billion |
| Growth Rate (2026 - 2031) | 21.67 % |
| Fastest Growing Market | North America |
| Largest Market | North America |
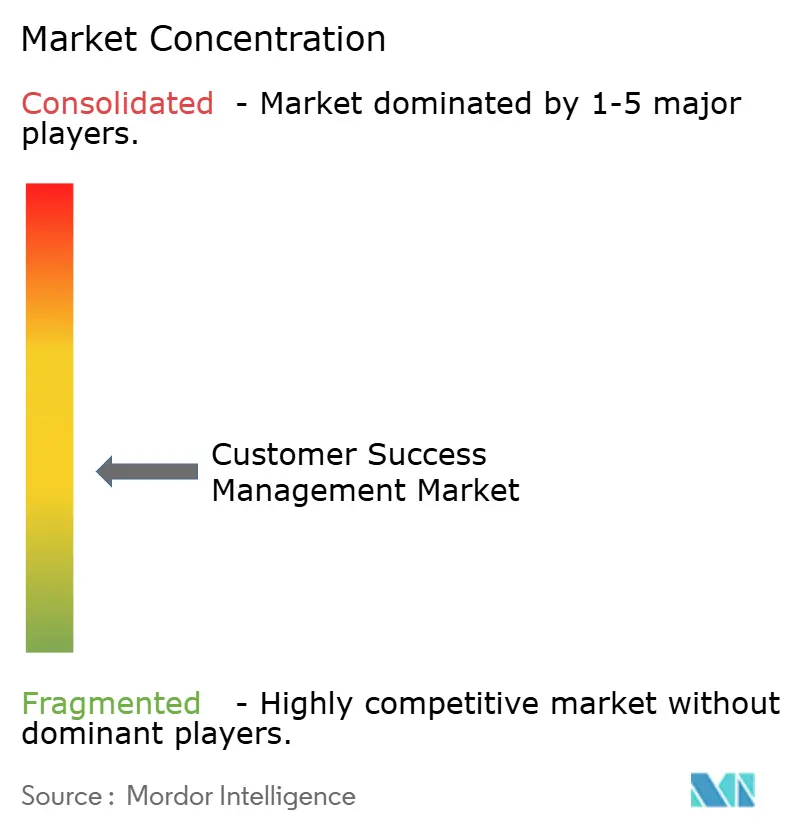
| Market Concentration | Medium |
Major Players *Disclaimer: Major Players sorted in no particular order Image © Mordor Intelligence. Reuse requires attribution under CC BY 4.0. | |
Customer Success Management Market Analysis by Mordor Intelligence
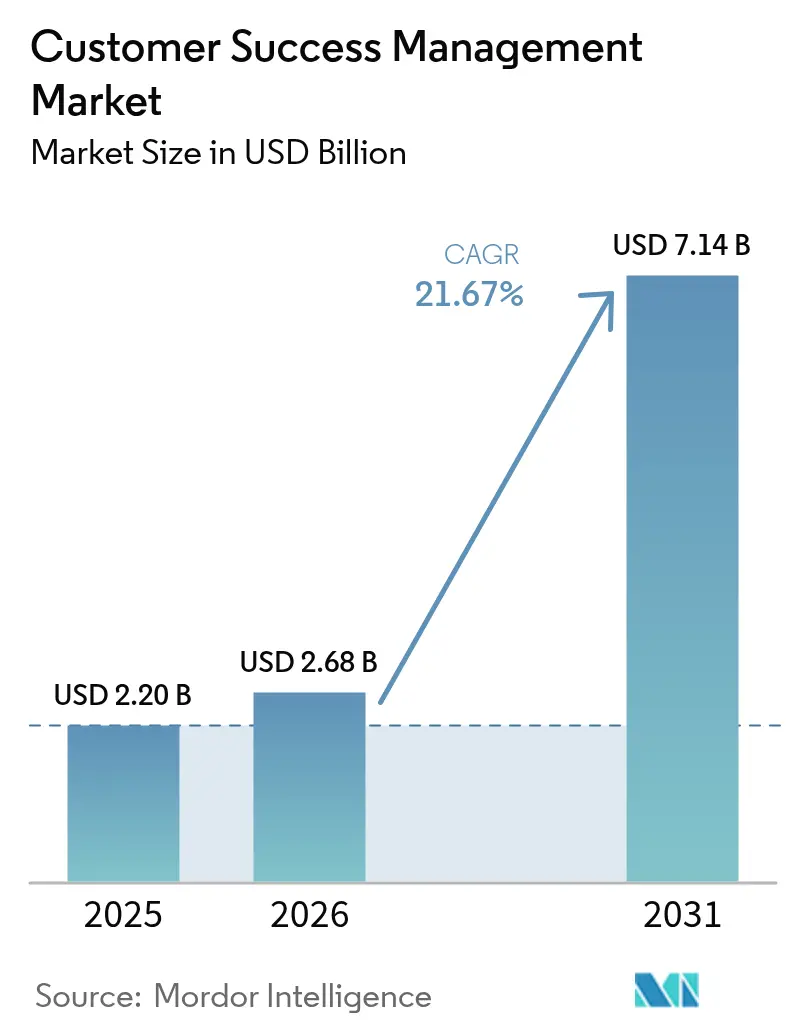
The customer success management market size was valued at USD 2.20 billion in 2025 and estimated to grow from USD 2.68 billion in 2026 to reach USD 7.14 billion by 2031, at a CAGR of 21.67% during the forecast period (2026-2031). The acceleration stems from enterprises pivoting toward subscription models where retention and expansion drive valuation metrics. Rapid cloud adoption, deeper AI infusion, and rising usage-based pricing are collectively reshaping platform requirements and procurement criteria. Vendors that can unify product telemetry with commercial data and automate playbooks gain a clear competitive advantage, while buyers prioritize compliance certifications and native data-warehouse connectivity. Simultaneously, constrained talent supply, integration complexity, and looming vendor consolidation temper the otherwise robust outlook.
Key Report Takeaways
- By deployment mode, cloud held 87.45% share of the customer success management market size in 2025, while the cloud segment is projected to expand at a 21.88% CAGR to 2031.
- By organization size, large enterprises led with 60.35% share of the customer success management market size in 2025; small and medium enterprises are advancing at a 21.95% CAGR through 2031.
- By component, platforms accounted for a 72.40% share of the customer success management market size in 2025, while services recorded the highest projected CAGR at 22.05% through 2031.
- By application, customer experience management captured 41.35% share of the customer success management market size in 2025; product usage analytics is set to rise at a 22.12% CAGR to 2031.
- By end-user vertical, the IT and telecom segment held 26.65% share of the customer success management market size in 2025, whereas healthcare and life sciences is forecast to post a 22.25% CAGR through 2031.
- By geography, North America commanded 44.35% share of the customer success management market size in 2025; Asia Pacific is poised for a 21.75% CAGR across the forecast horizon.
Note: Market size and forecast figures in this report are generated using Mordor Intelligence’s proprietary estimation framework, updated with the latest available data and insights as of 2026.
Global Customer Success Management Market Trends and Insights
Drivers Impact Analysis*
| Driver | (~) % Impact on CAGR Forecast | Geographic Relevance | Impact Timeline |
|---|---|---|---|
| Rapid adoption of cloud-based customer success platforms | +4.2% | Global – North America and Europe lead | Medium term (2-4 years) |
| Growing demand for personalized customer experience | +3.8% | Global – strongest in North America and Asia Pacific | Long term (≥ 4 years) |
| Expansion of subscription-based revenue models | +4.5% | Global – Asia-pacific fastest uptake | Long term (≥ 4 years) |
| Integration with product-led growth workflows | +3.2% | North America and Europe core | Medium term (2-4 years) |
| AI-driven predictive risk scoring adoption | +3.9% | Global – early in technology verticals | Short term (≤ 2 years) |
| Rise of usage-based SaaS pricing requiring new CS metrics | +2.6% | Global – concentrated in software | Medium term (2-4 years) |
| Source: Mordor Intelligence | |||


Rapid Adoption of Cloud-Based Customer Success Platforms
Cloud deployment eliminates infrastructure management and speeds up time-to-value, increasing the market penetration of Customer Success Management solutions that leverage warehouse-native architectures that plug directly into enterprise data lakes. Enterprises demand SOC 2 Type II and ISO 27001 certifications, as well as real-time analytics and elastic compute for AI workloads, making the cloud the default choice across both regulated and unregulated industries. Asia Pacific entities are bypassing legacy on-premise paths altogether, adopting cloud-first success strategies that align with broader digital overhaul plans. Cloud platforms now bundle agentic capabilities that blend autonomous bots and human oversight, scaling personalized engagement without proportional growth in headcount.[1]Planhat, “Next-Generation Customer Platform Planhat Raises USD 50 Million Series A,” planhat.com
Growing Demand for Personalized Customer Experience
Enterprises are shifting from generic lifecycle touchpoints to individualized workflows powered by behavioral analytics. Advanced segmentation triggers context-aware playbooks based on usage depth, sentiment, and outcome attainment rather than firmographics. Healthcare exemplifies this trend, as patient outcome metrics demand nuanced, multi-stakeholder coordination within strict compliance guardrails. Platforms integrating sentiment mining from email or call transcripts help managers tailor interventions, boosting satisfaction and retention outcomes. The push for end-to-end personalization accelerates vendor consolidation around unified data models that can orchestrate omnichannel engagement.[2]Gainsight, “CS Index Report: 4 Key Trends in Europe,” gainsight.com
Expansion of Subscription-Based Revenue Models
Recurring revenue now outweighs first-sale income, elevating customer success from a support adjunct to a strategic revenue engine. Software providers report that more than 40% of growth stems from existing customer expansion, with an intensification of investment in usage analytics, renewal forecasting, and health scoring. Usage-based pricing is proliferating, requiring metering that feeds both financial and success dashboards, reinforcing the demand for platforms that translate consumption data into bite-sized insights for managers and clients alike. Asia-Pacific manufacturers transitioning to service models further propel the uptake, favoring integrated suites that consolidate subscription billing, telemetry, and engagement workflows into a single platform.[3]M3ter, “Usage-Based Pricing: Boost Net Revenue Retention,” m3ter.com
Integration with Product-Led Growth Workflows
Product-led growth (PLG) enlarges account loads while mandating precision engagement rooted in in-app behavior. Success platforms, therefore, embed or tightly couple product analytics, enabling auto-triggered messaging when users complete key actions or lapse in utilization. Real-time data streams from telemetry provide higher fidelity for expansion forecasting than demographic variables, putting pressure on vendors to supply native connectors to popular data warehouses. Self-service onboarding and expansion flows complement high-touch playbooks for enterprise accounts, fostering a blended digital-human approach that scales without compromising the depth of relationships.
Restraints Impact Analysis*
| Restraint | (~) % Impact on CAGR Forecast | Geographic Relevance | Impact Timeline |
|---|---|---|---|
| Data integration and synchronization challenges | -2.8% | Global – heightened in complex enterprises | Medium term (2-4 years) |
| High initial platform implementation costs | -1.9% | Global – higher impact in emerging markets | Short term (≤ 2 years) |
| Vendor consolidation and lock-in risks | -1.4% | North America and Europe | Long term (≥ 4 years) |
| Scarcity of skilled customer success talent | -2.1% | Global – acute in tech and healthcare | Long term (≥ 4 years) |
| Source: Mordor Intelligence | |||
Data Integration and Synchronization Challenges
Enterprises juggle disparate CRM, ERP, support, and telemetry systems, making it arduous to craft a single source of truth. Duplicate records, inconsistent identifiers, and latency from batch file transfers erode algorithm accuracy and can sour client relationships. Highly regulated sectors impose additional encryption, access, and audit requirements, lengthening deployment cycles and increasing professional services costs. The complexity often compels firms to deploy specialized integration platforms and allocate scarce data engineering capacity, moderating overall adoption velocity.
Scarcity of Skilled Customer Success Talent
The demand for professionals fluent in analytics, product knowledge, and relationship management outstrips the supply, inflating salaries and widening execution gaps. Roles such as operations analysts or technical success managers frequently remain unfilled for months, throttling the roll-out of sophisticated health scoring or predictive workflows. Regional shortfalls are most acute in the Asia Pacific, where linguistic diversity complicates recruitment. Companies respond by doubling down on internal academies and cross-training, yet ramp-up periods lag behind market growth, constraining scale ambitions.
*Our forecasts treat driver/restraint impacts as directional, not additive. The impact forecasts reflect baseline growth, mix effects, and variable interactions.
Segment Analysis
By Deployment Mode: Cloud Supremacy Drives Platform Innovation
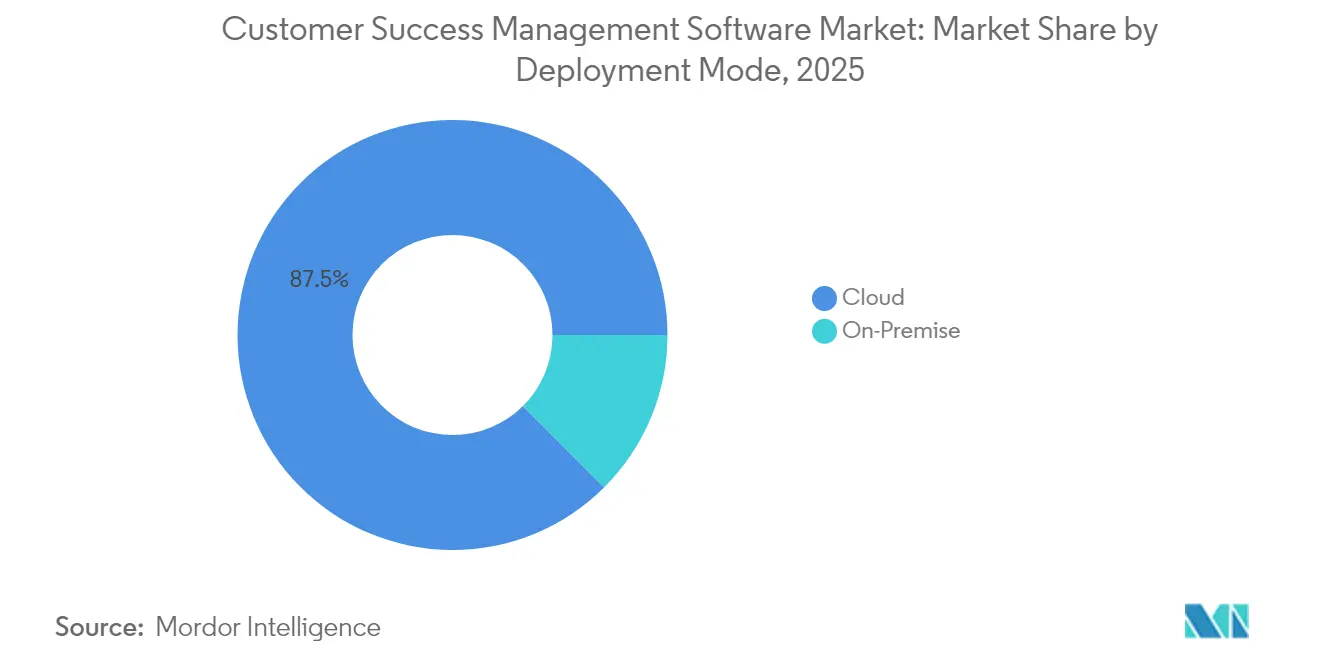
Cloud accounts for 87.45% of Customer Success Management market share in 2025 and is forecast to post a 21.88% CAGR through 2031. Enterprises favor cloud for elastic compute that supports AI-heavy workloads, while warehouse-native designs cut ETL delays to minutes. On-premise demand persists only where sovereignty or classified data rules prohibit external hosting. The marriage of cloud with AI spawns “agentic” features that route routine tasks to bots, freeing managers for strategic consultation. Compliance-conscious buyers scrutinize platforms for granular permissions and immutable audit trails, elevating vendors that can certify to SOC 2 Type II and ISO 27001 standards. Hybrid offerings that keep sensitive data on-site while leveraging cloud analytics address transitional scenarios, thereby maintaining customer confidence throughout the migration process.
The momentum of the cloud segment boosts auxiliary revenue in professional services as enterprises seek best-practice configurations for complex fleets of products and geographies. Vendors that maintain infrastructure in multiple regions tend to win deals in Europe and the Asia Pacific, where data residency is a key consideration. Furthermore, warehouse-native strategies align with the broader movement toward composable architectures: customers tap cloud success platforms as a thin insight layer riding atop centralized, governed data, ensuring long-term extensibility and cost efficiency.


By Organization Size: SME Acceleration Challenges Enterprise Dominance
Large enterprises accounted for 60.35% of the Customer Success Management market revenue in 2025, driven by complex account portfolios that require multidimensional health metrics, multilingual support, and advanced security. Yet SMEs demonstrate the fastest clip at 21.95% CAGR, buoyed by no-code interfaces, pre-built integrations, and consumption-linked pricing that mirrors their revenue cycles. The democratization trend underscores a strategic shift wherein even firms with revenues under USD 100 million view churn control and expansion revenue as board-level metrics.
Enterprise practitioners continue to favor robust platforms with sandbox environments, testing frameworks, and role-based security that align with complex organizational structures. Service-heavy rollouts, encompassing change management workshops and cross-departmental alignment, maintain the enterprise's share dominance in absolute terms. Meanwhile, SMEs value rapid deployment within weeks and frictionless onboarding of non-technical staff, creating tailwinds for vendors offering templated playbooks and guided set-up wizards. Providers that can modularize functionality and price in tiers position themselves to migrate customers smoothly from SME plans to enterprise suites, locking in lifetime value.
By Component: Services Growth Reflects Implementation Complexity
Platforms dominate the Customer Success Management market with a 72.40% share in 2025, anchoring core functions such as data ingestion, health scoring, and workflow orchestration. Yet services grow the fastest at a 22.05% CAGR, highlighting the challenges of data harmonization, cultural change, and model tuning. Enterprises are increasingly treating customer success transformation as an end-to-end program that encompasses governance, metric realignment, and continuous optimization, thereby spurring demand for consulting, integration, and managed analytics.
Platform vendors augment margins by bundling advisory packages that include business value mapping, outcome design, and tailored KPI frameworks. Third-party system integrators carve out niches by integrating customer success with ERP, CPQ, and product analytics, particularly for subscription transitions in legacy manufacturing and healthcare. Managed services emerge for SMBs lacking specialized staff, covering ongoing dashboard maintenance and predictive model recalibration, indicating a multi-year annuity stream rather than one-off implementation fees.
By Application: Product Usage Analytics Drives Expansion Intelligence
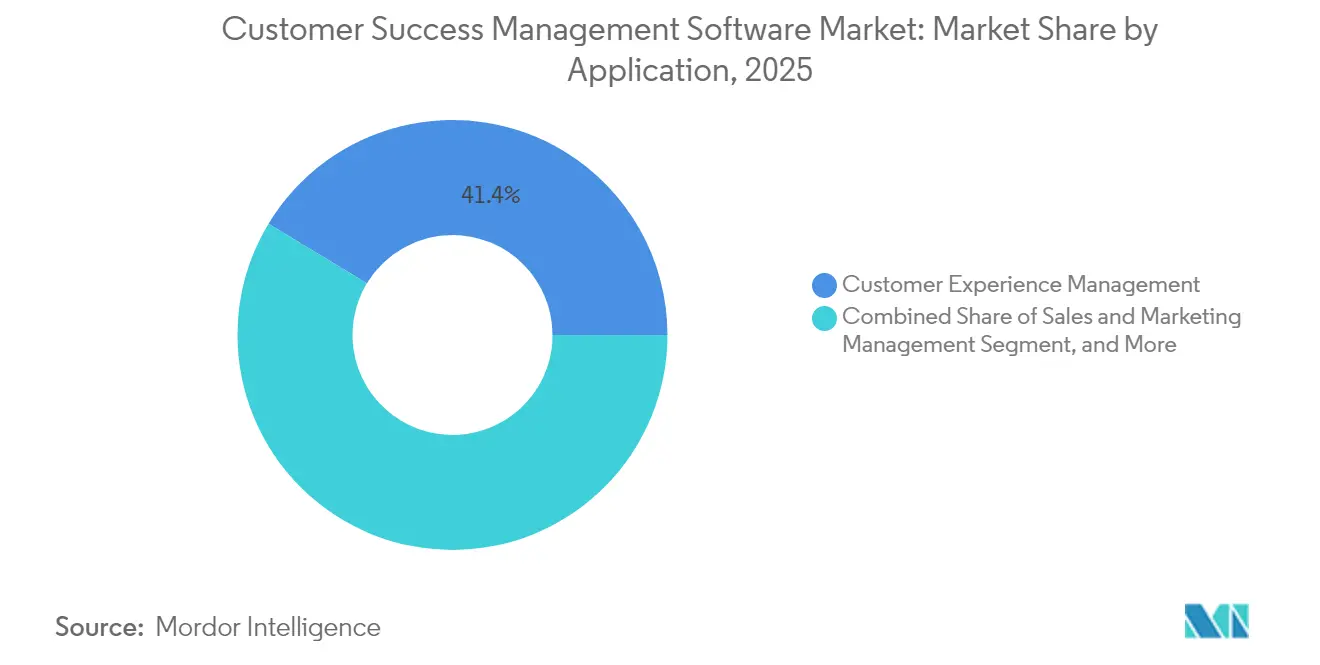
Customer experience management accounted for 41.35% of 2025 revenues, delivering a traditional renewal cadence, adoption campaigns, and NPS tracking. However, product usage analytics is poised for a 22.12% CAGR, reflecting PLG adoption, where in-app behavior predicts upsell more accurately than demographic signals. Health scoring models now weigh feature exploration depth, daily active use, and seat expansion trends, arming managers with defensible expansion proposals.
Growth in usage analytics promotes tighter synergies between success and product teams, feeding roadmaps with real-world utilization metrics. Vendors integrate low-code telemetry collectors or native SDKs, reducing the engineering effort required for clients. Additional traction comes from risk and compliance management add-ons, especially in sectors like healthcare, where audit-ready logs and outcome reports serve regulatory filings. Sales and marketing overlays facilitate cross-sell orchestration by surfacing expansion-ready cohorts directly into CRM workflows, tightening go-to-market alignment and accelerating revenue cycles.
By End-User Vertical: Healthcare Transformation Accelerates Adoption
IT and telecom comprised 26.65% of 2025 spending thanks to mature SaaS cultures and complex renewal motions. Healthcare and life sciences, although smaller, are the fastest risers, with a 22.25% CAGR, as regulatory shifts and the adoption of value-based care spur the use of outcome-driven engagement models. Pharmaceutical firms apply customer success methods to field service equipment, patient adherence programs, and multi-channel provider education, while med-tech vendors integrate device telemetry for proactive intervention.
Financial services adopt platforms to orchestrate multi-product portfolio retention and navigate strict compliance, whereas retail and ecommerce harness success insights to elevate subscription boxes and membership perks. Manufacturing explores equipment-as-a-service bundles, utilizing telemetry-backed health checks to prevent downtime and secure multi-year renewals. This vertical diversification broadens the addressable Customer Success Management market and reinforces vendors’ need for configurable compliance modules and industry-specific workflows.
Geography Analysis
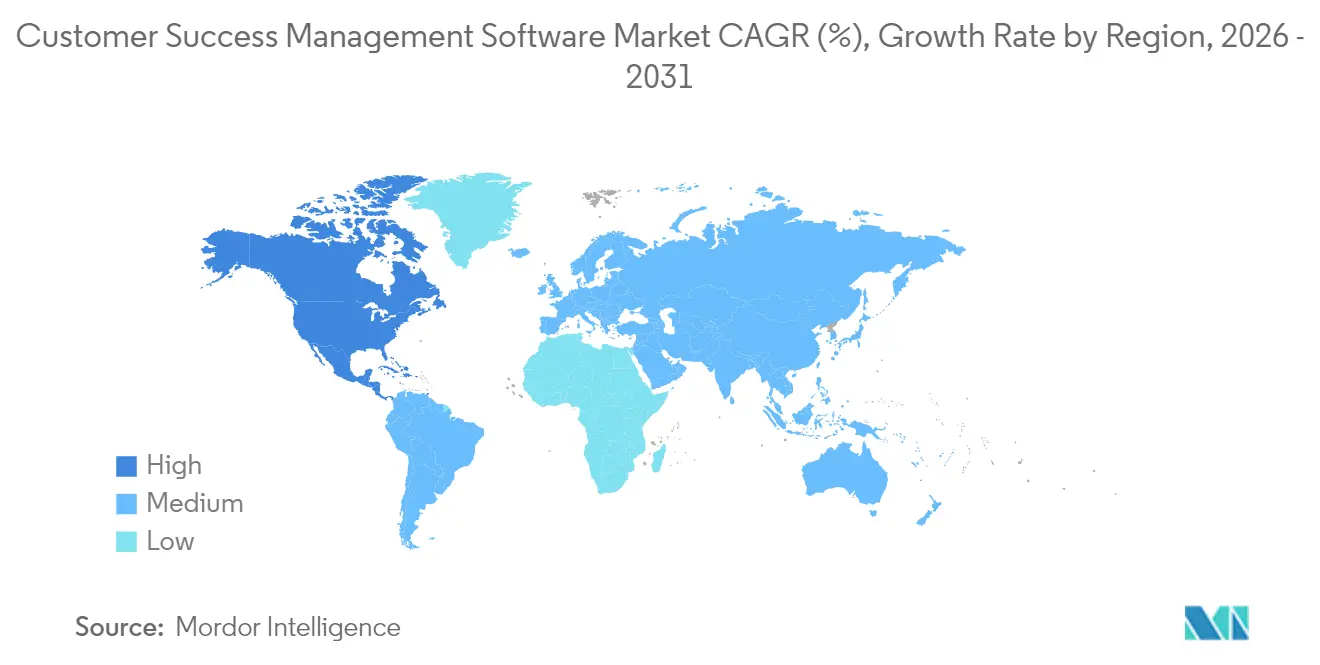
North America controlled 44.35% of Customer Success Management market revenue in 2025 on the back of early subscription adoption, a dense concentration of software vendors, and established customer success maturity. Enterprises regularly benchmark net revenue retention and allocate sizable budgets to AI-driven playbooks, driving uptake of premium suites with advanced data modeling and autonomous orchestration. U.S. public companies highlight retention metrics in earnings calls, further institutionalizing customer success as a valuation lever.
Europe follows closely, propelled by stringent privacy mandates and cross-border commerce complexity. GDPR-compliant hosting, local data residency options, and fine-grained consent management top buyer checklists. European firms dedicate larger budget percentages to expansion revenue initiatives, reflecting slower net-new logo growth relative to the United States. Market momentum is visible in German and French SaaS clusters, where regional champions deploy multilingual playbooks across continental subsidiaries.
Asia Pacific is the fastest-growing region with a 21.75% CAGR through 2031, fueled by proliferating cloud infrastructure, mobile-first user bases, and vigorous startup ecosystems. Companies in India, Singapore, and Indonesia leapfrog legacy on-prem systems, embracing cloud-native customer success to complement aggressive PLG go-to-market strategies. Japan and Australia, meanwhile, integrate success platforms into mature IT stacks, emphasizing compliance with domestic data-sovereignty codes.
South America and the Middle East see nascent but rising demand, concentrated in fintech, telecom, and public service digitization. Brazilian and Mexican providers pilot success workflows to stem churn amid competitive broadband rollouts, whereas Gulf states deploy platforms within national AI agendas to raise citizen service satisfaction. In Africa, early deployments cluster around South African SaaS exporters and Nigerian fintechs seeking to extend unit economics in mobile money. Collectively, emerging markets underscore the universality of retention economics, affirming the global relevance of the Customer Success Management market.

Regulatory Landscape
Customer success management (CSM) platforms operate under increasingly tight privacy, cybersecurity, operational-resilience, and AI governance requirements, since they ingest and process CRM, product telemetry, billing, and interaction data across regions. In the European Union, the Digital Operational Resilience Act (DORA) has been in force since 17 January 2025 and increases scrutiny on ICT service providers that support regulated financial entities, raising expectations around incident response, resilience testing, and third-party risk controls for SaaS-delivered CSM deployments.
Data access and portability rules also shape platform architectures and commercial terms. The EU Data Act (effective since September 2025) strengthens user rights to access data from connected products and introduces switching and data egress requirements by 12 January 2027, which pushes buyers to assess exportability, warehouse connectivity, and contract clauses related to vendor lock-in. Outside the EU, compliance approaches diverge further, including the UK Department for Science, Innovation and Technology call for evidence launched in July 2026 (closing 9 September 2026) on how data regulation interacts with AI and other data-intensive technologies, and Pakistan's National Data Governance Policy issued in June 2026 by the Ministry of Information Technology and Telecommunication. This policy formalizes oversight and cross-border transfer governance through the Pakistan Digital Authority.
Value Chain Analysis
The customer success management value chain begins with upstream data creation and capture across CRM, support, billing/subscription systems, and product usage telemetry. It then moves into ingestion and identity resolution, analytics and health scoring, playbook automation, and omnichannel engagement execution. Cloud infrastructure and data platforms, particularly enterprise data warehouses, act as key enabling layers for elastic compute and governed storage, while security and compliance controls (access management, audit logging, resilience) remain gating factors for adoption in regulated and global deployments.
Downstream delivery increasingly blends software and services to address integration bottlenecks and the scarcity of skilled customer success talent. System integrators and managed service providers configure connectors, normalize data models, and operationalize KPI frameworks, while platform vendors expand professional services and prebuilt automation to shorten time-to-value. The shift toward agentic workflows is also changing roles across the chain. In May 2026, Gainsight introduced an agentic stack (including Agent Studio) and expanded its software-plus-services motion by evolving Atlas into an AI-Native Services business that can run renewal workflows end-to-end, reflecting a broader move from tooling supply toward operational accountability for post-sales outcomes.
Competitive Landscape
The customer success management market is moderately fragmented. Incumbents such as Salesforce, Gainsight, and HubSpot anchor the top tier with end-to-end suites that couple CRM, analytics, and workflow engines. Gainsight’s 2025 purchase of interaction-analytics specialist Staircase AI broadened its sentiment capabilities, while Salesforce infused its Data Cloud and Agentforce modules with generative AI, driving annual recurring revenue above USD 1.2 billion.
Disruptors leverage warehouse-native and API-first principles to undercut legacy vendors on implementation speed. Planhat’s USD 50 million influx is earmarked for commercial expansion and accelerating AI features, whereas Vitally’s project-management spin appeals to cross-functional post-sales teams. Vertical specialists, such as Veeva Systems in the life sciences and Totango in technology, harness domain templates to ease compliance and accelerate ROI.
Mergers and acquisitions aim to consolidate overlapping functionalities across success, product analytics, and feedback management. ClientSuccess’s January 2025 buyout of Product Signals integrates voice-of-customer loops directly into health scoring engines, signaling a trend toward unified post-sales platforms. Simultaneously, open-core entrants experiment with consumption pricing, aligning vendor revenue with actual outcome realization rather than seat counts.
Competition is increasingly hinging on the breadth of AI, ease of integration, and ecosystem partnerships. Vendors embedding native connectors to Snowflake, Databricks, or Amazon Redshift win favor among data-savvy buyers, while collaborations with hyperscalers unlock co-sell pipelines. Market entrants circumvent talent scarcity by integrating prescriptive AI agents that draft engagement emails, propose QBR agendas, and surface churn-risk alerts, lowering user proficiency hurdles and expanding accessible TAM.
Customer Success Management Industry Leaders
Gainsight Inc.
Salesforce.com, Inc.
IBM Corporation
Open Text Corporation
SAP SE
- *Disclaimer: Major Players sorted in no particular order

Market Opportunities and Future Outlook
White-space remains in unifying fragmented customer data, including product telemetry, CRM, support interactions, and billing, into a single governance-grade foundation that supports reliable health scoring and automation across regions and business units. With cloud already accounting for 87.45% of deployments in 2025, buyers increasingly evaluate vendors on native data-warehouse connectivity, data portability, and auditability rather than workflow features alone. This creates room for warehouse-native implementations, integration accelerators, and packaged data models that reduce the lift of identity resolution and metric standardization.
A second opportunity is operationalizing agentic and AI-assisted customer success beyond copilots into repeatable, controlled workflows that handle routine actions while preserving enterprise guardrails. In May 2026, ServiceNow added an AI-driven product adoption roadmap capability within its Technology Provider Service Management (TPSM) Australia Store update, reinforcing demand for tools that translate historical engagements and maturity data into actionable plans. Vendor roadmaps are also converging on interoperability patterns that connect customer context to general-purpose LLMs, including Gainsight support for the Model Context Protocol (MCP) across its platforms (announced April 2026). That capability creates integration pathways for enterprises looking to orchestrate customer retention playbooks across multiple systems without rebuilding AI context plumbing for each use case.
Recent Industry Developments
- May 2026: Gainsight launched the Agentic Stack for customer retention, including Gainsight Agent Studio powered by Claude. The release expands customer success automation from insight generation to orchestrated workflows, increasing competitive pressure on platforms to deliver governed, end-to-end agent experiences rather than isolated AI features.
- February 2026: Salesforce disclosed that more than 180 organizations adopted Agentforce IT Service within four months of launch. The milestone indicates accelerating enterprise standardization around agentic service operations, which affects how customer success teams integrate post-sales workflows with broader IT and service management stacks.
- September 2025: Planhat closed a USD 50 million Series A to scale its warehouse-native customer platform globally. The funding supports product development and go-to-market expansion around modern data architectures, reinforcing buyer demand for faster implementations and native connectivity to centralized analytics environments.


Research Methodology Framework and Report Scope
Market Definition and Coverage
This market covers revenue from customer success management platforms and related services that help companies onboard users, track adoption, reduce churn, and drive expansion. It includes both cloud and on-premise deployments across major industries.
Scope exclusions: We exclude general-purpose CRM, contact center, and standalone marketing automation tools when they are sold and used without a defined customer success management workflow.
Segmentation Overview
- By Deployment Mode
- Cloud
- On-Premise
- By Organization Size
- Small and Medium Enterprises
- Large Enterprises
- By Component
- Platforms
- Services
- By Application
- Sales and Marketing Management
- Customer Experience Management
- Risk and Compliance Management
- Product Usage Analytics
- Other Applications
- By End-user Vertical
- IT and Telecom
- BFSI
- Healthcare and Life Sciences
- Retail and E-commerce
- Government
- Industrial and Manufacturing
- Other End-user Vertical
- By Geography
- North America
- United States
- Canada
- Mexico
- South America
- Brazil
- Argentina
- Chile
- Rest of South America
- Europe
- United Kingdom
- Germany
- France
- Italy
- Spain
- Russia
- Rest of Europe
- Asia Pacific
- China
- Japan
- India
- South Korea
- Australia and New Zealand
- Southeast Asia
- Rest of Asia Pacific
- Middle East
- Saudi Arabia
- United Arab Emirates
- Turkey
- Israel
- Rest of Middle East
- Africa
- South Africa
- Nigeria
- Kenya
- Egypt
- Rest of Africa
- North America
Data Sources, Market Sizing, and Validation
Desk Research
Desk work starts by building a clean view of the addressable demand pool for customer success management, then mapping adoption signals to revenue. We relied on public sources such as US SEC filings for product revenue notes, the US Bureau of Labor Statistics for customer success related role trends, and OECD digital economy indicators to understand broader SaaS usage patterns.
To avoid overcounting adjacent software, we also reviewed sources such as ISO and NIST publications for terminology around customer data and governance. We complemented those with peer-reviewed journals on customer retention and lifecycle management to distinguish what is typically treated as customer success versus customer support. We then paired those inputs with company websites, investor decks, and reputable press coverage to confirm packaging and typical buying motions. Where needed, we referenced paid subscriptions for company financials and intelligence, patent lookups, and news and financials to cross-check timelines and product focus. The desk sources listed here are illustrative only, and other public materials were used for collection, validation, and clarification.
Primary Interviews and Surveys
Primary work was used to stress-test what was learned from desk sources, especially around what buyers include in a customer success program and how budgets are split between platforms and services. We spoke with a mix of software providers, implementation partners, and enterprise users across APAC, EMEA, and the Americas, then rechecked assumptions where responses showed wide variance in pricing or adoption maturity.
Distribution of primary research fieldwork respondents
| Company type | Respondent position | Region |
|---|---|---|
| Top tier: 27% | CXOs: 12% | APAC: 46% |
| Mid tier: 58% | Functional/Unit leaders: 31% | EMEA: 33% |
| Smaller Players: 15% | Managers: 57% | Americas: 21% |
Market-Sizing & Forecasting
Our sizing uses a top-down approach where enterprise software spend and SaaS adoption indicators are translated into a customer success management demand pool, then split by deployment and customer type using observed adoption patterns. To keep totals realistic, the output is corroborated with selective bottom-up approximations, such as sampling typical annual contract values, validating user counts by organization size, and checking how much services revenue is attached to platform rollouts.
Key inputs used in the model include cloud versus on-premise preference by region, the share of subscription businesses that run formal onboarding and health scoring programs, average contract value progression by buyer size, implementation and support intensity for complex deployments, and the pace of churn reduction initiatives in major verticals. When data points were missing for smaller geographies, we applied proxy ratios from similar markets and adjusted them after channel checks with local respondents.
Forecasting is based on scenario analysis with simple trend fitting. Growth is tied to drivers such as recurring revenue expansion focus, broader use of product usage analytics, and higher automation in customer journeys. Assumptions were tuned only after expert feedback aligned on direction and magnitude, so the final curve remains explainable and repeatable.
Data Validation & Update Cycle
Validation is done by comparing model outputs with independent signals, including software budget growth markers, hiring trends tied to customer success functions, and the observed mix of platform versus services revenue in real deployments. Outliers are reviewed first at the regional level and then at the global roll-up. We re-contact respondents when pricing, adoption, or scope boundaries appear to be shifting.
Before sign-off, the file is reviewed by another analyst for arithmetic checks, unit consistency, and year-over-year logic. Adjustments are documented so the trail is easy to follow. Reports are refreshed annually, with interim updates when material events occur that could change demand or pricing. A final pre-delivery pass is completed so clients receive the latest view.
Mordor Intelligence's Customer Success Management Market Size Measured Against Other Published Estimates
Published market values for customer success management rarely match perfectly because authors do not always use the same product boundaries, and the reference year can differ. The table makes the spread easy to see, and it also clarifies why a like-for-like comparison needs careful attention to what is included.
Differences largely come from what gets counted as customer success management versus broader customer experience stacks, plus how services revenue is treated. In Mordor Intelligence's model, the value is tied to customer success management platforms and related services by deployment mode and end-user use cases, which reduces overlap with CRM or contact center spending that is often included in broader estimates.
Benchmark comparison
| Source | Market Size | Gaps in Research Methodology |
|---|---|---|
| Mordor Intelligence | USD 2.68 B (2026) | |
| Global Consultancy A | USD 2.43 B (2025) | Uses an earlier base year and can land lower if vendor revenue timing is based on reported financial years, and if some services revenue is treated as optional and not consistently attached to platform deployments. |
| Industry Publisher B | USD 2.67 B (2025) | Extends the forecast window and can skew higher when aggressive adoption scenarios are applied over a longer horizon, and when adjacent experience tools are grouped into the same spend bucket during currency conversion and reporting. |
Across the three sources, year choice and treatment of adjacent software categories explain most of the gap, not a lack of demand. By keeping scope tight to customer success management buying and validating pricing and adoption assumptions through direct checks, we deliver a balanced number that can be traced to clear inputs and reviewed again as conditions change.


Key Questions Answered in the Report
What is the projected value of the Customer Success Management market by 2031?
The market is forecast to reach USD 7.14 billion by 2031 at a 21.67% CAGR.
Which deployment mode leads in Customer Success Management solutions?
Cloud deployment dominates with an 87.45% share in 2025 and remains the fastest-growing segment.
Which region is expanding the fastest for customer success platforms?
Asia Pacific is projected to grow at a 21.75% CAGR through 2031, outpacing all other regions.
How are small and medium enterprises influencing adoption trends?
SMEs are adopting no-code, consumption-priced platforms, driving a 21.95% CAGR and challenging enterprise dominance.
Which application area is expected to grow the fastest?
Product usage analytics is set to rise at a 22.12% CAGR, propelled by product-led growth strategies.
What restraints could slow down market expansion?
Data integration hurdles and a shortage of skilled customer success talent present the most significant brakes on growth.
Page last updated on:


 Your data is secure and never sold or shared.


