Crossover Vehicles Market Size and Share
Market Overview
| Study Period | 2019 - 2030 |
|---|---|
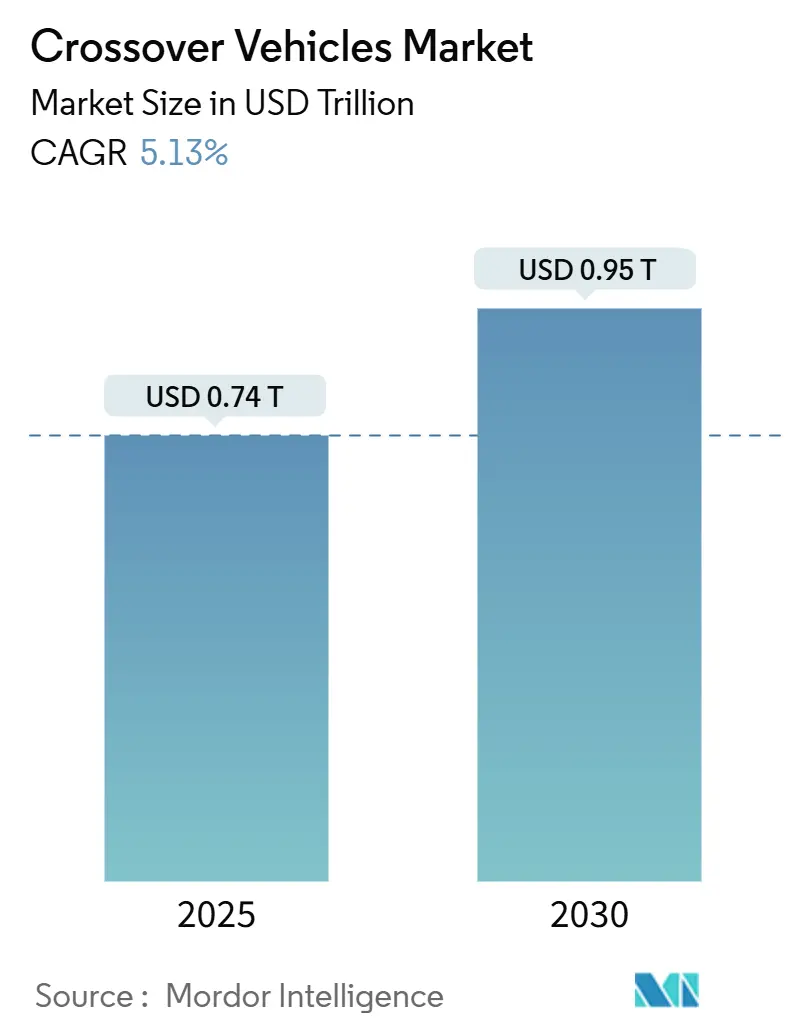
| Market Size (2025) | USD 0.74 Trillion |
| Market Size (2030) | USD 0.95 Trillion |
| Growth Rate (2025 - 2030) | 5.13% CAGR |
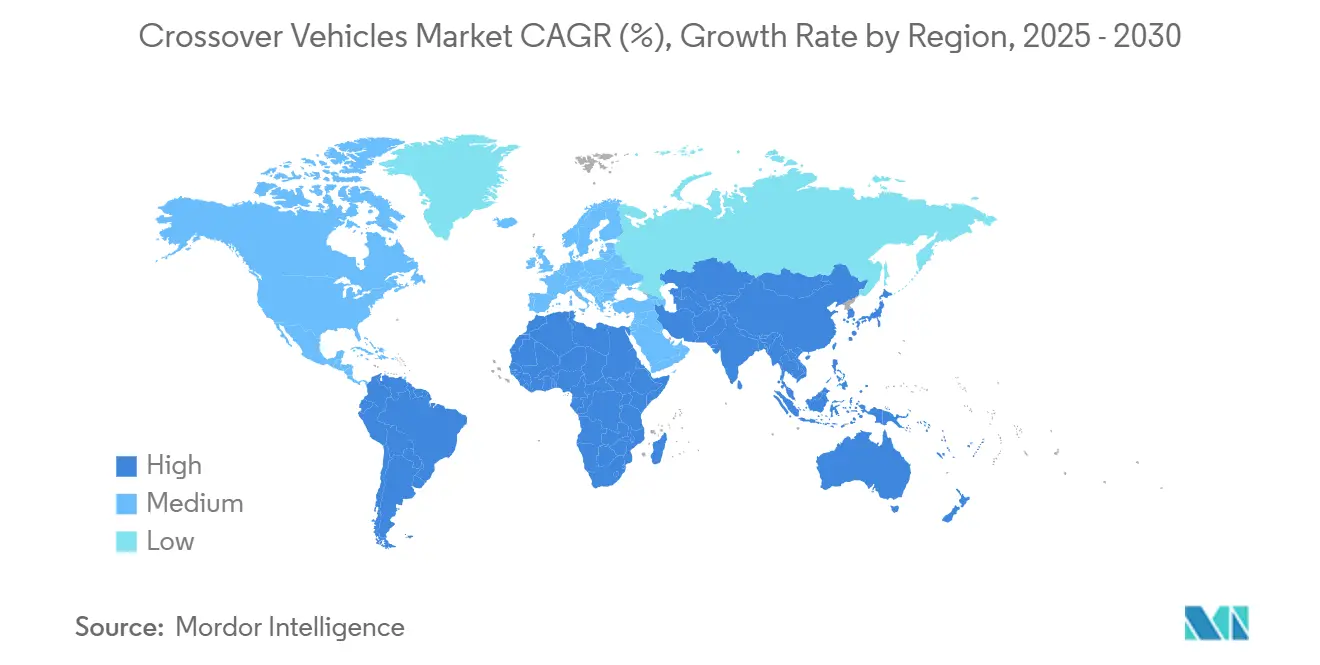
| Fastest Growing Market | Middle East and Africa |
| Largest Market | Asia Pacific |
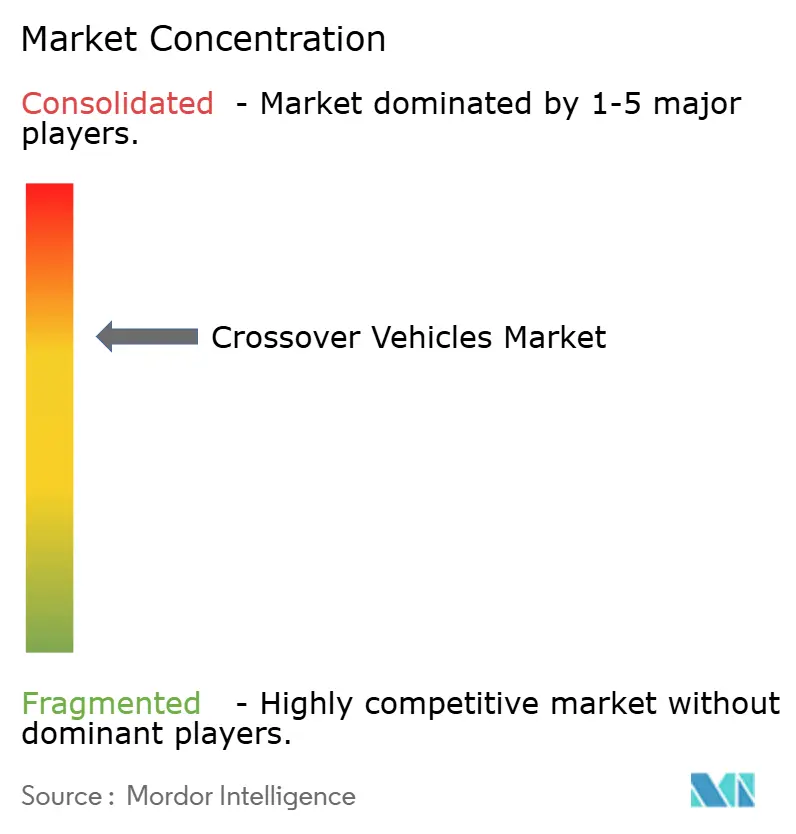
| Market Concentration | Medium |
Major Players *Disclaimer: Major Players sorted in no particular order Image © Mordor Intelligence. Reuse requires attribution under CC BY 4.0. | |
Crossover Vehicles Market Analysis by Mordor Intelligence
The Crossover Vehicles Market size is estimated at USD 0.74 trillion in 2025, and is expected to reach USD 0.95 trillion by 2030, at a CAGR of 5.13% during the forecast period (2025-2030). Rising demand for vehicles that blend SUV practicality with car-like ride and handling, modular production platforms that lower costs, and the accelerating shift toward electrified powertrains work together to sustain this expansion. Automakers are cutting design cycles by leveraging shared architectures. While petrol variants still account for a significant portion of unit sales 2024, battery-electric crossover nameplates are witnessing steady growth. The Asia–Pacific region leads in consumption, capturing a substantial share of 2024 revenue. However, the Middle East & Africa are experiencing the fastest regional growth, driven by infrastructure upgrades and rising disposable incomes. Mid-size models comprise most of the unit mix, but small crossovers are advancing as urban drivers lean towards compact and manoeuvrable options. Automatic transmissions, holding a dominant market share, are growing steadily, reflecting a clear customer preference for convenience and efficiency. Legacy brands face intense competitive pressure, grappling with battery costs and CO₂ regulations, all while defending their market share against the rapidly globalising Chinese manufacturers.
Key Report Takeaways
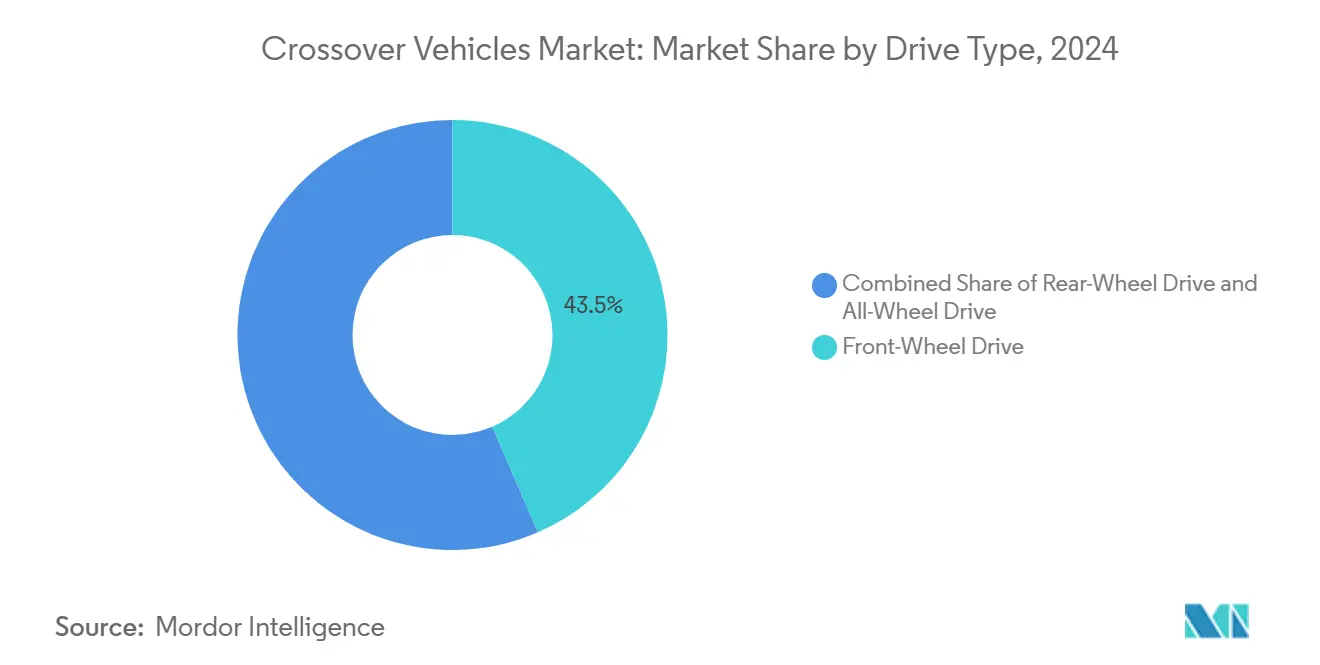
- By drive type, front-wheel drive maintained 43.47% of the crossover vehicles market share in 2024; all-wheel drive is projected to expand at a 5.15% CAGR through 2030.
- By fuel type, petrol powertrains held 48.73% of the crossover vehicles market share in 2024; battery electric variants are forecast to register a 5.24% CAGR to 2030.
- By vehicle size, mid-size crossovers captured 46.17% of the crossover vehicle market share in 2024; small-size variants are projected to expand at a 5.27% CAGR between 2025 and 2030.
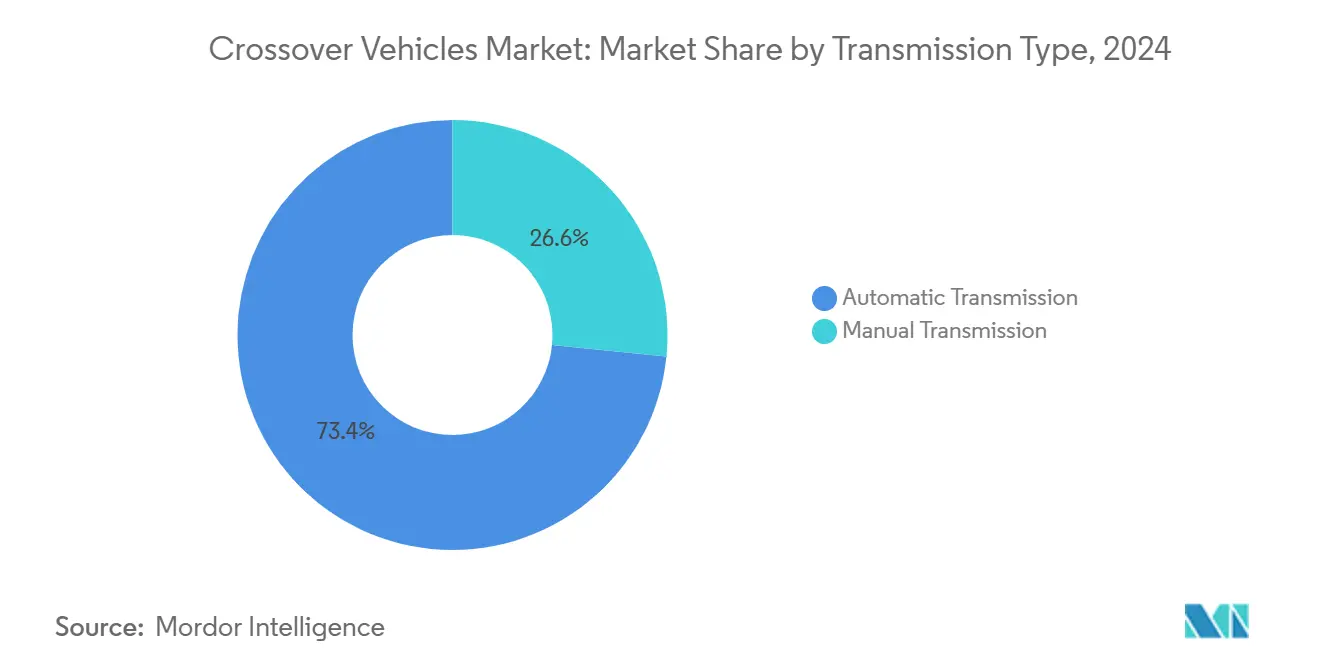
- By transmission, the automatic segment accounted for 73.41% of the crossover vehicles market size in 2024 and is progressing at a 5.17% CAGR over the forecast period.
- By application, personal use commanded 83.14% of the crossover vehicles market size in 2024, but fleet operations are advancing at a 5.18% CAGR to 2030.
- By geography, the Asia–Pacific region held 38.23% of the crossover vehicle market share in 2024, while the Middle East and Africa region is forecast to post the highest CAGR, at 5.21%, through 2030.
Global Crossover Vehicles Market Trends and Insights
Drivers Impact Analysis*
| Driver | (~) % Impact on CAGR Forecast | Geographic Relevance | Impact Timeline |
|---|---|---|---|
| Rising Demand For Fuel-Efficient SUVs | +1.2% | Global, with strong uptake in Asia Pacific and North America | Medium term (2-4 years) |
| Modular Vehicle Platforms | +0.9% | Global, led by established OEMs in Europe and Asia | Long term (≥ 4 years) |
| Urban Consumers Preferring Compact Crossovers | +0.8% | Asia Pacific core, spill-over to urban centers in MEA and Latin America | Short term (≤ 2 years) |
| Subscription-Based Ownership Models | +0.6% | North America and EU, early adoption in major metropolitan areas | Medium term (2-4 years) |
| Lightweight Composites | +0.5% | Global, with premium segment leadership in Europe and North America | Long term (≥ 4 years) |
| Growing Female Driver Segment | +0.4% | Asia Pacific and MEA, concentrated in India, China, and urban centers | Medium term (2-4 years) |
| Source: Mordor Intelligence | |||
Rising Demand for Fuel-Efficient SUVs with Car-Like Handling
Consumer preference shifted decisively toward crossovers that deliver SUV utility without a fuel-economy penalty. Units achieving 15.5–18.1 km/L gained share in 2024 as volatile fuel prices and higher environmental awareness influenced purchase decisions. Hybrid systems such as Chery’s Super Hybrid, advertising half of thermal efficiency, can lower real-world consumption to 2–3 L/100 km in optimal conditions. Elevated seating, flexible cargo configurations, and improved ride quality foster single-vehicle households that no longer own sedan and SUV bodies [1]“Super Hybrid Powertrain Brochure,” Chery Automobile Co., chery.com . These attributes sustain brand loyalty and encourage repeat purchases.
Modular Vehicle Platforms Lowering Manufacturing Costs
Leading OEMs deploy flexible architectures, Hyundai’s E-GMP and Volkswagen’s MEB to share key modules across multiple body sizes and powertrains. Resulting in one-fourth cost savings, while development cycles compress to 12–18 months compared with traditional 3-year programs. Kia’s Gwangmyeong EVO Plant, funded a huge amount, illustrates the scale advantages: one line outputs up to 150,000 electrified crossovers annually using standard component sets [2]“Gwangmyeong EVO Plant Investment Release,” Kia Corporation, kia.com . This efficiency lets brands price entry trims competitively in emerging regions without eroding margins.
Urban Consumers Preferring Compact Crossovers
Congested cities intensify demand for small crossovers that fit tight parking bays yet still haul family gear. Toyota RAV4 and Honda CR-V lead global sales, registering record sales in June 2025, while BYD SongPLUS DM achieved multiple Chinese deliveries through value pricing and extended electric range. Urban infrastructure upgrades reduce the need for full-size SUVs, reinforcing a robust CAGR for the compact class.
Subscription-Based Ownership Models Expanding Crossover Fleets
Leasing and month-to-month subscription programs accounted for about two-fifths of 2024 fleet additions. Crossovers dominate these fleets because they satisfy varied customer preferences and carry lower maintenance costs than body-on-frame SUVs. Operators report one-third lower total cost of ownership for hybrid crossovers, enhancing profitability. Younger consumers drawn to access over ownership accelerate this institutional demand [3]“2024 Subscription Fleet Report,” Volvo Car Financial Services, volvocars.com .
Restraints Impact Analysis*
| Restraint | (~) % Impact on CAGR Forecast | Geographic Relevance | Impact Timeline |
|---|---|---|---|
| High Battery Cost | -0.8% | Global, with acute impact in price-sensitive emerging markets | Medium term (2-4 years) |
| Stricter Co₂ Regulations | -0.6% | Europe and North America, with spillover to export markets | Long term (≥ 4 years) |
| Semiconductor Supply-Chain Volatility | -0.4% | Global, with concentrated impact in Asia Pacific manufacturing hubs | Short term (≤ 2 years) |
| Rapid Tech Obsolescence | -0.3% | North America and EU, early impact in premium segments | Medium term (2-4 years) |
| Source: Mordor Intelligence | |||
High Battery Cost in BEV Crossovers
Average lithium-ion pack prices sat at USD 139/kWh in 2024, adding USD 8,000–12,000 to the bill of materials for mid-size electric crossovers compared with petrol sisters. Range-oriented versions need 70–85 kWh packs, raising sticker prices beyond reach for many emerging-market buyers. Commodity volatility, especially lithium and nickel, adds planning risk. Cost reductions below USD 100/kWh expected by 2027 via solid-state cells would narrow this gap and accelerate adoption.
Stricter CO₂ Regulations Raising Compliance Costs
The European Union mandates fleet averages below 81 g/km by 2030, with penalties of EUR 95 per g/km over-target. California’s Advanced Clean Cars II adopts similar stringency. Compliance forces OEMs to boost electrified mix, invest in hybrid and BEV platforms, and sometimes buy regulatory credits. Smaller brands with limited scale face a disproportionate burden, prompting alliance discussions such as Honda-Nissan and GM-Hyundai tie-ups aimed at sharing R&D expenses.
*Our forecasts treat driver/restraint impacts as directional, not additive. The impact forecasts reflect baseline growth, mix effects, and variable interactions.
Segment Analysis
By Drive Type: AWD Uptake Outpaces FWD Base
Front-wheel drive retained 43.47% of the crossover vehicles market share in 2024 due to lower cost and higher fuel efficiency. All-wheel drive grew at a 5.15% CAGR, benefiting from advanced torque-vectoring and driveshaft disconnect systems that cut parasitic losses. Midsize family buyers in snowy regions pay premiums for AWD’s safety perception, while regulatory incentives in Canada and Northern Europe encourage adoption. Rear-wheel drive remains niche, focused on premium performance trims that value towing stability. Continued software improvements will allow AWD to provide selectable modes that disengage secondary axles, preserving the economy without sacrificing capability.
The AWD segment accounted for one-third of the crossover vehicles market size in 2024 and is projected to grow exponentially by 2030, reflecting rising consumer acceptance of electronically managed traction aids. Fleet managers voice interest in AWD hybrids for all-weather reliability, suggesting further share gains.


By Fuel Type: BEV Acceleration Amid Petrol Leadership
Petrol powertrains held 48.73% of the crossover vehicles market share in 2024, due to universal refuelling infrastructure and lower acquisition costs. Battery-electric crossovers, however, logged the fastest 5.24% CAGR as charge networks matured and government incentives remained in force. Hybrids serve as bridge technology, with Ford pledging hybrid options on every North American crossover by 2030. Diesel presence continues to decline, constrained by urban access restrictions and tightening NOx limits. Extended-range EVs plan to combine batteries and micro gas turbines; Hyundai’s concept, scheduled for 2027, targets a 600-mile combined range.
Battery production scale and chemistry evolution will remain decisive. When the pack cost drops below USD 100/kWh, analysts expect BEVS' crossover vehicle market share to exceed one-fourth by 2030, reducing lifecycle emissions and enhancing OEM compliance positions.
By Vehicle Size: Compact Growth Surpasses Mid-Size Base
Mid-size models commanded 46.17% of the crossover vehicles market share in 2024, balancing cabin room, fuel use, and sticker price for families. Small crossovers advanced at a 5.27% CAGR, driven by rising urbanisation and the need for easy parking without forfeiting SUV seating height. Packaging efficiency improvements offer near-midsize interior volume inside footprints under 4.4 meters, bolstering appeal. Large three-row crossovers stay niche outside North America and the Gulf states because higher curb weight strains emissions targets and complicates city manoeuvring.
Small units are forecast to reach one-third of the crossover vehicles market size by 2030 as city populations swell and micro-mobility integration reduces the need for excess cargo capacity. OEMs respond with modular platforms that let compact models share infotainment, safety, and driver-assist suites with larger siblings, lowering perceived compromise.
By Transmission Type: Automatic Prevails in Efficiency Race
Automatic gearboxes captured 73.41% of the crossover vehicle market share in 2024 and continue to post a 5.17% CAGR. Modern 8 to 10-speed units plus sophisticated shift logic often outperform manuals in real-world consumption. Manual demand persists in cost-sensitive regions, yet component economies of scale favour automatics, narrowing price gaps. Electric crossovers pivot to single-speed reduction gears, removing multi-ratio boxes but preserving the automatic user experience. Continually variable transmissions address small-engine hybrids; acceptance remains mixed due to “rubber-band” feel concerns.
Given urban traffic congestion and growing female driver participation, the automatic comfort advantage will likely push its share toward four-fifths by 2030, reinforcing a long-term market shift away from manual shifters.
By Application: Fleet Demand Climbs Alongside Personal Dominance
Personal ownership still contributes 83.14% of the crossover vehicles market share in 2024. Yet fleet and subscription programs represent the fastest growth at 5.18% CAGR as ride-hailing, corporate mobility, and car-as-a-service models expand. Crossovers meet varied passenger and luggage needs and offer favourable residual values, making them natural fleet stalwarts. Electrified drivetrains enhance whole-life economics when vehicles average high annual mileage and return to central depots for charging. Commercial uses, airport shuttles, and light-duty delivery retain a small footprint but benefit from sliding cargo floors and configurable rear seats.
The crossover vehicles market size tied to fleets may grow exponentially by 2030, aided by flexible subscription contracts that allow customers to swap vehicles seasonally or upgrade to larger trims without long financing obligations.
Geography Analysis
Asia–Pacific posted 38.23% of the crossover vehicles market share in 2024, anchored by China’s strong domestic demand and export surge. Chinese crossover exports grew exponentially, undercutting Western equivalents by roughly half while bundling advanced driver-assist features. India added volume as households upgraded from hatchbacks. Japanese and Korean OEMs supply hybrid expertise, keeping brand loyalty high in mature buyer segments. Regional policy supports battery production, with China’s CATL and BYD building 150 GWh of new capacity slated to come online by 2027.
The Middle East and Africa registered the top 5.21% CAGR due to rising incomes, younger demographics, and expanding paved road networks. Saudi buyers gravitate toward crossovers, leveraging government energy diversification programs that moderate fuel subsidies. South Africa’s auto assembly incentives draw global OEM CKD operations, generating localised supply and price competitiveness. In the UAE, premium imports benefit from zero corporate tax on free-zone-based distributors.
North America displays mature penetration. Electrification momentum accelerates as the Inflation Reduction Act links point-of-sale tax credits to battery sourcing thresholds, stimulating domestic supply chains. Europe, meanwhile, faces significant CO₂ compliance pressure. Fleet CO₂ rules drop to 81 g/km by 2030, forcing OEMs to allocate more electrified volume, especially plug-in hybrids, given Europe’s dense apartment housing that constrains overnight charging.
Regional dynamics reinforce a multipolar growth picture: APAC volume and MEA momentum balance mature markets’ product-mix upgrades and electrification costs, stabilising the global crossover vehicles market over the forecast horizon.

Competitive Landscape
Market concentration remains moderate. The top five groups include Toyota, Volkswagen Group, Hyundai Motor, Stellantis, and General Motors, which held roughly three-fifths of 2024 global crossover deliveries, giving the industry a 7 on a 10-point concentration scale. Toyota leverages TNGA-C and TNGA-K platforms to cover compact through large segments with hybrid leadership. Volkswagen Group scales MEB architecture, expanding ID.4 and ID.5 production to three continents. Hyundai Motor Group deploys E-GMP for BEV rollouts, emphasising over-the-air updates to improve customer retention.
Chinese challengers proliferate. BYD controls battery supply in-house and exports SongPLUS DM and Atto 3 models to 40 markets. Chery and Geely target Latin America, Africa, and parts of Europe with aggressive volume goals. Competitive pricing, integrated vertical supply chains, and strong domestic policy support open export lanes, pressuring legacy rivals’ profitability. Strategic consolidation efforts illustrate the need for scale in electrification. Honda and Nissan confirmed discussions in December 2024 to pool development budgets and secure battery supply, aiming to rank third globally in unit sales once merged. GM and Hyundai formed a September 2024 partnership covering joint propulsion development, hydrogen R&D, and shared semiconductor sourcing. Such alliances help amortise massive software and battery investments across broader volume bases.
Success factors evolve toward software and ecosystem services. Over-the-air upgrades, subscription-based features, and integrated charging apps become critical differentiators beyond traditional powertrain and chassis benchmarks. Suppliers also consolidate; LG Energy Solution and CATL lead cell supply, while Bosch and ZF curate standardised ADAS stacks that OEMs can white-label, accelerating feature roll-out across multiple brands.
Crossover Vehicles Industry Leaders
Toyota Motor Corporation
Volkswagen Group
Hyundai Motor Group
Ford Motor Company
General Motors
- *Disclaimer: Major Players sorted in no particular order

Recent Industry Developments
- September 2025: BMW confirmed series production of the iX5 Hydrogen crossover for 2028, advancing fuel-cell alternatives for premium applications.
- December 2024: Honda and Nissan announced merger talks to combine scale, battery procurement, and software development and to challenge Chinese manufacturers’ rising global footprint.
- September 2024: General Motors and Hyundai agreed on a strategic partnership covering joint vehicle platforms, clean-energy R&D, and semiconductor supply chain optimization, focusing on crossover portfolios.


Global Crossover Vehicles Market Report Scope
| Front-Wheel Drive (FWD) |
| Rear-Wheel Drive (RWD) |
| All-Wheel Drive (AWD) |
| Petrol |
| Diesel |
| Hybrid |
| Battery Electric Vehicle (BEV) |
| Small-Size Crossovers |
| Mid-Size Crossovers |
| Large-Size Crossovers |
| Manual Transmission |
| Automatic Transmission |
| Personal Use |
| Commercial Use |
| Fleet Operations |
| North America | United States |
| Canada | |
| Rest of North America | |
| South America | Brazil |
| Argentina | |
| Rest of South America | |
| Europe | United Kingdom |
| Germany | |
| Spain | |
| Italy | |
| France | |
| Russia | |
| Rest of Europe | |
| Asia Pacific | India |
| China | |
| Japan | |
| South Korea | |
| Rest of Asia Pacific | |
| Middle East and Africa | United Arab Emirates |
| Saudi Arabia | |
| Turkey | |
| Egypt | |
| South Africa | |
| Rest of Middle East and Africa |
| By Drive Type | Front-Wheel Drive (FWD) | |
| Rear-Wheel Drive (RWD) | ||
| All-Wheel Drive (AWD) | ||
| By Fuel Type | Petrol | |
| Diesel | ||
| Hybrid | ||
| Battery Electric Vehicle (BEV) | ||
| By Vehicle Size | Small-Size Crossovers | |
| Mid-Size Crossovers | ||
| Large-Size Crossovers | ||
| By Transmission Type | Manual Transmission | |
| Automatic Transmission | ||
| By Application | Personal Use | |
| Commercial Use | ||
| Fleet Operations | ||
| By Geography | North America | United States |
| Canada | ||
| Rest of North America | ||
| South America | Brazil | |
| Argentina | ||
| Rest of South America | ||
| Europe | United Kingdom | |
| Germany | ||
| Spain | ||
| Italy | ||
| France | ||
| Russia | ||
| Rest of Europe | ||
| Asia Pacific | India | |
| China | ||
| Japan | ||
| South Korea | ||
| Rest of Asia Pacific | ||
| Middle East and Africa | United Arab Emirates | |
| Saudi Arabia | ||
| Turkey | ||
| Egypt | ||
| South Africa | ||
| Rest of Middle East and Africa | ||


Key Questions Answered in the Report
What is the current value of the crossover vehicles market?
The crossover vehicles market size stood at USD 0.74 trillion in 2025 and is forecast to reach USD 0.95 trillion by 2030.
Which vehicle size segment is growing fastest?
Small crossovers will deliver the highest 5.27% CAGR between 2025 and 2030 as urban customers seek manoeuvrable models that preserve SUV versatility.
How quickly are battery-electric crossovers expanding?
Battery-electric crossovers post a 5.24% CAGR, the fastest rate among fuel types, supported by improving battery costs and charging infrastructure.
Which region leads demand for crossovers?
Asia–Pacific held the largest share, 38.23% of 2024 revenue, driven by strong Chinese and Indian consumption.
What challenges limit electric crossover adoption?
High battery pack costs, averaging USD 139/kWh in 2024, raise vehicle prices by USD 8,000–12,000 over petrol counterparts, restraining uptake until costs fall below USD 100/kWh, which is expected by 2027.
How concentrated is competition among crossover makers?
The market earns a 7/10 concentration score because the top five automakers jointly captured about 58% of 2024 global crossover sales.
Page last updated on:


