CNG Vehicles Market Size and Share
Market Overview
| Study Period | 2019 - 2030 |
|---|---|
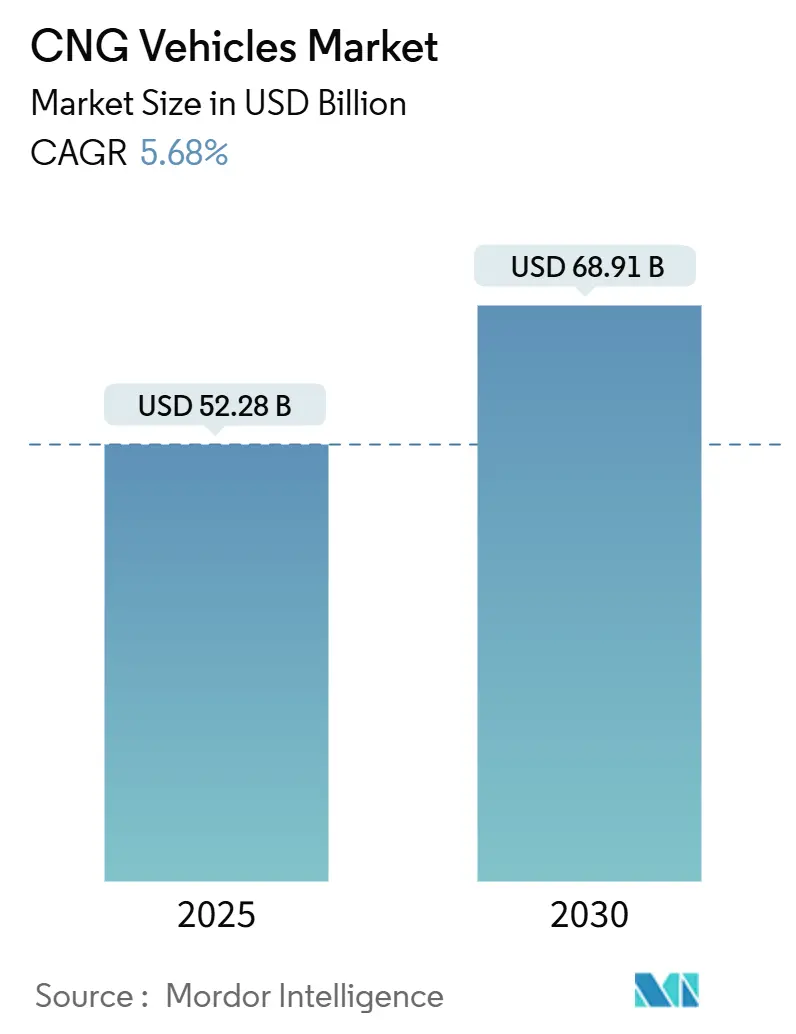
| Market Size (2025) | USD 52.28 Billion |
| Market Size (2030) | USD 68.91 Billion |
| Growth Rate (2025 - 2030) | 5.68% CAGR |
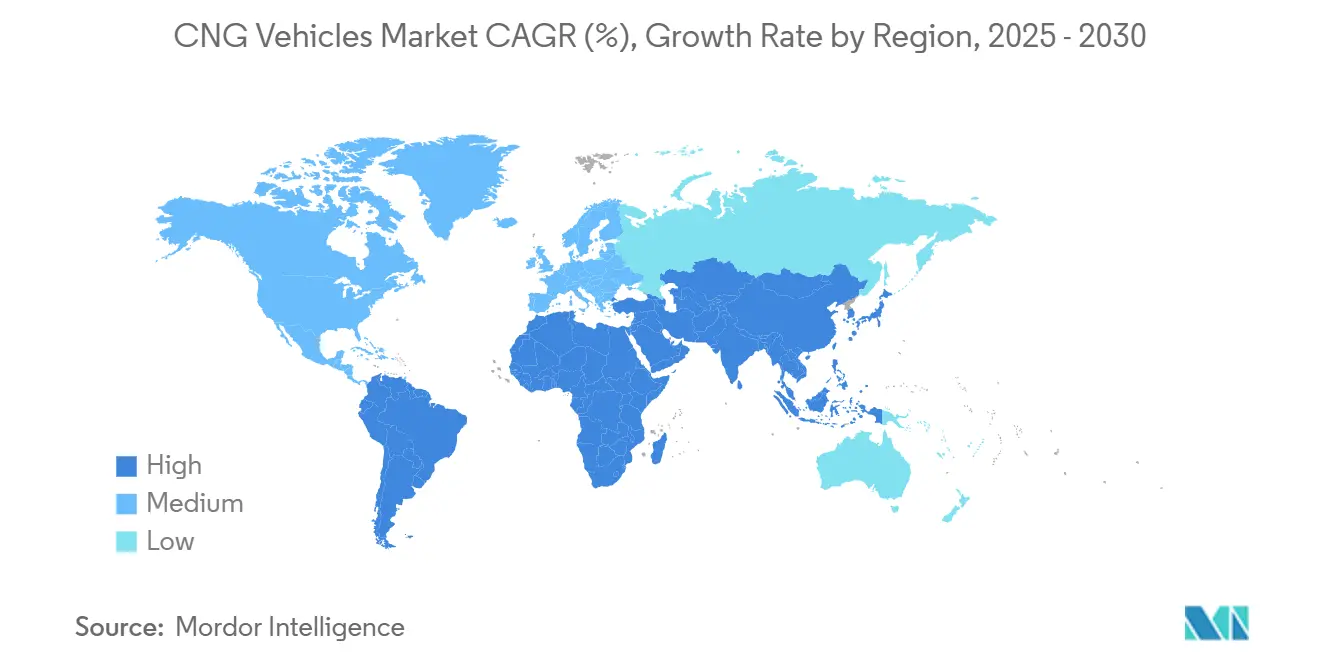
| Fastest Growing Market | Middle East and Africa |
| Largest Market | Asia Pacific |
| Market Concentration | Medium |
Major Players *Disclaimer: Major Players sorted in no particular order Image © Mordor Intelligence. Reuse requires attribution under CC BY 4.0. | |
CNG Vehicles Market Analysis by Mordor Intelligence
The CNG vehicle market size stands at USD 52.28 billion in 2025 and is forecast to reach USD 68.91 billion by 2030, translating into a 5.68% CAGR during the forecast period (2025-2030). Robust policy support, widening fuel-price differentials versus gasoline and diesel, and growing availability of factory-fitted models anchor the near-term growth outlook. Weight-saving composite cylinders, hydrogen-ready engines, and biomethane blending programs broaden the technology’s long-term relevance, allowing fleets to hedge against future fuel-policy shifts. Private logistics operators, public-transport agencies, and ride-hailing aggregators create critical mass for station roll-outs, while OEM warranty extensions reduce perceived residual-value risk. Commercial operators increasingly leverage real-time telematics to quantify maintenance savings, accelerating data-driven adoption decisions.
Key Report Takeaways
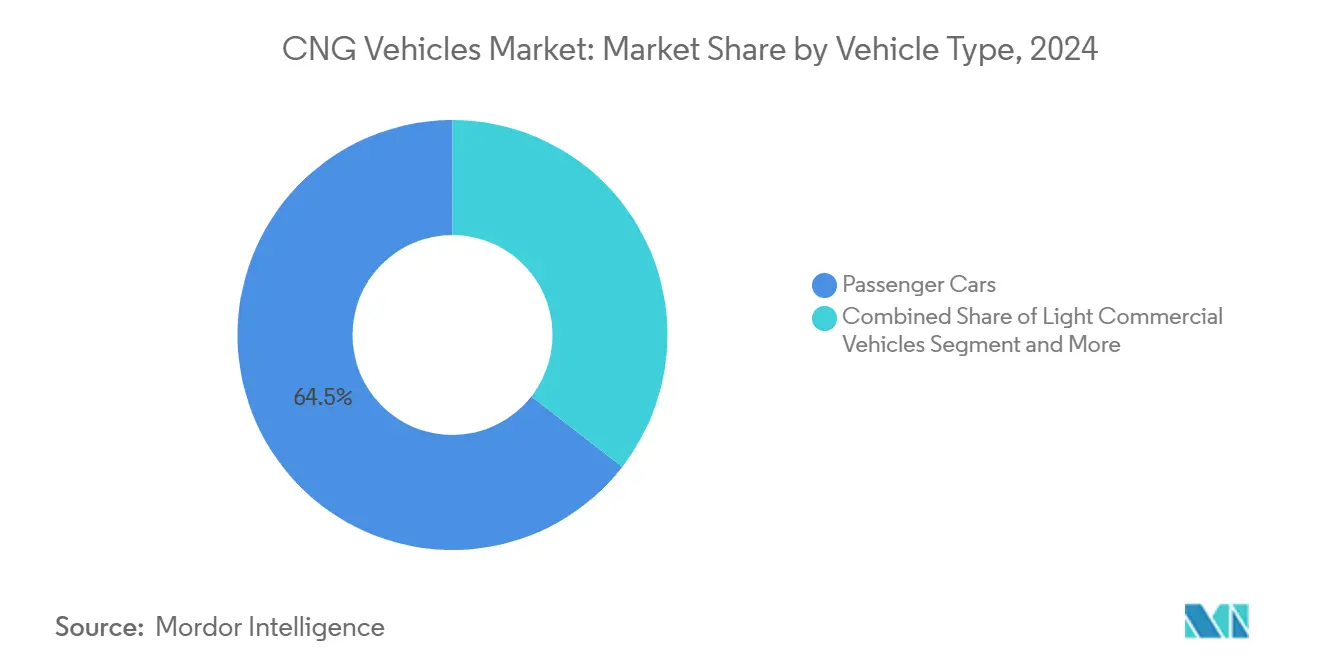
- By vehicle type, passenger cars led with a 64.48% share in the CNG vehicle market in 2024, while buses & coaches are projected to expand at a 9.14% CAGR during the forecast period (2025-2030).
- By sales channel, OEM-fitted models captured 75.74% share in the CNG vehicle market in 2024; retrofitted vehicles are set to grow at an 8.21% CAGR during the forecast period (2025-2030).
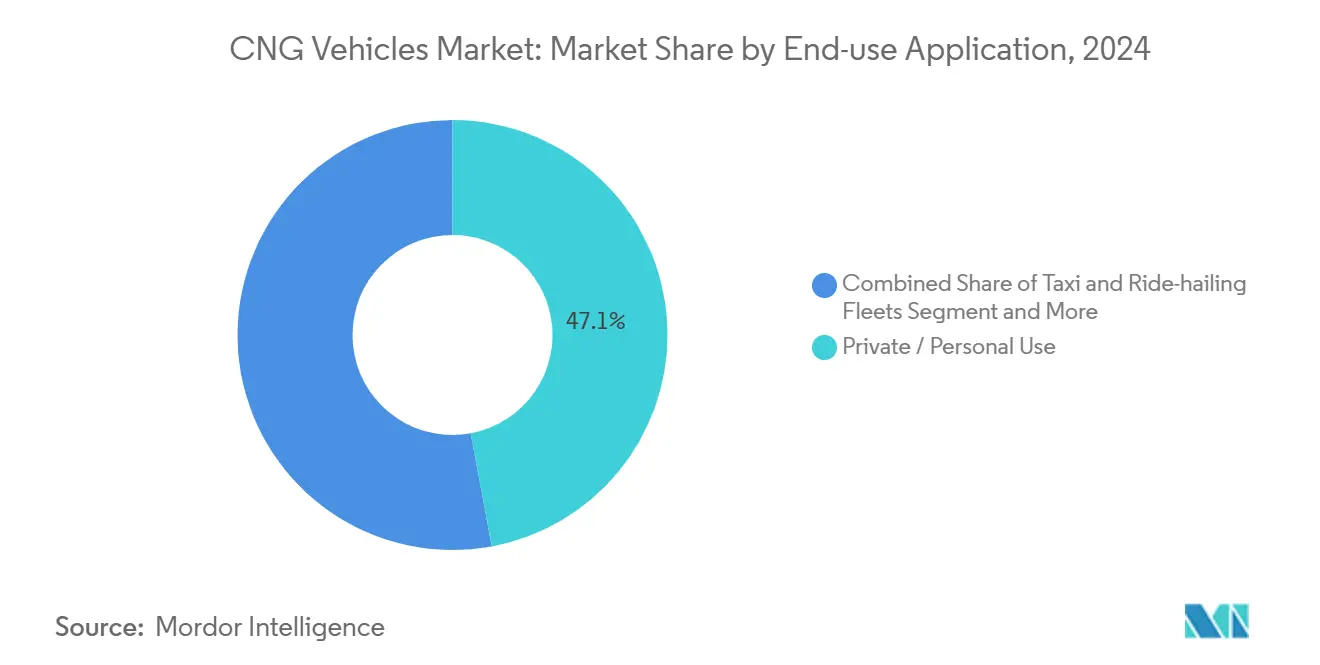
- By end-use application, private use accounted for a 47.08% share in the CNG vehicle market in 2024, whereas public transit fleets are poised for a 9.37% CAGR during the forecast period (2025-2030).
- By cylinder type, Type I held the largest 38.89% share in the CNG vehicle market in 2024. However, Type IV will register the fastest 11.62% CAGR during the forecast period (2025-2030).
- By geography, Asia-Pacific commanded a 55.27% share in the CNG vehicle market in 2024, while the Middle East and Africa region is expected to post the highest 7.28% CAGR during the forecast period (2025-2030).
Global CNG Vehicles Market Trends and Insights
Drivers Impact Analysis*
| Driver | (~) % Impact on CAGR Forecast | Geographic Relevance | Impact Timeline |
|---|---|---|---|
| Lower Total Cost-of-Ownership | +1.8% | Global, with strongest impact in APAC and MEA | Medium term (2-4 years) |
| Tail-Pipe Emission Regulations | +1.5% | Europe, North America, India | Short term (≤ 2 years) |
| CNG Refueling Infrastructure | +1.2% | Global, concentrated in urban corridors | Long term (≥ 4 years) |
| Bio-CNG Blending Targets | +0.9% | Europe, California, early adoption in APAC | Medium term (2-4 years) |
| Fleet-Wide Telematics | +0.8% | North America, Europe, urban APAC | Short term (≤ 2 years) |
| Hydrogen-Ready CNG Engine | +0.6% | Europe, Japan, pilot programs globally | Long term (≥ 4 years) |
| Source: Mordor Intelligence | |||
Lower Total Cost-of-Ownership Versus Gasoline & Diesel
Fleet economics tilt decisively toward CNG as pump-price spreads widen and predictive-maintenance analytics validate engine-longevity gains. Operators report fuel bills 30-40% below diesel and power-train life extensions of 15-25%, benefits that compound in high-utilization duty cycles such as parcel delivery and urban bus services. Real-time telematics platforms surface granular cost-per-mile data, allowing fleet managers to benchmark fuel strategies in ways that traditional spreadsheets never enabled. These verified savings resonate with finance teams tasked with shaving single-digit percentage points from operating budgets. As a result, procurement policies increasingly embed CNG adoption triggers tied to predefined fuel-spread thresholds, institutionalizing future demand.
Stringent Tail-Pipe Emission Regulations
New European and North American standards set lower NOx and particulate caps that light- and heavy-duty diesel engines struggle to meet without costly after-treatment. CNG power-trains already comply with many of these thresholds, giving fleet operators an off-the-shelf compliance pathway. India’s BS VI switch provided a live case study; CNG registrations there surged 40% within 18 months of enforcement. Similar compliance deadlines loom for U.S. Class-8 trucks under EPA Phase 3 rules, driving pre-buy activity and incentivizing OEMs to broaden their CNG catalog. The result is a policy-induced demand wave that lands earlier than mainstream electrification timelines.
Expanding CNG Refueling Infrastructure and OEM-Backed Warranty
Global station counts continue to rise, aided by joint ventures between fuel retailers and automakers. More than 700 public CNG sites operate in the United States alone, a network density that now covers all major interstate freight corridors[1]U.S. Department of Energy, “Alternative Fuels Data Center — Natural Gas Vehicle Fueling Stations,” DOE, afdc.energy.gov. OEMs reinforce confidence by matching gasoline power-train warranties on CNG variants, reducing residual-value uncertainty for fleet financiers. Station developers exploit modular skid designs that cut civil-work costs and shorten permitting cycles, while mobile refuelers address low-volume depots. Together, these moves shrink the classic chicken-and-egg dilemma, unlocking adoption in second-tier cities and suburban logistics hubs.
Renewable Natural Gas Blending Targets in the EU and California
Mandated biomethane percentages turn CNG vehicles into near-zero-carbon assets, upending earlier critiques that they are mere bridging technologies. California’s Low Carbon Fuel Standard credits drop operating costs further by generating tradable compliance certificates, while EU directives assure demand stability for biomethane producers. Vehicle OEMs bundle bio-CNG availability into total-cost-of-ownership calculators, pitching fleets a road-map that aligns with 2030-plus corporate net-zero pledges. This policy-driven decarbonization narrative repositions the CNG vehicle market as a permanent pillar within diversified fleet strategies rather than a sunset technology.
Restraints Impact Analysis*
| Restraint | (~) % Impact on CAGR Forecast | Geographic Relevance | Impact Timeline |
|---|---|---|---|
| Sparse Rural Station Density | -0.7% | Global, particularly acute in North America and Australia | Long term (≥ 4 years) |
| Falling Battery-Electric TCO | -0.9% | Europe, China, urban North America | Medium term (2-4 years) |
| Methane-Slip Compliance Risk | -0.5% | United States, with spillover to export markets | Short term (≤ 2 years) |
| Volatile LNG/CNG Pricing | -1.1% | Global, most severe in import-dependent regions | Short term (≤ 2 years) |
| Source: Mordor Intelligence | |||
Sparse Rural Station Density Outside Top 50 Metro Areas
Station build-outs remain urban-centric because average throughput in rural markets struggles to justify capital outlays per site. Fleets serving wide-area routes therefore weigh range-anxiety costs against potential fuel savings, often delaying CNG conversion. Public-private grants help but rarely cover more than 20-30% of project expense, leaving the business case fragile. Portable compression units and on-vehicle storage optimizations partially bridge the gap but cannot fully replicate a dense fixed network. The result is a geographic adoption divide that mutes national growth potential.
Rapidly Falling Battery-Electric TCO in Light-Duty Segment
Lithium-ion pack prices continue to decline, narrowing CNG’s fuel-cost edge in passenger cars and last-mile vans. Urban charging density accelerates this trend in European and Chinese megacities, prompting ride-hailing fleets to leapfrog directly to electric. CNG therefore risks being typecast as a stop-gap for high-utilization or payload-critical niches, raising investor questions about asset depreciation horizons. OEMs hedge by launching dual-fuel or hydrogen-ready SKUs, signaling uncertainty over mid-2030s power-train splits.
*Our forecasts treat driver/restraint impacts as directional, not additive. The impact forecasts reflect baseline growth, mix effects, and variable interactions.
Segment Analysis
By Vehicle Type: Passenger Cars Maintain Scale as Buses Outpace Growth
Passenger cars commanded a 64.48% share in the CNG vehicle market in 2024, securing the segment’s primacy in unit terms. Yet growth momentum is tilting toward commercial formats. Buses and coaches emerge as the fastest-growing vehicle type at 9.14% CAGR through 2030, driven by public transit authorities' immediate need for emission reductions without the operational complexity of full electrification. Trucks retain an edge on long-haul corridors that lack high-power charging, while two- and three-wheelers flourish in South Asia’s fuel-price-sensitive economies.
Light commercial vehicles represent a strategic middle ground, benefiting from CNG's proven reliability in urban delivery applications where battery range limitations create operational constraints. The CNG vehicle market size attributable to buses is forecast to almost double by 2030 as public spending unlocks fleet procurement cycles. Technology road maps now factor hydrogen-ready upfits, allowing agencies to amortize chassis over multi-fuel lifetimes. Meanwhile, OEMs offer passenger-car bi-fuel variants at minimal price premiums, sustaining base-volume demand even as battery-electric cars gain share in wealthier metros.


By Sales Channel: Factory-Fitted Dominance with Retrofit Upside
OEM integration captured a 75.74% share in the CNG vehicle market in 2024, reflecting fleet and consumer preference for power-trains engineered end-to-end at the factory. Factory-fitted models also simplify warranty administration, giving financiers clearer residual-value projections that support lower lease rates. Automakers, in turn, gain predictable demand for injectors, cylinders, and control units, enabling volume contracts that compress component costs. Marketing messages emphasize hassle-free servicing at authorized workshops, positioning factory CNG as a plug-and-play alternative to gasoline. All told, this channel sets a high-quality bar that shapes buyer expectations across the industry.
Retrofitted fleets, however, are slated for an 8.21% CAGR because conversion kits extend asset life while meeting tightening emission rules. Programs that certify dealer-installed equipment and three-year engine warranties reduce reliability fears that once hampered aftermarket growth. Standardized installation protocols cut downtime, letting small operators convert vehicles during routine maintenance windows instead of lengthy shop stays. Geographic rollout follows station density, with first-wave availability in states that boast robust CNG corridors before national expansion. As a result, retrofitting evolves from a niche workaround into a complementary growth pillar that taps the existing vehicle parc.
By End-Use Application: Public Transit Leads Growth Curve
Private use represented a 47.08% share in the CNG vehicle market in 2024, driven by bi-fuel subcompact cars that lower daily commuting bills for price-sensitive households. However, personal adoption momentum is moderating in cities where electric-vehicle incentives and charging coverage improve rapidly. Public transit agencies are projected to post a 9.37% CAGR during the forecast period (2025-2030) because they procure in bulk, operate fixed routes, and can amortize depot compressors over large mileages. Taxi and ride-hailing fleets straddle the two extremes, exploiting high utilization and urban station proximity to realize fuel savings within short payback periods. Overall, application choices increasingly mirror infrastructure maturity and regulatory pressure rather than passenger comfort alone.
CNG vehicle market size for industrial fleets scales with on-site gas availability at ports, mining hubs, and logistics parks that can host private refueling. Circle K and QuikTrip partnerships underscore how retail fuel brands pivot toward fleet accounts, bundling fuel supply with loyalty analytics that track cost per kilometer. Municipal sanitation and utility trucks adopt CNG when city councils bake greenhouse-gas targets into procurement criteria, ensuring steady demand independent of consumer sentiment. Aggregated telematics data validates maintenance reductions, turning anecdotal benefits into board-level KPIs. These quantified outcomes close the feedback loop that sustains multi-segment adoption.
By Cylinder Type: Composites Unlock Payload Economics
Type I all-metal cylinders held a dominant 38.89% share in the CNG vehicle market in 2024, because of their low entry cost and mechanical robustness in harsh duty cycles. Fleet managers appreciate the straightforward inspection routines and well-understood failure modes associated with steel tanks. Type IV is projected to post an 11.62% CAGR during the forecast period (2025-2030). This is attributed to rising freight rates, which push operators to chase every kilogram of payload, spotlighting Type IV polymer-liner composites that shed significant weight. Weight savings translate directly into added cargo or longer driving range, benefits that resonate in parcel, grocery, and bulk-liquid haulage. The shifting cost-benefit calculus sets the stage for accelerated composite penetration over the next five years.
Advanced material science now embeds micro-sensors inside composite walls, delivering real-time pressure and temperature diagnostics to fleet dashboards. Hexagon Composites’ fourth-generation designs illustrate how these data streams integrate with preventive-maintenance software, lowering unplanned downtime and insurance premiums. Manufacturing scale is narrowing the price gap with steel, and some high-volume contracts project parity in the coming years. Regulatory bodies update homologation standards to include digital health monitoring, nudging procurement teams toward smarter cylinders. Consequently, future competition will pivot from raw material cost to embedded intelligence and service ecosystems.
Geography Analysis
Asia-Pacific dominates the landscape, accounting for 55.27% of 2024 revenues. India’s integrated policy mix, covering vehicle incentives, station grants, and clear regulatory timelines, has turned CNG corridors into default choices for intercity buses and ride-share sedans. China prioritizes CNG for commercial fleets in inland provinces where battery charging remains cost-prohibitive, while Japan positions hydrogen-ready CNG drivelines as hedges against future fuel shifts. Regional OEM supply chains, from injectors to cylinders, localize cost structures, accelerating diffusion beyond tier-one cities.
The Middle East & Africa region posts the world’s quickest pace at 7.28% CAGR as gas-rich nations deploy CNG to curb gasoline imports and monetize domestic reserves. Nigeria’s Presidential CNG Initiative bundles concessional loans with tax relief, catalyzing bus-fleet conversions. The UAE leverages existing LNG infrastructure to create multi-fuel service hubs covering natural gas, hydrogen, and EV charging, positioning its logistics corridors as future-proof. Nonetheless, rural penetration remains sparse, requiring mobile-refueler solutions to unlock last-mile adoption.
Europe and North America display mature yet resilient trajectories. Stringent emission caps combined with biomethane mandates elevate CNG’s climate credentials even as fleet electrification gains mind-share. In the United States, 700-plus public stations now service coast-to-coast freight lanes, and EPA Phase 3 rules elevate compliance urgency for diesel fleets[2]U.S. Environmental Protection Agency, “Final Rule: Greenhouse Gas Emissions Standards for Heavy-Duty Vehicles,” EPA, epa.gov. European truck OEMs collaborate with fuel-system specialists to embed high-pressure direct-injection (HPDI) strategies that slash methane slip while preserving diesel-like torque curves, a development underscored by Volvo Group’s alliance with Westport[3]“Volvo Group and Westport Celebrate Transformative Partnership,” Westport Fuel Systems, wfsinc.com.

Competitive Landscape
The global arena is moderately fragmented: Suzuki, Hyundai, Stellantis, Tata Motors, and several Chinese OEMs share leadership. This structure prevents any single player from dictating pricing or technology road maps, fostering healthy innovation across power-train and storage subsystems. Regional specialists exploit this openness to carve defensible niches, especially in lightweight cylinders, high-pressure injectors, and turnkey station packages. Capital requirements remain manageable for component makers, enabling rapid entry of start-ups that focus on hydrogen-ready conversions and telematics add-ons. The net result is a competitive equilibrium that rewards agility over sheer production scale.
Strategic partnerships define differentiation. Westport and Volvo’s joint venture on HPDI exemplifies how component innovators leverage OEM scale to accelerate commercialization. Cylinder suppliers such as Hexagon Composites bundle lightweight tanks with telematics gateways, shifting competition from hardware to data analytics. Meanwhile, energy companies cross-invest in station networks, aligning downstream fuel sales with upstream vehicle demand. These alliances compress development timelines and spread risk across the value chain, ensuring that even mid-tier brands can launch globally compliant CNG models.
Regional policy asymmetry creates divergent go-to-market tactics. In India, Suzuki and Tata emphasize price-sensitive passenger cars; in Europe, Iveco and Daimler Truck concentrate on long-haul and municipal fleets where biomethane can unlock near-zero carbon claims. Chinese brands harness domestic industrial policy to export complete CNG buses to Africa and Latin America, intensifying price competitiveness. As hydrogen-ready engines mature, leading OEMs hedge by engineering modular power-train bays that accept multiple gaseous fuels, preserving asset values into the 2030s. This convergent design philosophy blurs traditional segment boundaries and elevates software integration as a future battleground.
CNG Vehicles Industry Leaders
Suzuki Motor Corporation
Hyundai Motor Company
Stellantis N.V.
Tata Motors Limited
Volkswagen AG
- *Disclaimer: Major Players sorted in no particular order

Recent Industry Developments
- September 2025: Maruti Suzuki India introduced the Victoris SUV with ICE, hybrid, and CNG variants, broadening CNG availability in the high-volume compact-SUV segment.
- August 2025: Landi Technologies and American CNG, LLC have forged a groundbreaking strategic alliance. This partnership integrates top-tier engine technology, advanced high-pressure fuel systems, in-house cylinder production, and nationwide installation services. The result is a comprehensive RNG/CNG solution tailored for Original Equipment Manufacturers (OEMs), Fleet Management Companies (FMCs), dealers, and fleets throughout North America.
- June 2025: In collaboration with Astra Vehicle Technologies, Iveco has unveiled the S-Way 500 CNG 6×2 truck. This new model boasts a gross vehicle weight capacity of 44 tonnes and achieves CO2 reductions of up to 95% when stacked against its diesel counterparts. The truck made its grand entrance at the 2025 Road Transport Expo, showcased as a bespoke display model adorned with hand-painted artwork.


Global CNG Vehicles Market Report Scope
| Passenger Cars |
| Light Commercial Vehicles |
| Buses and Coaches |
| Trucks (Medium and Heavy-Duty) |
| Two and Three-Wheelers |
| OEM-fitted |
| Retrofitted / After-market |
| Private / Personal Use |
| Taxi and Ride-hailing Fleets |
| Public Transit Authorities |
| Industrial and Utility Fleets |
| Type I (All-metal) |
| Type II (Metal hoop-wrapped) |
| Type III (Full composite) |
| Type IV (Polymer-liner composite) |
| North America | United States |
| Canada | |
| Rest of North America | |
| South America | Brazil |
| Argentina | |
| Colombia | |
| Rest of South America | |
| Europe | Germany |
| United Kingdom | |
| France | |
| Italy | |
| Spain | |
| Russia | |
| Rest of Europe | |
| Asia-Pacific | China |
| India | |
| Japan | |
| South Korea | |
| Indonesia | |
| Thailand | |
| Rest of Asia-Pacific | |
| Middle East and Africa | Turkey |
| Saudi Arabia | |
| United Arab Emirates | |
| Qatar | |
| South Africa | |
| Nigeria | |
| Egypt | |
| Kenya | |
| Rest of Middle East and Africa |
| By Vehicle Type | Passenger Cars | |
| Light Commercial Vehicles | ||
| Buses and Coaches | ||
| Trucks (Medium and Heavy-Duty) | ||
| Two and Three-Wheelers | ||
| By Sales Channel | OEM-fitted | |
| Retrofitted / After-market | ||
| By End-use Application | Private / Personal Use | |
| Taxi and Ride-hailing Fleets | ||
| Public Transit Authorities | ||
| Industrial and Utility Fleets | ||
| By Cylinder Type | Type I (All-metal) | |
| Type II (Metal hoop-wrapped) | ||
| Type III (Full composite) | ||
| Type IV (Polymer-liner composite) | ||
| By Geography | North America | United States |
| Canada | ||
| Rest of North America | ||
| South America | Brazil | |
| Argentina | ||
| Colombia | ||
| Rest of South America | ||
| Europe | Germany | |
| United Kingdom | ||
| France | ||
| Italy | ||
| Spain | ||
| Russia | ||
| Rest of Europe | ||
| Asia-Pacific | China | |
| India | ||
| Japan | ||
| South Korea | ||
| Indonesia | ||
| Thailand | ||
| Rest of Asia-Pacific | ||
| Middle East and Africa | Turkey | |
| Saudi Arabia | ||
| United Arab Emirates | ||
| Qatar | ||
| South Africa | ||
| Nigeria | ||
| Egypt | ||
| Kenya | ||
| Rest of Middle East and Africa | ||


Key Questions Answered in the Report
How fast is the CNG vehicle market expected to grow through 2030?
It is forecast to expand at a 5.68% CAGR, taking value from USD 52.28 billion in 2025 to USD 68.91 billion by 2030.
Which region currently leads in CNG vehicle adoption?
Asia-Pacific holds 55.27% of 2024 revenue, thanks to India’s and China’s infrastructure and policy support.
What segment is growing the quickest inside the CNG vehicle space?
Buses & coaches register the fastest 9.14% CAGR as transit agencies seek immediate emission cuts.
How does biomethane influence the outlook for CNG vehicles?
EU and California blending mandates turn CNG fleets into near-zero-carbon assets, extending technology relevance beyond a transition role.
What strategic moves are leading companies making?
Partnerships like Westport-Volvo for HPDI engines and Landi Technologies-American CNG for integrated RNG offerings exemplify technology-driven collaboration.
Page last updated on:


