
Corrugated And Paperboard Boxes Market Size and Share
Market Overview
| Study Period | 2020 - 2031 |
|---|---|
| Market Size (2026) | USD 247.45 Billion |
| Market Size (2031) | USD 302.82 Billion |
| Growth Rate (2026 - 2031) | 4.12 % |
| Fastest Growing Market | Middle East and Africa |
| Largest Market | Asia Pacific |
| Market Concentration | Low |
Major Players *Disclaimer: Major Players sorted in no particular order Image © Mordor Intelligence. Reuse requires attribution under CC BY 4.0. | |
Corrugated And Paperboard Boxes Market Analysis by Mordor Intelligence
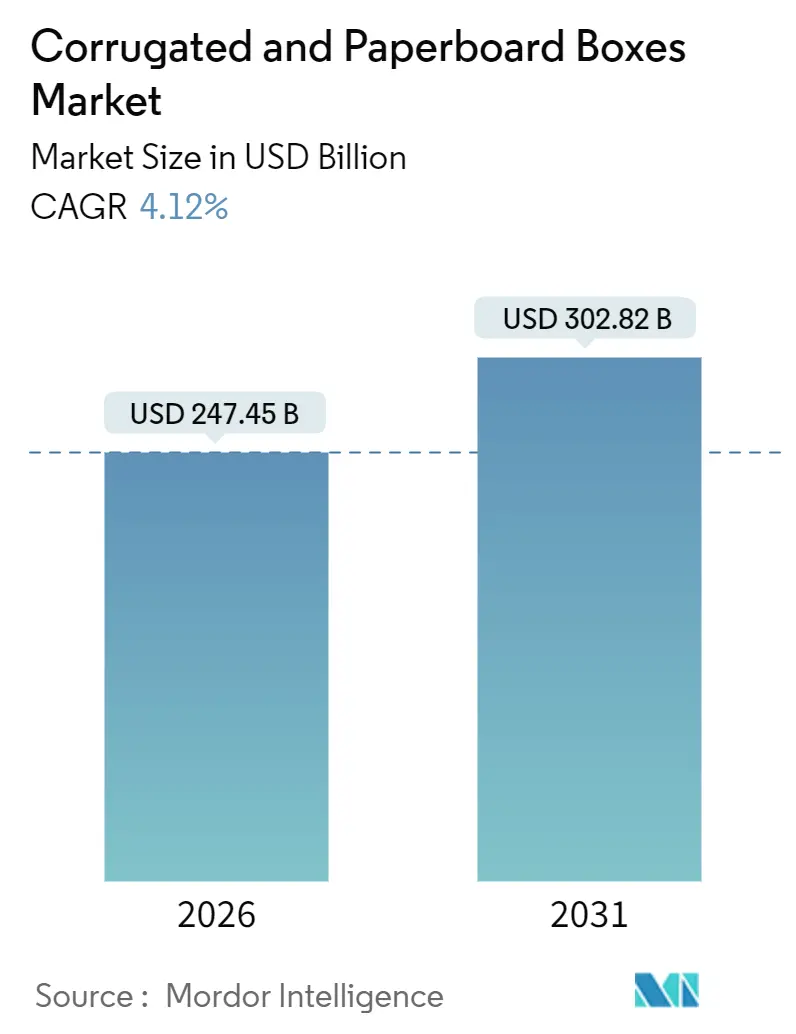
The corrugated and paperboard boxes market size is valued at USD 247.45 billion in 2026 and is projected to reach USD 302.82 billion by 2031, advancing at a 4.12% CAGR over the forecast period. Rising e-commerce parcel volumes, swift regulatory moves away from single-use plastics, and investments that reinforce temperature-controlled supply chains are accelerating the transition from commodity containerboard toward precision-engineered formats that optimize fiber use and graphics quality. Flexographic presses now integrate AI-enabled registration controls that cut set-up waste, while right-sizing software trims corrugate consumption by 8-12%, supporting margin protection amid volatile recovered-paper and energy prices. Consolidation, exemplified by the 2024 Smurfit Kappa–WestRock merger, is reshaping bargaining power across fiber procurement, automation, and digital-printing equipment but leaves space for mid-sized regional converters to specialize in hazmat-certified or insulated solutions. Geographic expansion remains concentrated in Asia-Pacific, yet the Middle East and Africa corridor is emerging as the fastest-growing demand center due to infrastructure projects and a deepening e-commerce footprint.
Key Report Takeaways
- By product type, corrugated and solid fiber boxes led with 53.43% revenue share in 2025, while folding paperboard boxes are forecast to expand at a 5.32% CAGR through 2031.
- By wall construction, single-wall accounted for 60.32% market share in 2025, whereas triple-wall formats are advancing at a 5.74% CAGR through 2031.
- By end-user industry, food and beverage applications accounted for 38.34% of demand in 2025, while durable goods packaging is expected to grow at a 6.32% CAGR through 2031.
- By printing technology, flexographic processes accounted for 58.54% in 2025, and digital presses are projected to post a 6.43% CAGR through 2031.
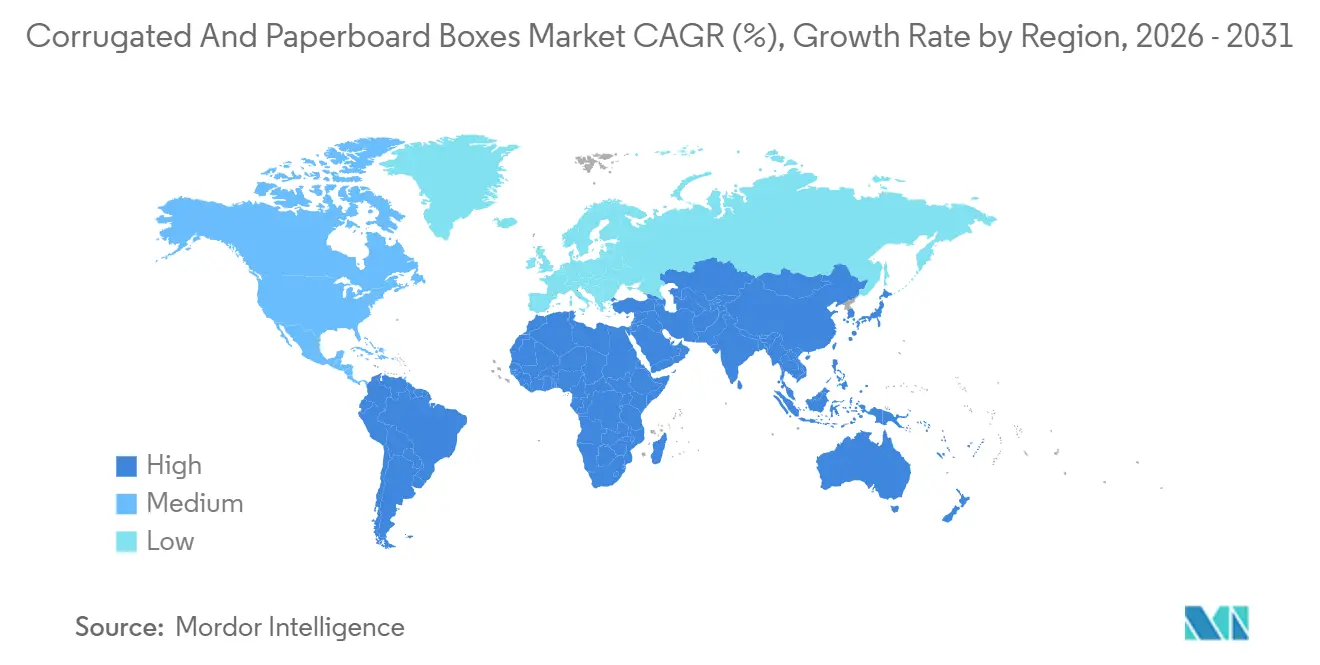
- By geography, Asia-Pacific accounted for 40.31% of market share in 2025, yet the corrugated and paperboard boxes market in the Middle East and Africa is set to expand at a 6.86% CAGR through 2031.
Note: Market size and forecast figures in this report are generated using Mordor Intelligence’s proprietary estimation framework, updated with the latest available data and insights as of January 2026.
Global Corrugated And Paperboard Boxes Market Trends and Insights
Drivers Impact Analysis*
| Driver | (~) % Impact on CAGR Forecast | Geographic Relevance | Impact Timeline |
|---|---|---|---|
| Growth in e-commerce sales | +1.2% | Global with focus on North America, Europe, Asia-Pacific | Medium term (2-4 years) |
| Growing consumer awareness on sustainable paper packaging | +0.9% | Europe and North America, expanding to Asia-Pacific | Long term (≥ 4 years) |
| Surge in retail ready packaging adoption | +0.6% | North America and Europe, urban Asia-Pacific | Medium term (2-4 years) |
| Expansion of cold-chain logistics requiring specialty corrugated boxes | +0.7% | Middle East, Africa, South Asia rising | Medium term (2-4 years) |
| AI-driven box optimization software reducing waste | +0.4% | North America and Europe, pilot Asia-Pacific | Short term (≤ 2 years) |
| Carbon-negative fiber innovations using agro-residue | +0.3% | India, Brazil, Southeast Asia, Africa | Long term (≥ 4 years) |
| Source: Mordor Intelligence | |||
Growth in E-Commerce Sales
Global parcel shipments climbed to 161 billion units in 2025, and corrugated packaging fulfilled 68% of primary shipping requirements, underscoring the structural link between direct-to-consumer fulfillment and the corrugated and paperboard boxes market. Amazon’s AI-powered pack-choice engines trimmed average box volume 11%, cutting 120,000 metric tons of containerboard while safeguarding International Safe Transit Association performance thresholds.[1]International Safe Transit Association, “ISTA 3A Packaged-Product Testing Procedures,” ista.org Alibaba’s Cainiao network deployed modular inserts that lowered secondary packaging by 19% across 2.3 billion parcels, signaling how micro-customization can coexist with mass scale. Same-day or next-day expectations affected 47% of North American orders in 2025, compelling producers such as International Paper to commission micro-converting hubs adjacent to leading fulfillment centers. European regulations that require 30% post-consumer recycled content by 2030 reinforce closed-loop investment in optical sorting capacity.[2]European Union, “Regulation on Packaging and Packaging Waste,” eur-lex.europa.eu
Growing Consumer Awareness on Sustainable Paper Packaging
A 2025 survey covering 18,000 shoppers across 12 nations found 72% favor paper-based over plastic packaging and indicated willingness to pay a 5-8% premium when Forest Stewardship Council or Programme for the Endorsement of Forest Certification logos are present. Mondi’s PerFORMing grade, which incorporates 40% agricultural-residue fiber, meets European food-contact regulations, allowing bakeries to abandon polyethylene-lined boxes while maintaining recyclability. In Colombia, Smurfit WestRock validated carbon-negative linerboard derived from sugarcane bagasse, sequestering 0.3 metric tons of CO₂-equivalent per ton of output, as verified by the Carbon Trust. Regulatory milestones such as California Senate Bill 54 and China’s 85% recovery target by 2028 intensify the incentive to remove mixed-material components and simplify corrugated formats.
Surge in Retail Ready Packaging Adoption
Retail-ready packaging advanced to 22% of North American fast-moving consumer goods volume in 2025, up from 16% in 2023, due to mandates that reduce in-store labor and damage. Packaging Corporation of America introduced perforated designs with built-in dividers that cut shelf-stocking time by 40% for beverages and snacks, with adoption across 1.2 billion units in 2025. European grocers extended retail-ready specifications to chilled aisles, prompting converters to integrate moisture-vapor barriers that function at minus 18 degrees Celsius. Seven-color flexographic presses equipped with inline inspection cameras have become essential for meeting graphics and traceability mandates.
Expansion of Cold-Chain Logistics Requiring Specialty Corrugated Boxes
Global pharmaceutical cold-chain logistics reached USD 21.3 billion in 2025, and corrugated insulated shippers accounted for 41% of that spend. DS Smith’s triple-wall TailorTemp system, validated for 96-hour excursions from minus 10 to plus 43 degrees Celsius, displaced expanded polystyrene in vaccine distribution while reducing weight 35%. Latin American produce exporters deployed ventilated corrugated with chitosan-based antimicrobial coatings that suppressed mold by 47% over 21 days, extending shelf life during ocean freight. Corrugated solutions avoid International Plant Protection Convention heat-treatment costs attached to wooden crates, speeding customs release.
Restraints Impact Analysis*
| Restraint | (~) % Impact on CAGR Forecast | Geographic Relevance | Impact Timeline |
|---|---|---|---|
| Availability of high-performance plastic and rigid substitutes | -0.8% | Global, food and pharma focus | Medium term (2-4 years) |
| Rising operational and energy costs | -0.6% | Europe and North America | Short term (≤ 2 years) |
| Volatility in recovered paper prices | -0.5% | Regions lacking integrated fiber | Medium term (2-4 years) |
| Containerboard mill capacity constraints in emerging regions | -0.4% | Middle East, Africa, South Asia | Long term (≥ 4 years) |
| Source: Mordor Intelligence | |||
Availability of High-Performance Plastic and Rigid Substitutes
Rigid polypropylene crates and multilayer pouches continue to dominate applications where moisture and oxygen barriers below 0.5 cc/m²-day are mandatory, such as frozen entrées and concentrated liquids. Unit-dose medicines adhere to United States Pharmacopeia standards that require water-vapor transmission of less than 0.1 g/100 in²/day, sustaining demand for blister packs and dual-film laminates. Corrugated alternatives would require aluminum-laminate liners that add USD 0.15-0.30 per unit and necessitate lengthy regulatory revalidation, a cost barrier in the short to medium term.[3]U.S. Food and Drug Administration, “Container Closure Systems Guidance,” fda.gov Injection-molded returnable crates achieve 80-120 rotations, compared with 1-3 for corrugated equivalents, providing a lower total cost of ownership for closed-loop supply chains.
Rising Operational and Energy Costs
Natural gas averaged EUR 35/MWh in Europe during 2025, adding EUR 18-25 per ton to containerboard production, while U.S. mills faced gas at USD 2.80-4.20/MMBtu and electricity up 12-18% versus the 2016-2020 mean. Energy now accounts for 16% of International Paper’s manufacturing cost base, motivating biomass boiler retrofits that reduce fossil fuel use by 22% at key mills. Wage inflation averaged 14% between 2023 and 2025, and freight prices added 9% as diesel reached USD 3.85 per gallon, encouraging automation investments of USD 1.2-3.5 million per line with 2.5-4-year paybacks.
*Our forecasts treat driver/restraint impacts as directional, not additive. The impact forecasts reflect baseline growth, mix effects, and variable interactions.
Segment Analysis
By Product Type: Folding Paperboard Gains on Premium Aesthetics
Corrugated and solid fiber boxes delivered 53.43% of 2025 revenue, demonstrating the structural importance of high-strength formats for e-commerce, agriculture, and industrial supply chains in the corrugated and paperboard boxes market. Folding paperboard, however, is forecast to outpace with a 5.32% CAGR through 2031 as cosmetics, electronics, and pharmaceuticals demand lithographic graphics and tactile finishes that elevate shelf presence. Graphic Packaging International’s 24-point solid bleached sulfate carton integrates holographic stamping that removes the need for secondary gift boxes and cuts total material 28% while retaining premium image. Luxury electronics brand adoption showcases folding paperboard’s capacity to balance drop-test requirements and retail aesthetics, a key driver within the corrugated and paperboard boxes market.
Consumer electronics companies confirmed the shift when Apple replaced plastic trays across all iPhone shipments with molded pulp cushions and folding sleeves that meet ISTA 3A criteria, a milestone that resonated across the corrugated and paperboard boxes industry. Samsung followed by adopting soy-based inks and water-based coatings that satisfy European restrictions on phthalates and heavy metals, ensuring recyclability. Rigid boxes, while smaller in volume, maintain a 4.8% CAGR because jewelry, spirits, and watchmakers view unboxing as part of brand storytelling. Specialty containers for UN-regulated hazardous materials remain a consistent niche, leveraging multi-layered paperboard with foil or polymer linings.




By Wall Construction: Triple-Wall Advances on Heavy-Duty Demand
Single-wall designs captured 60.32% of market share in 2025, favored for the balance of cost and 32-44 pounds-per-inch edge-crush ratings, supporting payloads up to 65 pounds in the corrugated and paperboard boxes market. Double-wall products manage heavier items in export channels, yet triple-wall formats will expand at a 5.74% CAGR as exporters of engines, solar modules, and precision machinery chase lighter, International Plant Protection Convention-compliant options. Rengo’s high-performance triple-wall board achieved burst strength above 1,000 psi and allowed engine block shipments up to 1,200 pounds without internal dunnage, reducing packaging spend by 25-35%.
Pratt Industries applied triple-wall solutions to solar-panel logistics, incorporating recycled edge protectors that eliminate expanded polystyrene while meeting IEC 61215 mechanical load standards. Automotive and aerospace supply chains now budget corrugated into early design stages because weight savings translate into freight cost avoidance and easier recycling at destination plants. Triple-wall’s 12-18 mm thickness still limits retail adoption, yet custom slotted styles for large-format e-commerce goods such as treadmills and flat-pack furniture are widening the addressable scope within the corrugated and paperboard boxes market.
By End-User Industry: Durable Goods Accelerates on E-Commerce Shift
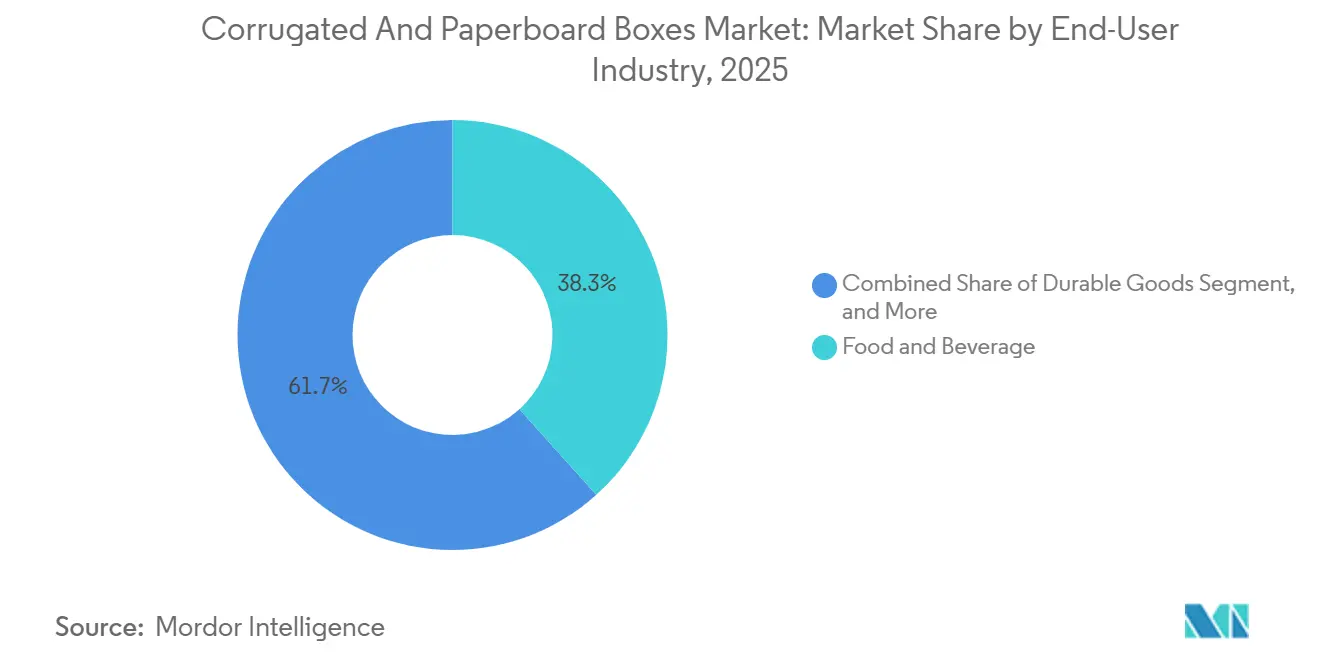
Food and beverage accounted for 38.34% of the market share in 2025, leveraging both wax-alternative hydrophobic coatings and retail-ready formats that simplify shelf replenishment, reinforcing their dominance across the corrugated and paperboard boxes market. Beverage multipacks alone accounted for 18 million metric tons of fiber, with global brands mandating 100% recycled linerboard to meet science-based carbon targets. Fresh-produce exporters cut spoilage 12-16% using boxes with moisture-wicking liners, a direct gain attributable to cold-chain innovations already discussed.
Durable goods shipments are set to expand at a 6.32% CAGR through 2031 because appliance and furniture producers increasingly bypass store networks and deliver to homes. Whirlpool eliminated wooden pallets by adopting flat-pack triple-wall crates that reduce trailer cube by 22%, demonstrating how freight optimization feeds into the market size efficiencies of the corrugated and paperboard boxes market. IKEA’s zero-damage rate below 0.8% across 120 million units in 2025 validated molded pulp inserts that replace plastic bags, supporting brand commitments to mono-material solutions. Chemical shippers retain share through UN-rated corrugated drums for powder, solid, and certain liquid hazmat classes, providing steady baseline volume.
By Printing Technology: Digital Gains on Short-Run Customization
Flexographic presses accounted for 58.54% of market share in 2025, maintaining throughput advantages at 600-800 feet per minute and registration within 0.5 mm, making them indispensable to the largest segments of the corrugated and paperboard boxes market. Automated plate-mounting and changeover modules now render runs of 5,000 boxes economical, squeezing the boundary between flexo and digital. Lithographic offsets accounted for a significant market share, mainly in folding cartons that require 200 lpi resolution and metallic inks.
Digital presses are expected to grow at a 6.43% CAGR through 2031, as brand owners pursue micro-batch production and regional SKU variants without incurring plate costs. HP’s PageWide C500 delivers 1,200 dpi images at 500 fpm, supporting runs as low as 500 units while meeting food-contact ink standards. Mondi’s 2.3 million-unit limited-edition for Heineken confirmed per-unit parity with flexo at below 10,000 units, accelerating adoption across beverage, confectionery, and subscription box categories. Digital’s variable-data capability also embeds QR codes for supply-chain traceability and marketing engagement, increasing its strategic value in the corrugated and paperboard boxes market.
Geography Analysis
Asia-Pacific accounted for 40.31% of market share in 2025, underpinned by China’s 71 million-metric-ton containerboard capacity and India’s 15% surge in e-commerce packaging demand. Nine Dragons Paper brought a 1.2 million-metric-ton mill online in Guangxi during March 2025, emphasizing recovered fiber usage and biomass cogeneration, a template that cuts fossil fuel dependence by 85%. India’s Production-Linked Incentive program financed 2.1 million metric tons of new capacity between 2023 and 2025, accommodating Flipkart and Amazon India’s combined 1.9 billion parcel load. While Japan’s domestic demand slipped 1.8% amid demographic headwinds, its converters exported to Southeast Asia and Oceania to balance capacity utilization.
The corrugated and paperboard boxes market in the Middle East and Africa is projected to grow at a 6.86% CAGR through 2031 as Saudi Arabia’s Vision 2030 allocates USD 4.2 billion for cold-chain assets that require an estimated 420,000 metric tons of corrugated annually. Jumia’s 47 million parcels in 2025 raised African box demand 34% year-over-year, yet regional containerboard capacity remains only 3.1 million metric tons, forcing imports that inflate landed cost 12-18%. Mondi’s Richards Bay modernization adds 180,000 metric tons of recycled linerboard and demonstrates intraregional supply stabilization.
North America delivered 28% of global revenue in 2025, driven by 33 million metric tons of U.S. consumption across e-commerce, food service, and industrial applications. Packaging Corporation of America expanded to 94 plants within 200 miles of 85% of the U.S. population, aligning with just-in-time delivery trends. Mexico’s 11% output growth reflects nearshoring in automotive and electronics, with Klabin serving Tesla, General Motors, and Samsung from Monterrey. Europe’s consumption dipped 2.3% as energy prices weighed on manufacturing activity, yet strict packaging regulations spurred premium recycled grades. South America gained 5.1% in 2025, fueled by Brazil’s commodity exports and Argentina’s rebound, with USD 680 million in ongoing containerboard investments slated for 2026-2027.

Regulatory Landscape
Regulation is increasingly steering corrugated and paperboard boxes toward mono-material, recyclable designs and tighter material documentation. In the European Union, the Packaging and Packaging Waste Regulation, Regulation (EU) 2025/40 (PPWR), entered into force on 11 February 2025 and applies from 12 August 2026, pushing economic operators to maintain declarations of conformity and material composition documentation alongside recyclability and recycled-content related obligations.
In the United States, compliance for food and beverage applications continues to center on the US Food and Drug Administration framework for indirect food additives in paper and paperboard (21 CFR Part 176, including sections such as 21 CFR 176.170 and 21 CFR 176.180), plus FDA policy on color additives for paper and paperboard used with food. This keeps barrier coatings, inks, and additives under scrutiny for food-contact boxes and folding cartons, which can extend qualification timelines when converters change substrates or introduce new coatings.
Value Chain Analysis
The value chain runs from fiber sourcing (virgin pulp, timber, and recovered paper) to containerboard and paperboard manufacturing, then conversion (sheet plants and box plants for corrugated, and carton converting for folding paperboard). It continues through printing and finishing (flexo, litho, and digital) and ends with distribution via brand-owner supply chains, co-packers, and e-commerce fulfillment networks. Because boxes are low density and high volume, transport costs favor regional manufacturing footprints, which raises the role of local converting hubs near demand centers and tightens economical shipping radii for finished packaging.
Integration across mills and converting remains a key operating model, giving players control over furnish, quality, and cost pass-through during recovered-fiber and energy volatility. Regulatory and collection systems also feed directly into the chain, with the EU PPWR (Regulation (EU) 2025/40, applicable from 12 August 2026) strengthening requirements tied to recyclability and documentation, while US state-level extended producer responsibility programs increase emphasis on traceability and recyclability claims. As these pressures build, recovered-fiber procurement networks, sorting capacity, and documentation workflows become more central to day-to-day commercial execution for corrugated and paperboard boxes.
Competitive Landscape
The corrugated and paperboard boxes market is fragmented. The USD 34 billion Smurfit Kappa–WestRock merger created 24 million metric tons of containerboard output and 500 converting plants, prompting International Paper to earmark USD 1.8 billion for automation upgrades and Mondi to acquire six Eastern European plants. Vertical integration into recovered-fiber streams forms a key differentiator; Packaging Corporation of America’s 440,000-acre timber portfolio buffers input volatility, while Nine Dragons Paper secures feedstock through municipal recycling partnerships in 180 Chinese cities.
Strategic emphasis now centers on digital-printing scale, specialty substrates, and AI-enhanced converting. Smurfit WestRock’s 12-press digital hub in Georgia can produce 2.4 billion square feet of personalized packaging each year, offering consumer-goods brands shorter promotional lead times. Pratt Industries leverages machine-learning algorithms that adjust corrugated specifications against real-time damage data, lowering claims by 23% and accelerating win rates in the durable-goods segment. Emerging disruptors include India’s Yash Papers and Brazil’s Fibria Innovations that pilot wheat-straw and sugarcane-bagasse linerboard with net-negative carbon footprints, a compelling narrative for brands under emissions scrutiny.
White-space opportunities persist. Pharmaceutical cold-chain boxes still account for only 41% of that packaging segment, implying room for corrugated insulated formats. E-commerce micro-fulfillment requires converters to promise two-hour replenishment windows that centralized plants cannot achieve, giving local players a logistics edge. Combined, these dynamics confirm that regional specialization remains viable despite the ongoing scale race in the corrugated and paperboard boxes market.
Corrugated And Paperboard Boxes Industry Leaders
International Paper
Graphic Packaging International Inc
Mondi Group
Smurfit WestRock
Oji Holdings Corporation
- *Disclaimer: Major Players sorted in no particular order


Market Opportunities and Future Outlook
Compliance-driven redesign and documentation work creates whitespace in recyclability-by-design, labeling, and proof of material composition, particularly for converters supplying Europe ahead of the 12 August 2026 PPWR application date (Regulation (EU) 2025/40). That dynamic pulls investment toward recycled-content capable grades, print systems that support on-pack sorting and traceability cues, and mill-to-box data continuity that can substantiate claims sought by brand-owner procurement and compliance teams.
Regional diversification and capacity additions are also showing up where demand and supply constraints intersect. For example, International Paper announced a USD 225 million, 468,000-square-foot greenfield box plant in Brandon, Mississippi (with a May 2026 groundbreaking), and SCG Packaging (SCGP) announced a THB 748 million expansion of corrugated container production capacity in southern Vietnam (May 2026). Alongside modernization programs such as Green Bay Packagings Project PowerPack in Arkansas (began June 2025) and Mondis multi-year capital program completed in March 2026, these moves point to opportunities tied to regionalized supply, higher-performance containerboard and paperboard grades, and specialty formats aligned with e-commerce right-sizing, retail-ready packaging, and cold-chain shippers, where performance testing and qualification are practical switching barriers.
Recent Industry Developments
- July 2026: Graphic Packaging International launched PaceSetter Ridgeline, an uncoated recycled paperboard grade produced at its Waco, Texas, mill for folding cartons and industrial paperboard applications. The launch broadens the addressable substrate set for brand owners seeking recycled-content paperboard without coated surfaces and supports converters pursuing simpler material structures.
- June 2026: International Paper completed the USD 360 million acquisition of North Pacific Paper Company (NORPAC). The deal strengthens International Papers packaging system flexibility and adds capability in high-performance grades that can be directed into corrugated and paperboard packaging supply chains.
- March 2026: Smurfit WestRock completed the acquisition of Cartomanabi, a corrugated packaging company in Montecristi, Ecuador. The move expands its converting footprint in Latin America and improves regional responsiveness for customers that require shorter lead times and local supply continuity.


Research Methodology Framework and Report Scope
Market Definition and Coverage
This market covers the revenues generated from making and selling corrugated boxes and paperboard box formats that are used to pack, protect, and ship products across industries.
Scope exclusions: It excludes paper packaging formats that are not sold as boxes (such as bags, wraps, and cartons used only as liners) and it excludes upstream pulp and paper commodities sold without conversion into boxes.
Segmentation Overview
- By Product Type
- Corrugated and Solid Fiber Boxes
- Folding Paperboard Boxes
- Rigid Boxes
- Other Product Types
- By Wall Construction
- Single-Wall
- Double-Wall
- Triple-Wall
- By End-User Industry
- Food and Beverage
- Durable Goods
- Paper and Publishing
- Chemicals
- Other End-User Industries
- By Printing Technology
- Flexographic Printing
- Lithographic Printing
- Digital Printing
- Other Printing Technologies
- By Geography
- North America
- United States
- Canada
- Mexico
- South America
- Brazil
- Argentina
- Rest of South America
- Europe
- Germany
- United Kingdom
- France
- Italy
- Spain
- Rest of Europe
- Asia-Pacific
- China
- Japan
- India
- South Korea
- Australia
- Rest of Asia-Pacific
- Middle East and Africa
- Middle East
- Saudi Arabia
- United Arab Emirates
- Turkey
- Rest of Middle East
- Africa
- South Africa
- Egypt
- Nigeria
- Rest of Africa
- Middle East
- North America
Data Sources, Market Sizing, and Validation
Desk Research
Desk work started with mapping how box demand shows up in real-world data, and then matching that to how suppliers discuss volumes, pricing, and capacity. We relied on public sources such as the US Census Bureau manufacturing and shipments tables, US International Trade Commission trade statistics, UN Comtrade customs series, FAO forestry and paper indicators, and EUROSTAT manufacturing and trade releases.
To keep assumptions realistic, annual reports, 10-Ks, investor presentations, and sustainability disclosures were reviewed to understand containerboard availability, conversion capacity, and mix shifts across wall types and end uses. Patent databases were also screened to spot changes in printing and converting methods that can influence product mix. For normalization and cross-checks, we used paid subscriptions for company financials and intelligence, plus shipment-level import and export records. The desk source list is illustrative, and additional public documents were used for data collection, validation, and research clarification.
Primary Interviews and Surveys
Primary inputs came from expert interviews and short surveys with converters, packaging distributors, and large box buyers across food, consumer goods, and industrial supply chains. These conversations were used to confirm pricing direction, wall-type mix, and plant operating rates across APAC, EMEA, and the Americas, and then follow-ups were done when model outputs looked inconsistent.
Distribution of primary research fieldwork respondents
| Company type | Respondent position | Region |
|---|---|---|
| Top tier: 30% | CXOs: 21% | APAC: 42% |
| Mid tier: 49% | Functional/Unit leaders: 39% | EMEA: 34% |
| Smaller Players: 21% | Managers: 40% | Americas: 24% |
Market-Sizing & Forecasting
Sizing is built using a top-down and bottom-up model mix, where demand is reconstructed from end-use shipment indicators and then translated into box consumption using pack rates and typical box intensity for key industries. The totals are then cross-checked with selective bottom-up approximations, such as sampled converter revenues, channel checks on average selling prices, and a reality check using capacity and utilization signals.
Key inputs include containerboard and paperboard production trends, import and export movements for converted box products, operating rates at converting plants, average selling price movement by box grade and wall type, and the share of e-commerce and retail-ready packaging within overall shipments. When primary respondents flagged abrupt price resets or temporary destocking, those effects were modeled as short-term adjustments rather than long-run shifts.
For forecasting, scenario analysis was used around demand drivers like industrial output and consumer goods shipments, and price drivers like paper and energy costs. In places where bottom-up detail was thin, gaps were handled through regional analogs and mix proxies, and then the assumptions were checked again with sources before finalizing.
Data Validation & Update Cycle
Outputs are validated through multiple checks, starting with internal consistency tests across volumes, pricing, and implied per-capita use. We compare results against independent signals like containerboard production direction, trade flows, and stated capacity expansions, and then any unusual jumps are reviewed and recalculated before sign-off.
The work is reviewed in steps, with a second analyst checking key assumptions and the math, followed by a final quality pass that looks for variance across regions and end uses. The report is refreshed annually, and interim updates are made when material events occur, such as sharp paper price swings, major capacity additions, or trade disruptions. Before delivery, a fresh review is done so clients receive the latest updated view.
Mordor Intelligence's Corrugated and Paperboard Boxes Market Estimate Compared With Other Published Estimates
Published market values for corrugated and paperboard boxes can look far apart because sources do not always count the same product set, time period, or pricing basis, and they may also treat trade and converted output differently. Differences in how paperboard box formats are grouped with corrugated boxes, plus the year used for currency conversion, are usually the biggest drivers of the spread.
Some external estimates focus only on corrugated boxes and then extend the total with broad growth rates, which can miss shifts toward paperboard rigid and folding formats in specific end uses. Those paperboard box formats are counted only when they are sold as converted box products, and upstream paper commodities and non-box paper packaging sit outside the total, a scope filter applied by Mordor Intelligence.
Benchmark comparison
| Source | Market Size | Gaps in Research Methodology |
|---|---|---|
| Mordor Intelligence | USD 247.45 B (2026) | |
| Industry Publisher A | USD 264.64 B (2025) | Uses a different base year and a longer forecast window, and the product grouping is broader, which can pull adjacent paper packaging items into the total and lift the number. |
| Research Portal B | USD 160.20 B (2024) | Covers corrugated boxes only, so paperboard box formats are not included, and the earlier base year reduces the reported value when compared to a later-year market total. |
The table shows that the largest gaps come from product scope and the timing of the base year, not from small modeling tweaks. By keeping the inputs tied to observable shipment, production, trade, and price signals, the final number stays traceable to repeatable steps that can be rechecked as conditions change.


Key Questions Answered in the Report
What CAGR is anticipated for corrugated and paperboard boxes through 2031?
The global value is projected to rise at a 4.12% CAGR from 2026 to 2031, moving from USD 247.45 billion to USD 302.82 billion.
Which geography is poised for the quickest expansion during the forecast period?
Middle East and Africa leads with a 6.86% CAGR, supported by large-scale infrastructure programs and rapidly scaling e-commerce platforms.
How much growth is expected in digital printing for corrugated packaging?
Digital presses are forecast to advance at a 6.43% CAGR through 2031 as brands seek mass customization without plate-making delays.
What factors are lifting folding paperboard box demand?
Premium cosmetics, consumer electronics, and pharmaceuticals favor lithographic-quality graphics and lightweight substrates, pushing folding paperboard to a 5.32% CAGR through 2031.
Why are triple-wall corrugated formats gaining share in heavy-duty shipping?
They combine burst strength above 1,000 psi with up to 60% tare-weight savings versus wooden crates, driving a 5.74% CAGR in applications such as automotive, machinery, and renewable-energy equipment.
Which sustainability trends most influence future packaging choices?
Mandatory recycled-content thresholds, carbon-negative fiber pilots using agro-residue, and AI-driven right-sizing software that cuts corrugate usage 8-12% are shaping buyer specifications across regions.
Page last updated on:





