Control Room Solutions Market Size and Share
Market Overview
| Study Period | 2019 - 2030 |
|---|---|
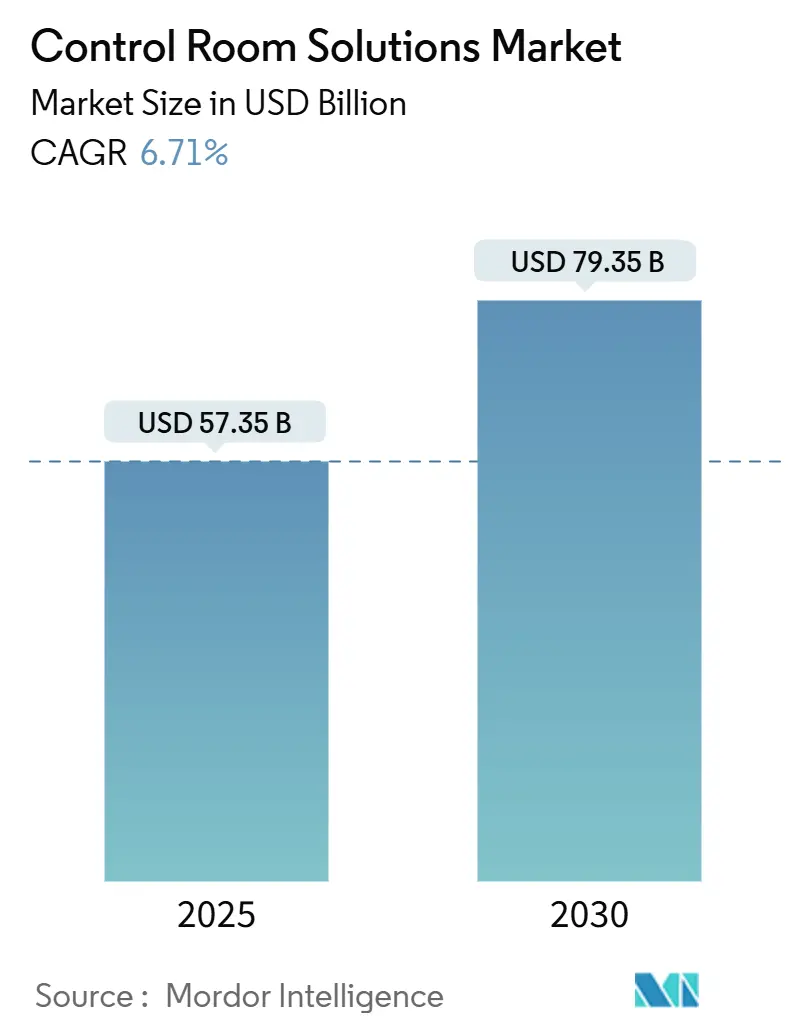
| Market Size (2025) | USD 57.35 Billion |
| Market Size (2030) | USD 79.35 Billion |
| Growth Rate (2025 - 2030) | 6.71% CAGR |
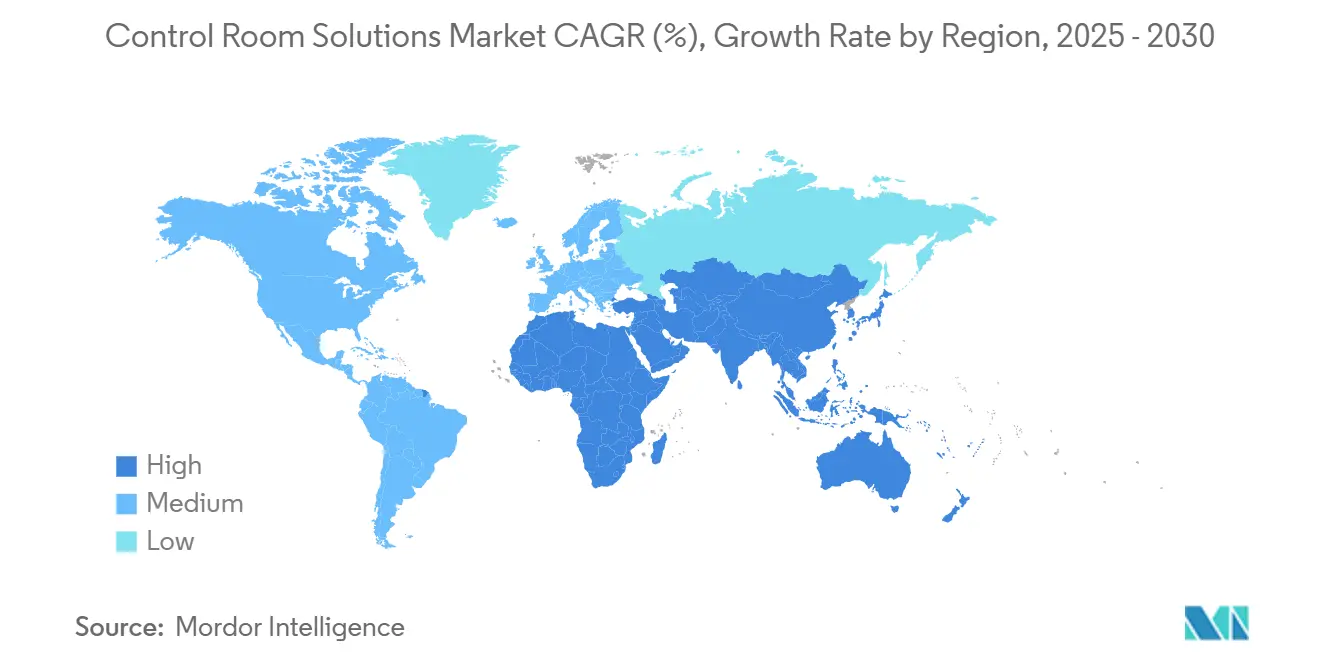
| Fastest Growing Market | Middle East and Africa |
| Largest Market | North America |
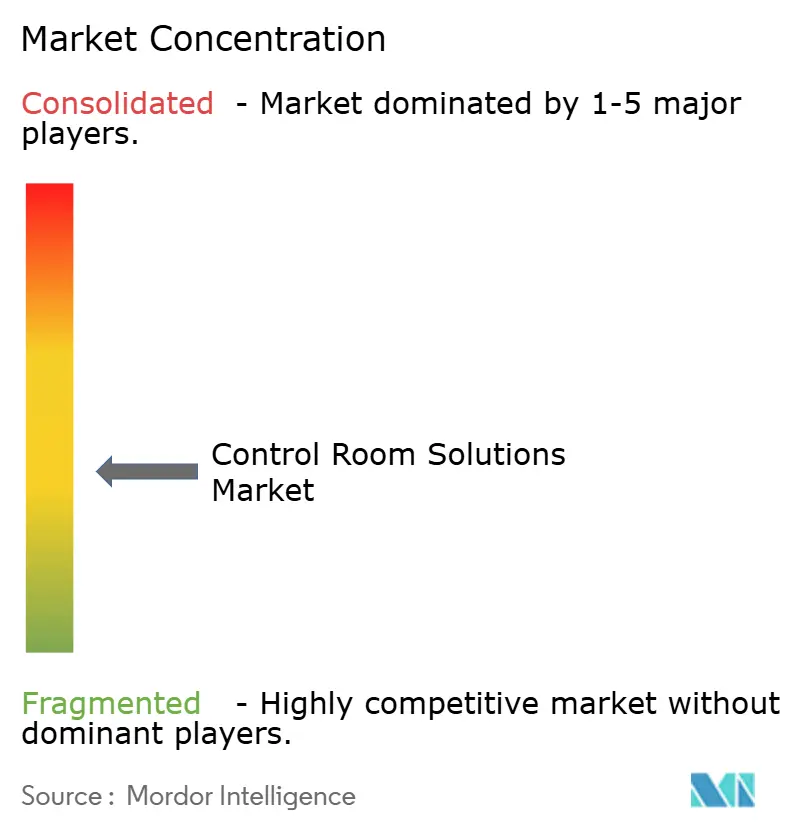
| Market Concentration | Medium |
Major Players *Disclaimer: Major Players sorted in no particular order Image © Mordor Intelligence. Reuse requires attribution under CC BY 4.0. | |
Control Room Solutions Market Analysis by Mordor Intelligence
The global control room solutions market size stands at USD 57.35 billion in 2025 and is projected to reach USD 79.35 billion by 2030, advancing at a 6.71% CAGR over the forecast period. Momentum stems from the urgency for end-to-end visibility across power grids, transport corridors, emergency response centers, and hospital networks. The convergence of operational technology with information technology is enabling unified command platforms that ingest thousands of live data feeds without operator overload. Fine-pitch LED walls are replacing bezel-lined LCDs, while secure KVM devices and AV-over-IP switching underpin resilient data-routing architectures. Cloud-connected analytics are gaining favor, yet most operators retain on-premise data sovereignty, leading to hybrid rollouts that preserve air-gapped security. Regional growth hinges on public infrastructure funding and smart-city programs that bundle real-time situational awareness with cyber-secure design principles.
Key Report Takeaways
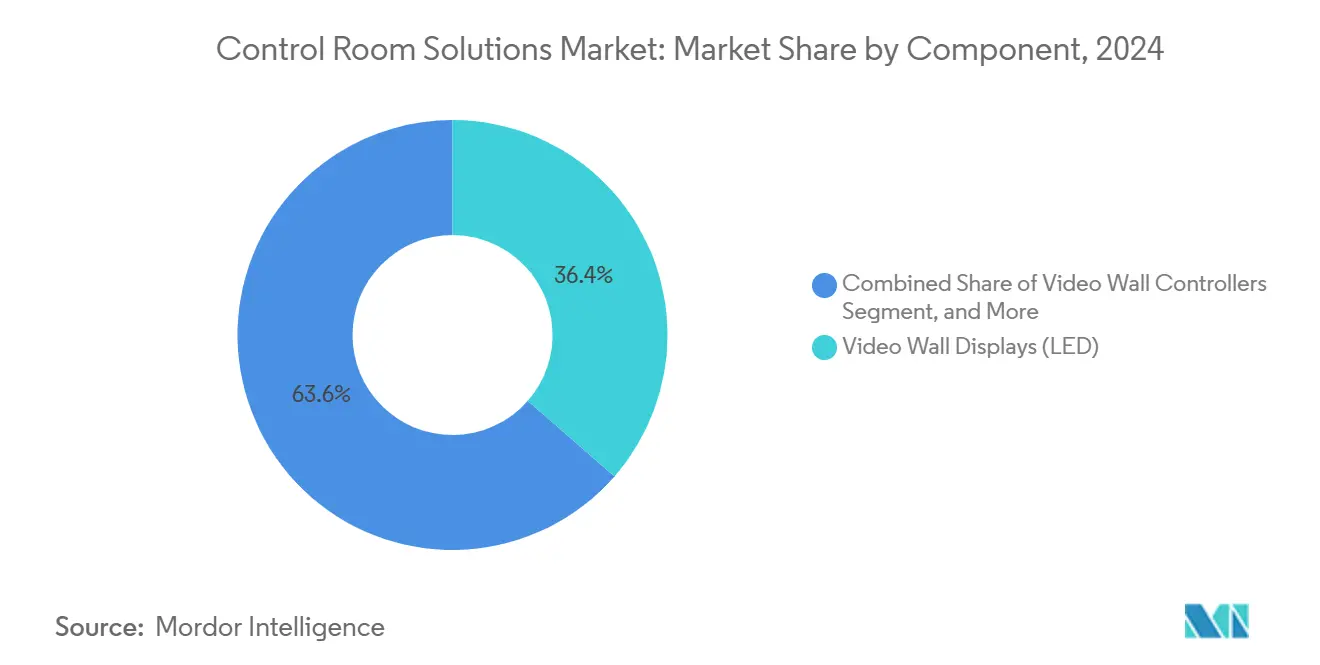
- By component, LED video wall displays led with 36.43% revenue share in 2024, while KVM and signal-management switches recorded the highest projected 6.94% CAGR through 2030.
- By deployment mode, on-premise installations held 54.37% of the control room solutions market share in 2024; hybrid configurations are expanding at an 8.64% CAGR to 2030.
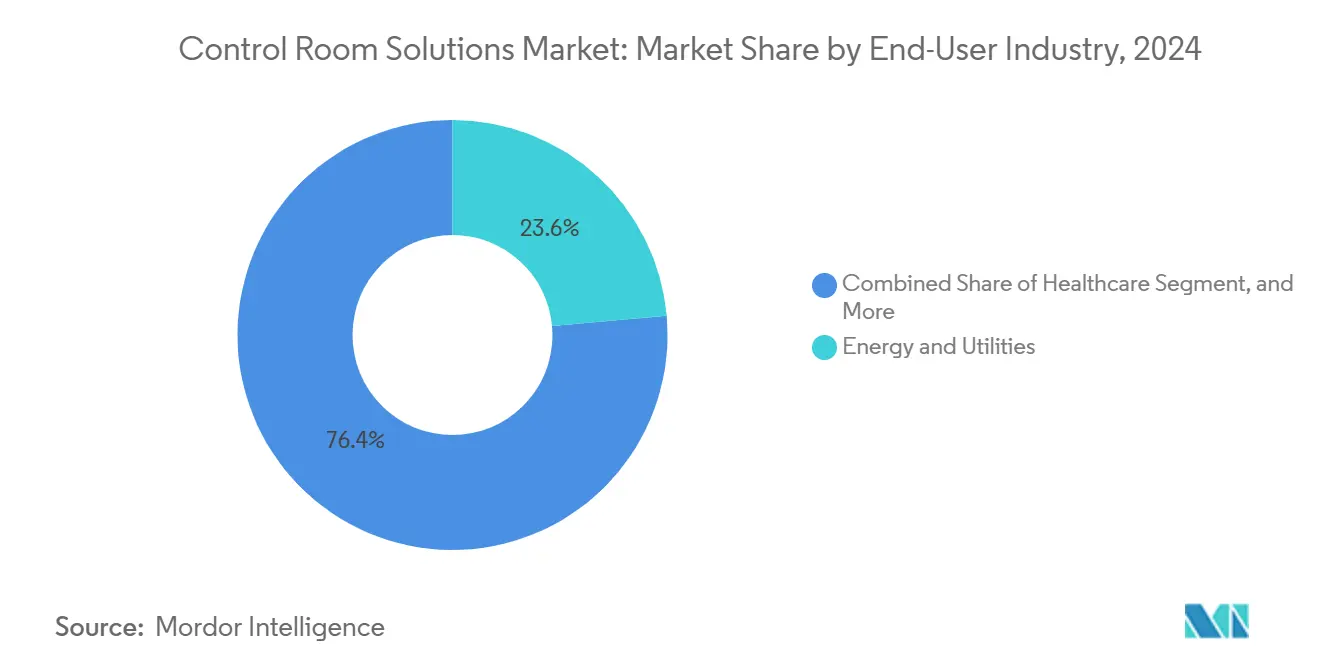
- By end-user industry, energy and utilities commanded 23.58% share of the control room solutions market size in 2024, whereas public safety and security is poised for the fastest 6.89% CAGR between 2025-2030.
- By application, command and control centers accounted for a 32.89% share of the control room solutions market size in 2024, and surveillance and security monitoring is progressing at a 7.12% CAGR through 2030.
- By geography, North America captured a 37.41% share of the control room solutions market in 2024, while the Middle East and Africa region is forecast to register the strongest 7.46% CAGR over the same period.
Note: Market size and forecast figures in this report are generated using Mordor Intelligence’s proprietary estimation framework, updated with the latest available data and insights as of January 2026.
Global Control Room Solutions Market Trends and Insights
Drivers Impact Analysis*
| Driver | (~) % Impact on CAGR Forecast | Geographic Relevance | Impact Timeline |
|---|---|---|---|
| Surging demand for real-time situational awareness in mission-critical industries | +1.8% | Global, with concentration in North America and Europe | Medium term (2-4 years) |
| Accelerated upgrade cycle from LCD to fine-pitch LED video walls | +1.5% | Global, led by Asia-Pacific manufacturing and North America utilities | Short term (≤ 2 years) |
| Convergence of OT/IT and wider adoption of unified control-room software platforms | +1.3% | North America and Europe core, expanding to Asia-Pacific | Medium term (2-4 years) |
| Growing preference for cloud-connected remote and hybrid control-room architectures | +1.2% | Global, with regulatory variations by region | Long term (≥ 4 years) |
| AI-powered analytics enabling predictive operations and incident prevention | +1.0% | North America and Europe early adoption, Asia-Pacific following | Medium term (2-4 years) |
| Government-funded smart-infrastructure programs (transport, energy, public safety) | +0.8% | North America, Europe, Middle East focus | Long term (≥ 4 years) |
| Source: Mordor Intelligence | |||
Surging Demand for Real-Time Situational Awareness in Mission-Critical Industries
Utilities need sub-second detection of grid disturbances, and transport agencies coordinate multimodal traffic flows to prevent cascading delays. Tampa Electric trimmed unplanned outages by 40% once predictive analytics surfaced early equipment anomalies. [1]Tampa Electric, “Predictive Analytics Implementation,” tampaelectric.com Hospitals mirror this urgency; Guthrie Clinic saved USD 7 million annually by centralizing patient monitoring and staff allocation. Across sectors, operators seek platforms that fuse telemetry, alarms, and video on a single pane of glass without increasing cognitive load.
Accelerated Upgrade Cycle from LCD to Fine-Pitch LED Video Walls
Bezel-free LED walls deliver higher brightness, wider viewing angles, and 50,000-hour lifespans that outclass legacy LCD counterparts. Supply constraints began easing in 2024 as Samsung and LG ramped production lines dedicated to control rooms. [2]Samsung Display, “Control Room Display Solutions,” samsungdisplay.com Falling cost-per-pixel, combined with resilience to burn-in, is shortening refresh cycles in energy control centers and rail-network command hubs.
Convergence of OT/IT and Wider Adoption of Unified Control-Room Software Platforms
Operators once relied on proprietary point systems for SCADA, security, and facility management. Modern architectures overlay these feeds inside a single software workspace, improving cross-discipline collaboration and accelerating incident triage. Early adopters in North America now pilot digital twin overlays that model asset health and simulate response strategies in near real time.
Growing Preference for Cloud-Connected Remote and Hybrid Control-Room Architectures
Hybrid topologies keep latency-sensitive data on-premise yet stream non-critical telemetry to cloud analytics engines. Microsoft Azure’s industrial edge services synchronize machine-learning insights back to the control room without exposing core OT assets to the public internet. [3]Microsoft Azure, “Industrial IoT Services,” azure.microsoft.com This approach balances regulatory compliance with AI scalability.
Restraints Impact Analysis*
| Restraint | (~) % Impact on CAGR Forecast | Geographic Relevance | Impact Timeline |
|---|---|---|---|
| High total cost of ownership for large-format direct-view LED walls | –0.9% | Global, particularly affecting mid-market segments | Short term (≤ 2 years) |
| Cyber-security vulnerabilities across converged OT/IT control environments | –0.7% | Global, with heightened concern in critical infrastructure | Medium term (2-4 years) |
| Skill-set shortage in advanced AV-over-IP and data-fusion system integration | –0.5% | North America and Europe acute, expanding globally | Long term (≥ 4 years) |
| Supply-chain volatility for display and specialty semiconductor components | –0.4% | Global, with regional variations in impact severity | Short term (≤ 2 years) |
| Source: Mordor Intelligence | |||
High Total Cost of Ownership for Large-Format Direct-View LED Walls
Comprehensive deployments can exceed USD 500,000 once specialized mounting, HVAC upgrades, and backup power are included. Although 2025 tariff exemptions cut import duties, many mid-size utilities defer refresh cycles until financing models shift from capital expenditure to operating leases. Vendors now trial subscription bundles that package hardware, software, and five-year maintenance into predictable monthly fees.
Cyber-Security Vulnerabilities Across Converged OT/IT Control Environments
Industrial networks newly linked to corporate WANs face a rising tide of malware built to disrupt physical processes. Fortinet logged a 70% year-on-year rise in attempts targeting energy and water treatment assets in 2024. Compliance frameworks such as NERC CIP push operators to embed zero-trust segmentation, multi-factor authentication, and continuous traffic inspection, elongating procurement cycles and heightening project complexity.
*Our forecasts treat driver/restraint impacts as directional, not additive. The impact forecasts reflect baseline growth, mix effects, and variable interactions.
Segment Analysis
By Component: LED Displays Maintain Dominance While KVM Solutions Accelerate
LED video wall displays held 36.43% of the control room solutions market share in 2024, reflecting their central role in mission-critical visualization. The control room solutions market size for LED displays is projected to expand steadily as operators value bezelless canvases that enhance situational clarity. Supporting subsystems evolve in lockstep; advanced controllers orchestrate higher pixel densities and HDR color spaces, and ergonomic consoles lower operator fatigue.
KVM and signal-management switches post the fastest 6.94% CAGR to 2030. These devices underpin secure data segregation by allowing staff to toggle between classified and unclassified domains through a single keyboard and mouse. These devices underpin secure data segregation by allowing staff to toggle between classified and unclassified domains through a single keyboard and mouse. The growing demand within the KVM Switch market for secure multi-system access and real-time operational control is further supporting the adoption of advanced control room solutions Black Box Corporation’s latest secure KVM line illustrates how certified isolation supports defense and public safety mandates. Over the forecast period, rising cyber-concerns will funnel additional spend toward hardware-enforced security layers.


By Deployment Mode: On-Premise Dominance Faces Hybrid Architecture Disruption
On-premise configurations accounted for 54.37% of the control room solutions market in 2024 as utilities, healthcare networks, and defense agencies uphold local data custody. Physical isolation ensures deterministic latency and compliance with stringent sector regulations. However, the control room solutions market size for hybrid deployments will outpace traditional models, supported by an 8.64% CAGR to 2030.
Hybrid frameworks offload compute-intensive analytics to the cloud while keeping command loops on site. Edge gateways pre-process data before encrypted synchronization, allowing AI workloads to refine anomaly detection without exposing core systems. Public cloud vendors now certify regionally confined availability zones to satisfy jurisdictional data-residency statutes, which accelerates adoption across Europe and Asia.
By End-User Industry: Energy Utilities Lead While Public Safety Accelerates
Energy and utilities held 23.58% of the control room solutions market share in 2024 because grid reliability, distributed renewables, and wildfire prevention require 24/7 oversight. The control room solutions market size attached to this segment will grow in tandem with smart-meter rollouts and substation digitization programs.
Public safety and security posts the strongest 6.89% CAGR, fueled by urbanization and homeland security grants for emergency operations centers. Municipal agencies integrate video analytics, GIS layers, and CAD dispatch inside unified screens to condense response times. Healthcare, manufacturing, and transportation collectively expand adoption as each pursues operational resilience and cost optimization.
By Application: Command Centers Dominate While Surveillance Monitoring Surges
Command and control centers captured 32.89% of the control room solutions market size in 2024. They bundle visualization, incident management, and multi-agency conferencing into hardened environments that withstand natural and cyber threats. Investment continues as operators retrofit legacy facilities with AI-driven alerting and environmental controls that optimize shift-worker wellbeing.
Surveillance and security monitoring grow fastest at 7.12% CAGR. Advancements in computer vision automate threat detection across campuses, border crossings, and smart-city deployments. The integration of facial recognition, license-plate readers, and acoustic sensors multiplies video-wall feed counts, increasing demand for scalable IP backbones and GPU-accelerated analytics.
Geography Analysis
North America led with 37.41% revenue share in 2024. Federal programs such as the USD 280 million SMART grants and USD 750 million FEMA resilience funding continue to modernize traffic management centers and emergency operations facilities. Strict frameworks like NERC CIP push utilities to renew control rooms with role-based access controls and segmented networks, while healthcare systems invest in centralized patient monitoring to counter nurse shortages.
The Middle East and Africa region will register a 7.46% CAGR through 2030, the fastest worldwide. Vision 2030 agendas in Saudi Arabia and the UAE earmark multibillion-dollar budgets for smart grids, intelligent mobility corridors, and AI-enabled security operations. Data-center capex exceeding USD 2 billion annually fuels demand for resilient network operations centers that manage thermal loads and power usage effectiveness.
Europe and Asia-Pacific maintain healthy expansion as they digitize manufacturing and roll out smart-city infrastructure. European utilities leverage control rooms to balance intermittent renewables, while Asian megacities require synchronized rail and road oversight. Government incentives for domestic semiconductor fabrication also ease hardware supply constraints, improving project delivery timelines.

Competitive Landscape
Competitive intensity is moderate. Display stalwarts such as Samsung, LG, and Barco safeguard their share through proprietary LED technology yet confront erosion from software-centric entrants offering hardware-agnostic orchestration layers. Mid-tier specialists like VuWall and Jupiter Systems differentiate with drag-and-drop user interfaces that simplify multi-video-wall mosaics.
Strategic moves emphasize portfolio broadening. Hardware vendors acquire analytics start-ups to embed AI features natively, while cloud providers partner with OT integrators to bridge last-mile connectivity. Vertical specialization gains traction; vendors now release pre-configured bundles for utilities, healthcare, or defense to shorten deployment time and secure recurring service revenue.
Supply-chain volatility remains a wildcard. Component lead times for LED driver ICs stretched into 2024, inflating unit costs by roughly 10%. Players with diversified sourcing or in-house chipset design cushion margin stress, whereas pure assemblers face pricing pressure. Over the horizon, open standards and IP-based signal distribution will further commoditize proprietary switching, tilting competitive advantage toward cybersecurity depth and integration proficiency.
Control Room Solutions Industry Leaders
Barco NV
Samsung Electronics Co., Ltd.
Christie Digital Systems USA, Inc.
Leyard Optoelectronic Co., Ltd.
Delta Electronics, Inc.
- *Disclaimer: Major Players sorted in no particular order

Recent Industry Developments
- September 2025: Ultra Intelligence and Communications won a USD 31.4 million IDIQ from the U.S. Air Force for joint all-domain situational intelligence.
- December 2024: AdventHealth opened its USD 20 million Mission Control Center
- November 2024: Guthrie Clinic reported USD 7 million annual savings from its Pulse Center
- October 2024: CenTrak deployments saved Atrium Health Wake Forest Baptist over USD 10 million.


Global Control Room Solutions Market Report Scope
| Video Wall Displays (LED) |
| Video Wall Displays (LCD) |
| Rear-Projection Cubes |
| Video Wall Controllers |
| Control-Room Consoles and Furniture |
| KVM and Signal-Management Switches |
| Integrated Software and Middleware |
| Services (Design, Integration, O&M) |
| On-Premise |
| Cloud |
| Hybrid |
| Energy and Utilities |
| Transportation and Logistics |
| Public Safety and Security |
| Manufacturing and Process Industries |
| Healthcare |
| Defense and Aerospace |
| IT and Telecommunications |
| Other End-User Industry |
| Command and Control Centers |
| Process Control and Monitoring |
| Emergency and Incident Management |
| Surveillance and Security Monitoring |
| Network Operations Centers (NOCs) |
| Broadcast and Media Control Rooms |
| North America | United States | |
| Canada | ||
| Mexico | ||
| Europe | Germany | |
| United Kingdom | ||
| France | ||
| Russia | ||
| Rest of Europe | ||
| Asia-Pacific | China | |
| Japan | ||
| India | ||
| South Korea | ||
| Australia | ||
| Rest of Asia-Pacific | ||
| Middle East and Africa | Middle East | Saudi Arabia |
| United Arab Emirates | ||
| Rest of Middle East | ||
| Africa | South Africa | |
| Egypt | ||
| Rest of Africa | ||
| South America | Brazil | |
| Argentina | ||
| Rest of South America | ||
| By Component | Video Wall Displays (LED) | ||
| Video Wall Displays (LCD) | |||
| Rear-Projection Cubes | |||
| Video Wall Controllers | |||
| Control-Room Consoles and Furniture | |||
| KVM and Signal-Management Switches | |||
| Integrated Software and Middleware | |||
| Services (Design, Integration, O&M) | |||
| By Deployment Mode | On-Premise | ||
| Cloud | |||
| Hybrid | |||
| By End-User Industry | Energy and Utilities | ||
| Transportation and Logistics | |||
| Public Safety and Security | |||
| Manufacturing and Process Industries | |||
| Healthcare | |||
| Defense and Aerospace | |||
| IT and Telecommunications | |||
| Other End-User Industry | |||
| By Application | Command and Control Centers | ||
| Process Control and Monitoring | |||
| Emergency and Incident Management | |||
| Surveillance and Security Monitoring | |||
| Network Operations Centers (NOCs) | |||
| Broadcast and Media Control Rooms | |||
| By Geography | North America | United States | |
| Canada | |||
| Mexico | |||
| Europe | Germany | ||
| United Kingdom | |||
| France | |||
| Russia | |||
| Rest of Europe | |||
| Asia-Pacific | China | ||
| Japan | |||
| India | |||
| South Korea | |||
| Australia | |||
| Rest of Asia-Pacific | |||
| Middle East and Africa | Middle East | Saudi Arabia | |
| United Arab Emirates | |||
| Rest of Middle East | |||
| Africa | South Africa | ||
| Egypt | |||
| Rest of Africa | |||
| South America | Brazil | ||
| Argentina | |||
| Rest of South America | |||


Key Questions Answered in the Report
What is the projected value of the control room solutions market by 2030?
The sector is forecast to reach USD 79.35 billion by 2030 based on a 6.71% CAGR.
Which component segment is growing fastest within control room environments?
KVM and signal-management switches lead with a 6.94% CAGR through 2030 driven by secure data-routing needs.
Why are hybrid control room architectures gaining traction?
They let operators keep latency-sensitive data on-premise while leveraging cloud analytics for AI and machine-learning workloads.
Which region shows the highest growth potential?
The Middle East and Africa region is expected to expand at a 7.46% CAGR due to Vision 2030 infrastructure programs.
How are healthcare providers using control room technology?
Hospitals like AdventHealth and Guthrie Clinic centralize patient monitoring, cutting labor costs and improving response times.
What cyber-security measures are critical for modern control rooms?
Zero-trust segmentation, multi-factor authentication, and continuous traffic inspection are becoming standard to counter rising OT/IT threats.
Page last updated on:


