Cleanroom Technology Market Size and Share
Market Overview
| Study Period | 2020 - 2031 |
|---|---|
| Market Size (2026) | USD 10.72 Billion |
| Market Size (2031) | USD 14.88 Billion |
| Growth Rate (2026 - 2031) | 6.78% CAGR |
| Fastest Growing Market | Asia Pacific |
| Largest Market | North America |
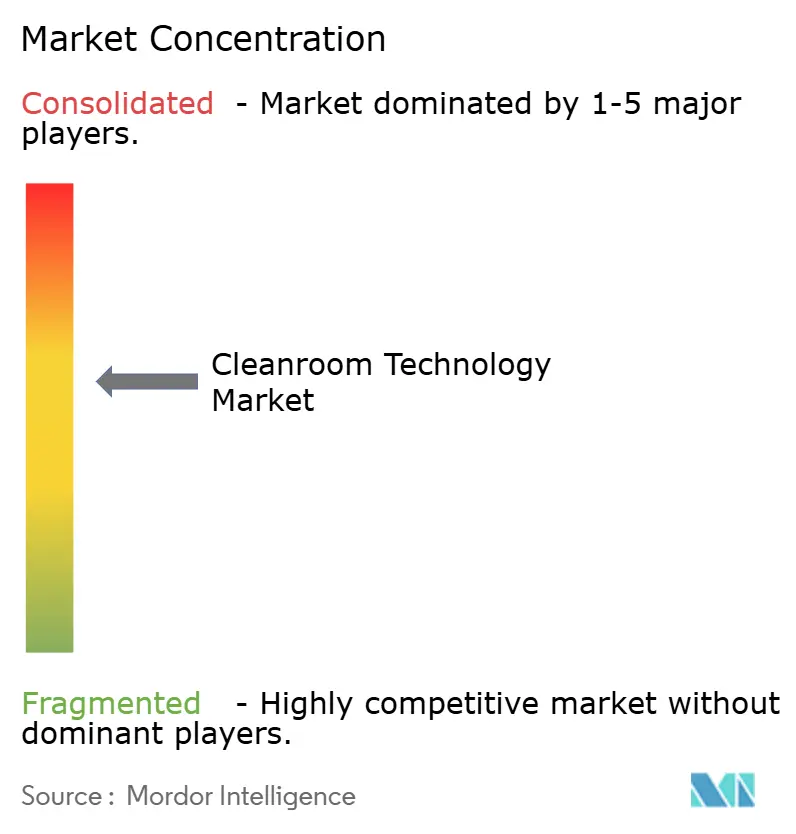
| Market Concentration | Medium |
Major Players
*Disclaimer: Major Players sorted in no particular order Image © Mordor Intelligence. Reuse requires attribution under CC BY 4.0. |
|
Cleanroom Technology Market Analysis by Mordor Intelligence
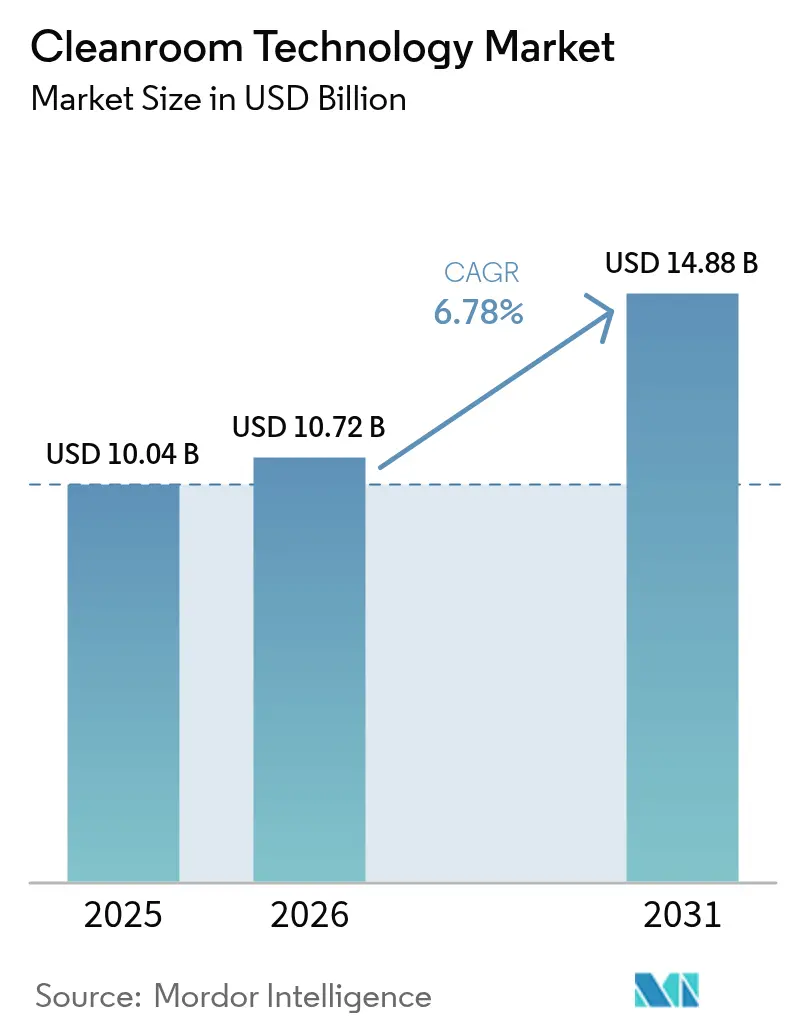
The cleanroom technology market size was valued at USD 10.04 billion in 2025 and estimated to grow from USD 10.72 billion in 2026 to reach USD 14.88 billion by 2031, at a CAGR of 6.78% during the forecast period (2026-2031). Sustained semiconductor capacity expansion, accelerated cell and gene therapy build-outs, and rising battery gigafactory investments underpin this steady advance. United States CHIPS Act grants, European Union medical-device regulations, and Asia-Pacific silicon-carbide wafer programs collectively widen the customer base and elevate specification levels. At the same time, filter-media redesign triggered by PFAS restrictions and a shortage of ISO-certified installers temper near-term growth in some regions. Suppliers that deliver modular, energy-efficient, and rapidly deployable systems continue to out-perform the overall cleanroom technology market. [1]SEMI, “Eighteen New Semiconductor Fabs to Start Construction in 2025,” semi.org
Key Report Takeaways
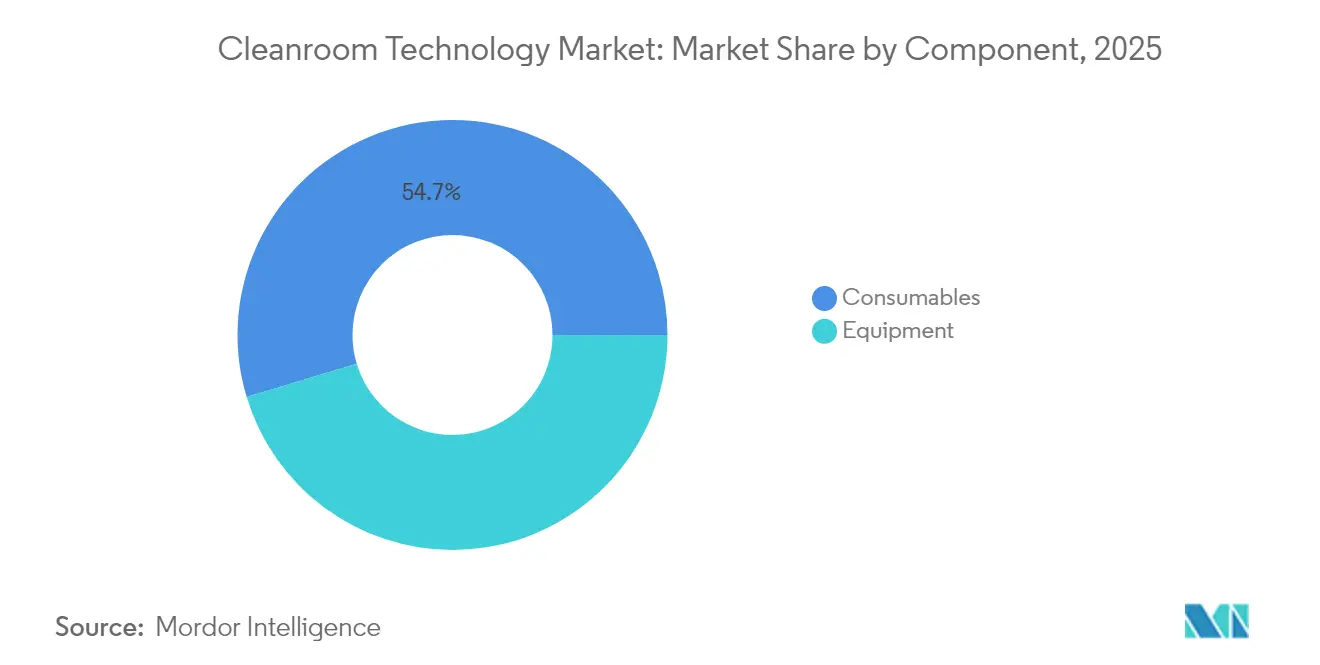
- By component, consumables led with 54.66% of the cleanroom technology market share in 2025, while equipment is projected to expand at a 7.18% CAGR to 2031.
- By construction type, modular hardwall solutions accounted for 56.20% of the cleanroom technology market size in 2025 and mobile or portable systems are advancing at an 7.74% CAGR through 2031.
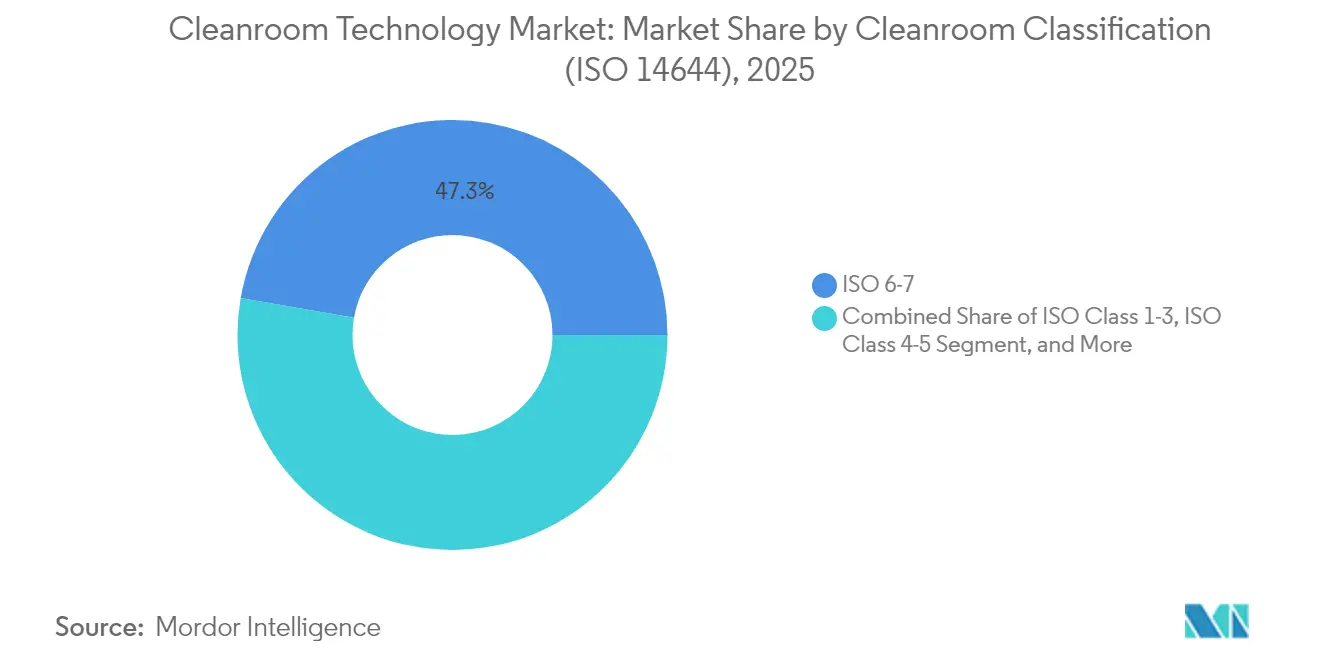
- By cleanroom classification, ISO 6-7 suites held 47.25% of the cleanroom technology market size in 2025; ISO 1-3 environments post the fastest 8.05% CAGR over 2026-2031.
- By end-user, pharmaceutical manufacturing represented 41.85% of the cleanroom technology market share in 2025, whereas semiconductor fabrication records the highest 8.28% CAGR during the forecast.
- By geography, North America captured 33.62% of the cleanroom technology market share in 2025; Asia-Pacific registers the strongest 7.32% CAGR to 2031.
Note: Market size and forecast figures in this report are generated using Mordor Intelligence’s proprietary estimation framework, updated with the latest available data and insights as of 2026.
Global Cleanroom Technology Market Trends and Insights
Drivers Impact Analysis*
| Driver | (~) % Impact on CAGR Forecast | Geographic Relevance | Impact Timeline |
|---|---|---|---|
| EU cell and gene-therapy capacity expansion | +1.20% | Europe, spillover to North America | Medium term (2-4 years) |
| CHIPS Act semiconductor fabs adding >3 million sq ft ISO 4 space | +1.80% | North America, supply chain effects global | Medium term (2-4 years) |
| Expansion of SiC wafer and advanced-packaging lines | +1.50% | Asia-Pacific core, global auto supply chain | Long term (≥ 4 years) |
| EU-MDR retrofit requirement for device SMEs | +0.90% | Europe, export markets | Short term (≤ 2 years) |
| Post-COVID negative-pressure hospital wards | +0.70% | Global, developed health systems | Medium term (2-4 years) |
| Ultra-dry Li-ion gigafactories (<1% RH) | +1.00% | China, Europe, North America | Long term (≥ 4 years) |
| Source: Mordor Intelligence | |||


Cell and Gene Therapy Manufacturing Drives Modular Cleanroom Innovation
Multiple European facilities reached operational status in 2025, each requiring ISO 5-7 modular suites for living-medicine production. Novartis brought its fully automated viral-vector site in Slovenia online, part of a EUR 3.5 billion (USD 4.09 billion) national program, while Roche opened a EUR 90 million (USD 105.18 million) gene-therapy development center in Germany. Both projects emphasize flexible, pre-engineered layouts that shorten validation cycles and ease future scale-ups. National funding schemes accelerate order flow across the cleanroom technology market.
CHIPS Act-Funded Semiconductor Expansion Accelerates Infrastructure Demand
The USD 53 billion CHIPS and Science Act ignited an unprecedented wave of United States fab construction. Eighteen new plants broke ground in 2025, each demanding ISO 4 or tighter rooms with sub-0.1 µm control. TSMC’s Arizona complex alone plans six fabs, illustrating how megaproject footprints translate directly into thousands of square metres of controlled environment. Domestic tooling suppliers and filter makers report multi-year backlogs, lifting the cleanroom technology market.
Silicon Carbide Wafer Processing Demands Ultra-Precision Environments
China, Taiwan, and South Korea accelerate silicon-carbide capacity to serve electric-vehicle inverters and fast-charging modules. Sub-micron cleanliness paired with strict temperature stability prevents defect formation during high-temperature crystal growth. The niche pushes demand for ISO 3-4 bays, precision HVAC, and abrasion-resistant floor systems, giving premium-grade providers an opportunity to secure long-term contracts. [2]DIGITIMES Asia, “Laser Tech to Speed SiC Processing,” digitimes.com
EU-MDR Compliance Creates Retrofit Demand Surge
Medical-device SMEs must upgrade to ISO 7 suites by 2027 under the European Union’s regulation. Retrofit projects often involve legacy buildings where ceiling height, airflow pathways, and waste-handling require redesign. Vendors able to deliver turnkey modules with built-in monitoring meet compressed timelines and quality-system evidence requirements, thereby capturing share across the cleanroom technology market.
Restraints Impact Analysis*
| Restraint | ( ~ ) % Impact on CAGR Forecast | Geographic Relevance | Impact Timeline |
|---|---|---|---|
| Cost inflation for HEPA/ULPA media from PFAS phase-out | -0.80% | Global, immediate in US and EU | Short term (≤ 2 years) |
| North American shortage of ISO-certified installers | -1.20% | North America, global spillover | Medium term (2-4 years) |
| Energy-intensive HVAC under EU-ETS Phase IV carbon pricing | -0.60% | Europe, global competitive impact | Long term (≥ 4 years) |
| Semiconductor down-cycles deferring ISO 1-3 projects | -0.90% | Global, cyclical chip markets | Short term (≤ 2 years) |
| Source: Mordor Intelligence | |||
PFAS Regulations Drive Filter Media Cost Inflation
The U.S. EPA set 4 ppt drinking-water limits for PFOA and PFOS, prompting a phased withdrawal of fluorinated binder and sealant chemistries common in HEPA and ULPA media. Manufacturers now validate alternative polymers while absorbing re-tooling expenses that flow into component pricing. For buyers, quarterly filter quotes increased by double digits in early 2025, tightening operating budgets across the cleanroom technology market. [3]U.S. Environmental Protection Agency, “Technologies and Cost for Removing PFAS,” epa.gov
Skilled Labor Shortage Delays Critical Infrastructure Projects
Semiconductor megaprojects require thousands of tradespeople versed in contamination-control protocols. A limited pool of ISO-certified technicians pushes project schedules beyond six months and raises overtime premiums. Builders respond by expanding apprenticeship programs and sourcing crews from Europe and Asia, yet constraints persist and slow cleanroom technology market revenue recognition.
*Our forecasts treat driver/restraint impacts as directional, not additive. The impact forecasts reflect baseline growth, mix effects, and variable interactions.
Segment Analysis
By Component: Equipment Advances Outpace Recurring Consumables
The equipment segment is projected to grow at 7.18% CAGR through 2031, outstripping the consumables category that nonetheless held a 54.66% slice of the cleanroom technology market in 2025. Energy-efficient fan-filter units and digitally monitored HVAC systems lead capital spending as fabs and therapy sites target lower operating costs and streamlined compliance reporting. Modular wall panels with factory-integrated cabling reduce onsite contamination risks while trimming installation time.
Desiccator cabinets engineered for battery-cell drying below 1% relative humidity, along with AI-enabled vacuum pumps that detect molecular contamination in real time, demonstrate how value migrates to intelligent hardware. Consumables still post steady volume gains as new square footage comes online, yet margin pressure from PFAS-related material changes shifts profit pools toward high-specification equipment providers.


By Construction Type: Modular Solutions Extend Lead Through Flexibility
Modular hardwall rooms controlled 56.20% of the cleanroom technology market in 2025, helped by proven structural integrity and simplified regulatory validation. Mobile or portable designs record an 7.74% CAGR as semiconductor, space, and contract-manufacturing users seek temporary capacity. These pre-engineered pods typically cut project schedules by 60% compared with stick-built spaces, an advantage when grant milestones or product launch dates loom.
Traditional stick-built suites remain relevant where complex utilities integration is essential. Rigid-wall rooms serve aerospace and defense programs requiring vibration dampening and electromagnetic shielding. Firms increasingly weigh lifecycle carbon footprints, and reusable modular frames align with corporate sustainability targets, reinforcing the shift in share within the cleanroom technology market.
By Cleanroom Classification: Ultra-Clean ISO 1-3 Rooms Capture Premium Growth
ISO 6-7 facilities accounted for 47.25% of the cleanroom technology market size in 2025 due to broad pharmaceutical and device production needs. Advanced semiconductor nodes, quantum research, and nanomaterial development push ISO 1-3 demand, expanding at an 8.05% CAGR through 2031. Creating such spaces costs up to 20 times more per square foot than ISO 8-9 rooms because of air-change rates exceeding 600 per hour and triple-stage filtration arrays.
Operators mitigate energy intensity through variable-speed drives, low-pressure drop diffusers, and predictive HVAC maintenance. Tiered classification within the same facility balances capex: ISO 1-3 bays handle lithography or crystal growth, while support areas operate at ISO 6-7. This zoning approach optimizes total cleanroom technology market spend yet still elevates average specification levels industry-wide.
By End-User: Semiconductor Fabrication Leads Growth While Pharma Holds Scale
Pharmaceutical manufacturing possessed 41.85% of 2025 revenue, anchored by sterile-product guidelines and biologics expansion. Semiconductor fabs, stimulated by domestic incentive packages and AI chip demand, deliver an 8.28% CAGR, making them the fastest-growing user segment. Cell and gene therapy suites represent a hybrid, sharing pharmaceutical sterility needs with flexible modular layouts usually seen in electronics.
Hospitals adopt ISO-classified rooms for compounding and isolation spaces, a post-pandemic shift that raises healthcare’s share incrementally. Battery-cell makers specify ultra-dry modules integrated with dehumidification systems achieving dew-points below -40 °C, thereby adding a fresh revenue stream to the cleanroom technology market.
Geography Analysis
North America held 33.62% of 2025 revenue on the back of CHIPS Act megaprojects and an extensive biologics pipeline. The region continues to commission new ISO 4 and tighter suites through 2028, though installer shortages slow some timelines. Canada and Mexico contribute via automotive electronics and sterile injectables plants but remain secondary in scale.
Europe follows, propelled by EU-MDR retrofit activity and a surge in gene-therapy capacity across Germany, Slovenia, and the United Kingdom. Carbon-pricing under EU-ETS Phase IV incentivizes energy recovery systems and low-velocity airflow designs, pushing vendors to refine HVAC efficiency. Eastern European countries market cost-competitive labor for modular-room assembly, attracting investment in contract manufacturing.
Asia-Pacific displays the highest 7.32% CAGR, driven by China’s USD 100 billion 300 mm fab pipeline, Taiwan’s USD 75 billion advanced-node program, and South Korea’s USD 81 billion capacity expansion. Wide-bandgap semiconductor programs, battery-cell gigafactories, and vaccine manufacturing hubs expand addressable demand. India’s first leading-edge fab in Sanand entered validation in mid-2025, signalling broader regional adoption of high-specification suites. Other emerging markets in Southeast Asia leverage electronics assembly migration to bolster local cleanroom capacity.


Competitive Landscape
Industry consolidation continues as major engineering groups acquire specialist installers and component suppliers. Exyte’s purchase of Kinetics Group widened turnkey service coverage for high-tech facilities, while Thermo Fisher Scientific integrated Solventum’s purification unit to deepen life-science filtration portfolios. Ingersoll Rand’s acquisition of ILC Dover expanded single-use systems alongside containment solutions.
Technology differentiation centers on sustainability. New fan-filter units claim 30% lower energy draw, and AI-driven airflow balancing reduces oversupply while preserving ISO class. Firms such as G-CON and Germfree collaborate on fully automated modular lines that blend robotics, IoT sensors, and real-time quality analytics. Suppliers with robust intellectual-property estates and multi-regional fabrication plants capture a premium when bidding on large semiconductor or therapy projects.
Barriers to entry remain high because clients demand proven compliance histories and comprehensive liability coverage. Established players secure multiyear framework agreements with leading chipmakers and biopharma groups, raising switching costs. Niche opportunities persist in autonomous disinfection robots and ultra-dry battery rooms, yet scale advantages favor incumbents in the broader cleanroom technology market.
Cleanroom Technology Industry Leaders
-
Azbil Corporation
-
DuPont de Nemours Inc.
-
Kimberly-Clark Corporation
-
Camfil AB
-
Taikisha Ltd.
- *Disclaimer: Major Players sorted in no particular order

Recent Industry Developments
- February 2025: Thermo Fisher Scientific completed USD 4.1 billion acquisition of Solventum’s purification and filtration unit, broadening life-science cleanroom offerings.
- February 2025: Novartis opened a EUR 40 million (USD 46.75 million) viral-vector facility in Slovenia under a EUR 3.5 billion (USD 4.09 billion) national investment program.
- January 2025: Exyte acquired Kinetics Group, strengthening global high-tech facility capabilities.
- January 2025: U.S. Department of Commerce allocated USD 1.4 billion in CHIPS Act awards, including USD 1.1 billion for an advanced packaging hub.


Research Methodology Framework and Report Scope
Market Definitions and Key Coverage
Our study defines the cleanroom technology market as the annual revenue generated from purpose-built equipment (HVAC units, HEPA / ULPA filtration, fan-filter modules, laminar benches, air showers) and classified consumables (gowns, gloves, wipes, disinfectants, sticky mats) that are installed or consumed inside ISO 1-9 or GMP Grade A-D rooms across pharmaceutical, biotechnology, semiconductor, medical-device, and advanced battery facilities.
Scope exclusion: General building HVAC components and service-only contracts that are unrelated to controlled environments sit outside this estimate.
Segmentation Overview
-
By Component
-
Equipment
- Cleanroom Air Showers
- HVAC Systems
- Laminar Air-flow Cabinets
- HEPA/ULPA Filters
- Desiccator Cabinets
- Fan-Filter Units
- Modular Cleanroom Structures
-
Consumables
- Apparel
- Gloves
- Wipes
- Disinfectants and Cleaning Chemicals
- Vacuum Systems
- Adhesive Mats
-
Equipment
-
By Construction Type
- Standard Stick-Built Cleanrooms
- Modular Hardwall Cleanrooms
- Modular Softwall Cleanrooms
- Rigid-wall Cleanrooms
- Mobile/Portable Cleanrooms
-
By Cleanroom Classification (ISO 14644)
- ISO Class 1-3
- ISO Class 4-5
- ISO Class 6-7
- ISO Class 8-9
-
By End-User
- Pharmaceutical Manufacturing
- Biotechnology R&D and Production
- Medical Device Manufacturing
- Hospitals and Healthcare Facilities
- Semiconductor Fabrication
- Micro-electronics and Optics
- Food and Beverage Processing
- Aerospace and Defense
- Automotive and Battery Manufacturing
- Other End-users
-
By Geography
-
North America
- United States
- Canada
- Mexico
-
Europe
- Germany
- United Kingdom
- France
- Italy
- Spain
- Netherlands
- Rest of Europe
-
Asia-Pacific
- China
- Japan
- India
- South Korea
- South East Asia
- Taiwan
- Rest of Asia-Pacific
-
South America
- Brazil
- Rest of South America
-
Middle East
- Gulf Cooperation Council Countries
- Turkey
- Rest of Middle East
-
Africa
- South Africa
- Rest of Africa
-
North America
Detailed Research Methodology and Data Validation
Primary Research
Mordor analysts interviewed cleanroom designers, filter media suppliers, facility managers, and regulatory auditors across North America, Europe, and Asia-Pacific. These discussions clarified live build-out pipelines, replacement cycles for consumables, and region-specific pricing spreads, giving us the confidence to refine desk-based assumptions.
Desk Research
We started with regulatory and statistical anchors such as ISO 14644 revisions, FDA 483 warning-letter data, the European Medicines Agency's GMP guidelines, and semiconductor fab capacity tables from the World Semiconductor Trade Statistics. Import-export codes for FFU modules, filters, and cleanroom apparel were mined from UN Comtrade, while company revenue splits came from 10-Ks, investor decks, and D&B Hoovers. Trade associations, including SEMI's fab outlook and Parenteral Drug Association technical reports, supplemented the evidence base. This mix lets us gauge both demand drivers and installed base dynamics.
Because open sources rarely spell out item-level pricing, we leaned on Dow Jones Factiva for contract values and on Questel patent trends to spot upcoming filtration media shifts. The sources above are illustrative; many additional public and paid references informed our validation.
Market-Sizing & Forecasting
A top-down build began with square-foot additions and refurbishment spend reported by semiconductor fabs, biomanufacturing plants, and hospital compounding centers, which were then converted to equipment outlays using typical cost-per-square-foot ratios. Select bottom-up checks, such as annual HEPA filter shipments and sampled average selling prices, helped align totals. Key variables in the model include ISO class mix, wafer-start capacity, biologics batch volumes, average cleanroom lifecycle (15 years), and consumable change-out frequency. Forecasts through 2030 rely on a multivariate regression that links those drivers to macro indicators like R&D intensity and capex announcements, before scenario analysis adjusts for regulatory shocks. Gap areas in bottom-up inputs are bridged with median industry coefficients derived from primary interviews.
Data Validation & Update Cycle
Outputs pass an anomaly screen that flags swings beyond one standard deviation versus historical patterns. Senior reviewers at Mordor re-examine outliers, and the dataset refreshes each year, with mid-cycle updates triggered by material events such as CHIPS Act funding releases.
Why Mordor's Cleanroom Technology Baseline Commands Reliability
Published figures often diverge because firms mix modular service revenue with core equipment, apply divergent ASP ladders, or freeze exchange rates at varying dates.
Key gap drivers include differing inclusion of retrofit services, older ASP series that overlook PFAS-free media premiums, and refresh cadences that lag rapid fab announcements. Mordor's base year is 2025, uses live currency conversion, and excludes non-classified HVAC, thereby limiting scope creep.
Benchmark comparison
| Market Size | Anonymized source | Primary gap driver |
|---|---|---|
| USD 10.04 B (2025) | Mordor Intelligence | - |
| USD 8.12 B (2025) | Global Consultancy A | Misses modular hard-wall upgrades and uses 2019 ASP benchmarks |
| USD 7.69 B (2024) | Industry Association B | Excludes consumables, applies conservative semiconductor capacity outlook |
| USD 8.80 B (2024) | Trade Journal C | Bundles non-ISO HVAC retrofits, fixed 2023 FX rates |
These comparisons show that when scope, variables, and refresh cadence are harmonized, Mordor's disciplined approach offers decision-makers the most transparent and repeatable baseline.


Key Questions Answered in the Report
What is the current value of the cleanroom technology market?
The market reached USD 10.72 billion in 2026 and is on track to hit USD 14.88 billion by 2031 at a 6.78% CAGR.
Which segment grows fastest within the cleanroom technology market?
Semiconductor fabrication registers the highest 8.28% CAGR through 2031, spurred by CHIPS Act funding and AI chip demand.
Why are modular cleanrooms gaining popularity?
Modular hardwall and mobile suites cut installation time by up to 60% and align with sustainability goals through reusable structures and lower material waste.
How do PFAS regulations affect cleanroom operations?
Phase-outs of fluorinated materials drive double-digit cost increases for HEPA and ULPA filters, raising consumables budgets in the short term.
Which region leads cleanroom technology market growth?
Asia-Pacific records a 7.32% CAGR to 2031, propelled by large semiconductor and battery-manufacturing investments in China, Taiwan, and South Korea.
What classification level sees the strongest demand uptick?
ISO 1-3 rooms for advanced semiconductor nodes and quantum research show the fastest 8.05% CAGR due to their ultra-low particle thresholds.
Page last updated on:


