Market Overview
| Study Period | 2020 - 2031 |
|---|---|
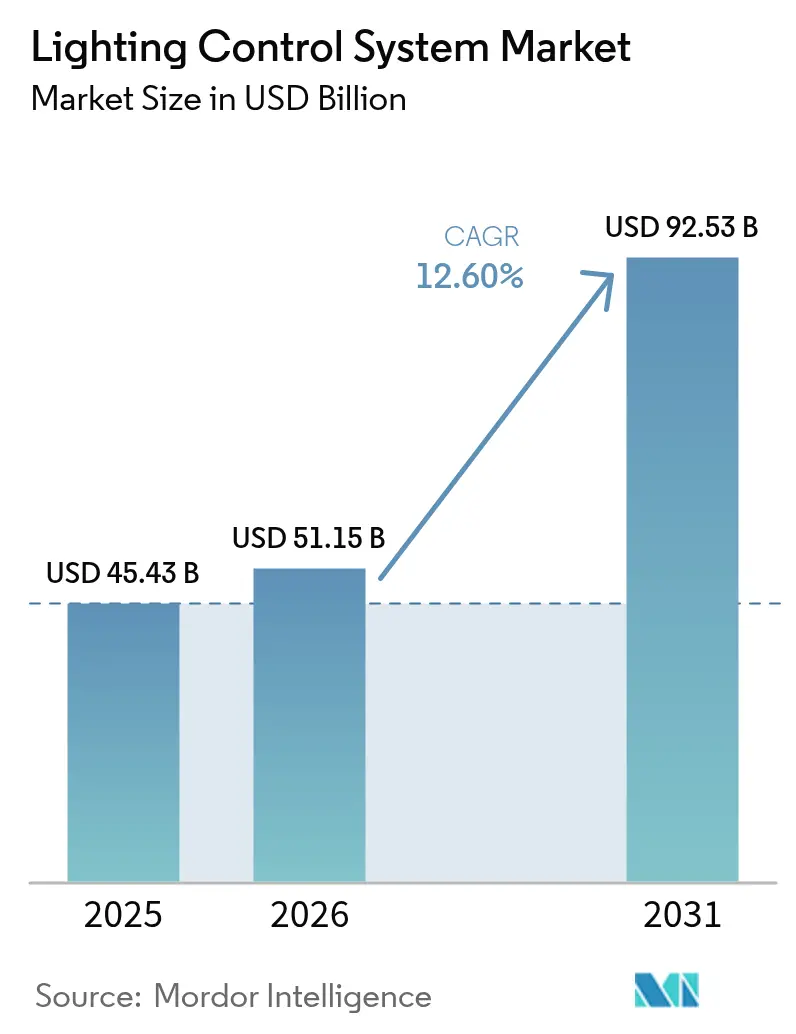
| Market Size (2026) | USD 51.15 Billion |
| Market Size (2031) | USD 92.53 Billion |
| Growth Rate (2026 - 2031) | 12.60% CAGR |
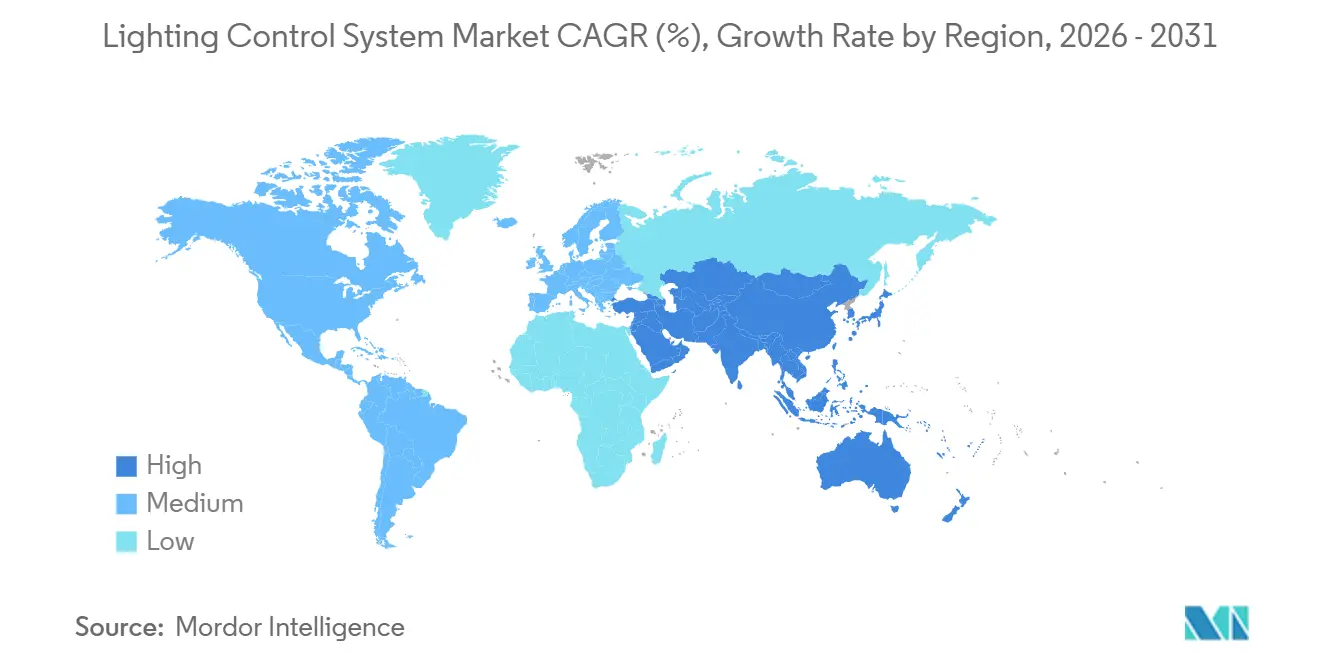
| Fastest Growing Market | Middle East |
| Largest Market | North America |
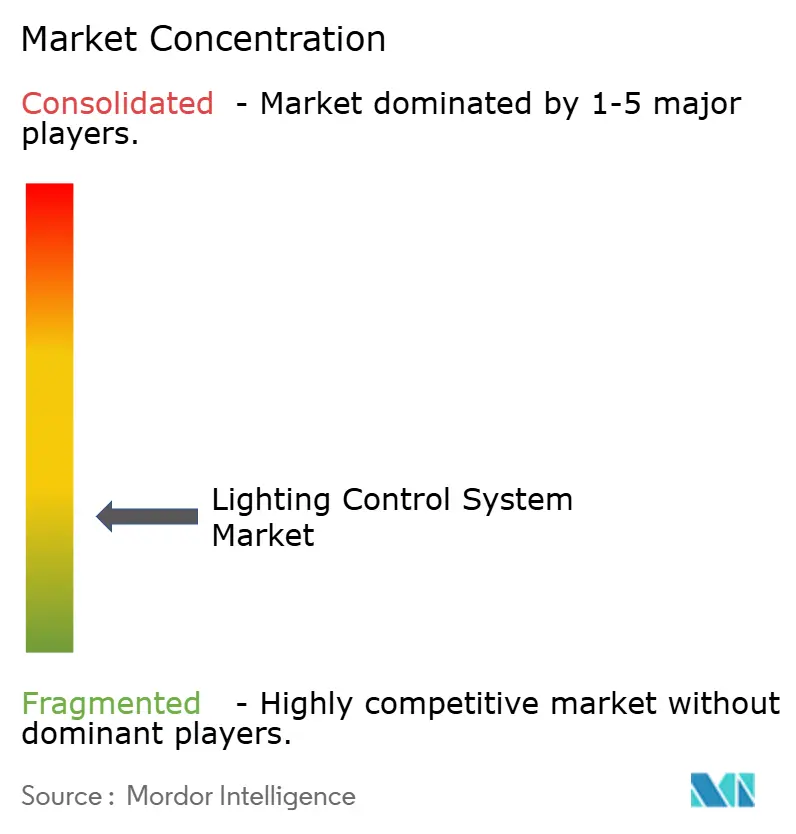
| Market Concentration | Low |
Major Players *Disclaimer: Major Players sorted in no particular order Image © Mordor Intelligence. Reuse requires attribution under CC BY 4.0. | |
Lighting Control System Market Analysis by Mordor Intelligence
The lighting control system market size is expected to increase from USD 49.84 billion in 2025 to USD 51.15 billion in 2026 and reach USD 90.53 billion by 2031, growing at a CAGR of 12.1% over 2026-2031. Escalating energy-efficiency mandates, lower LED driver costs, and the growing use of occupancy analytics are reframing lighting assets as programmable infrastructure rather than fixed overheads. Hardware still accounts for most revenue, yet commissioning and cloud services are expanding because multi-vendor, multi-protocol ecosystems raise system-integration complexity. Wireless protocols are gaining ground in retrofit projects, particularly where labor costs make rewiring expensive. Retrofit momentum also reflects policy pressure, such as California Title 24-2025 and the 2024 International Energy Conservation Code, both of which require automatic shut-off and daylight harvesting in large interior spaces. Asia Pacific currently leads the lighting control system market, but the Middle East and Africa region is accelerating on infrastructure pipelines tied to Saudi Arabia Vision 2030 and India’s SLNP program.
Key Report Takeaways
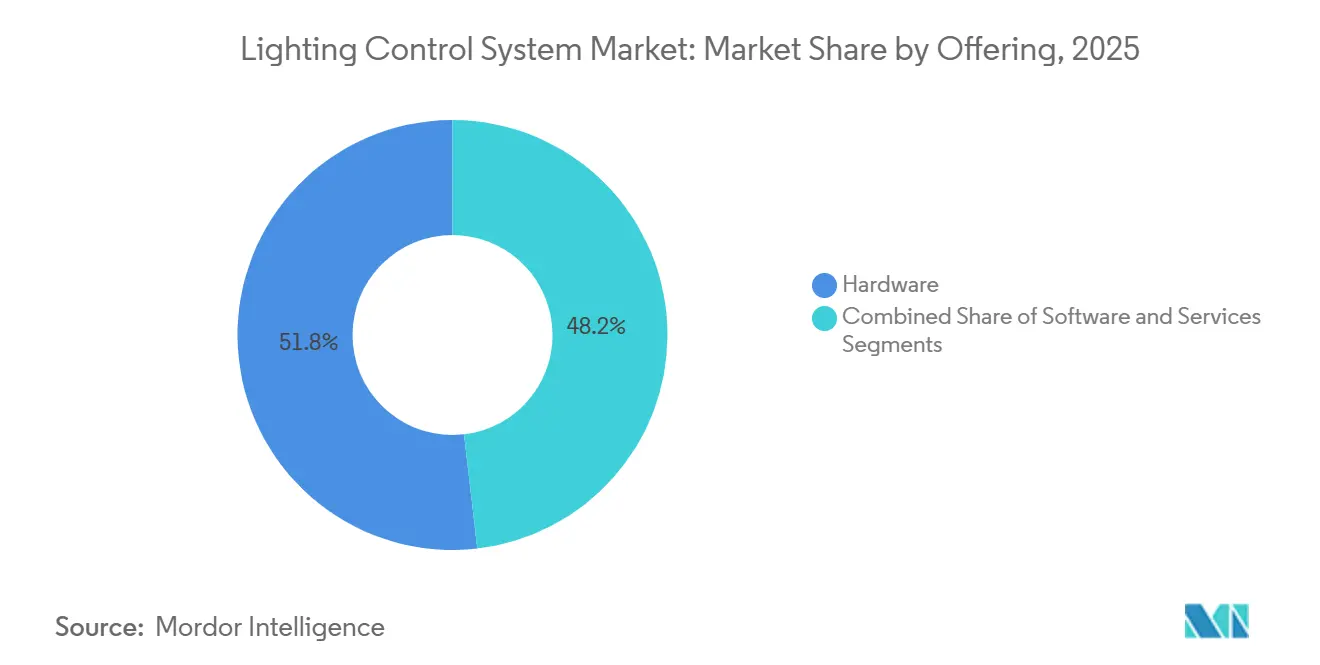
- By offering, hardware led with 51.83% of the lighting control system market share in 2025, while services recorded the highest projected CAGR at 12.22% through 2031.
- By communication protocol, wired systems held 60.52% revenue share in 2025, but wireless alternatives are advancing at a 12.73% CAGR over the forecast period.
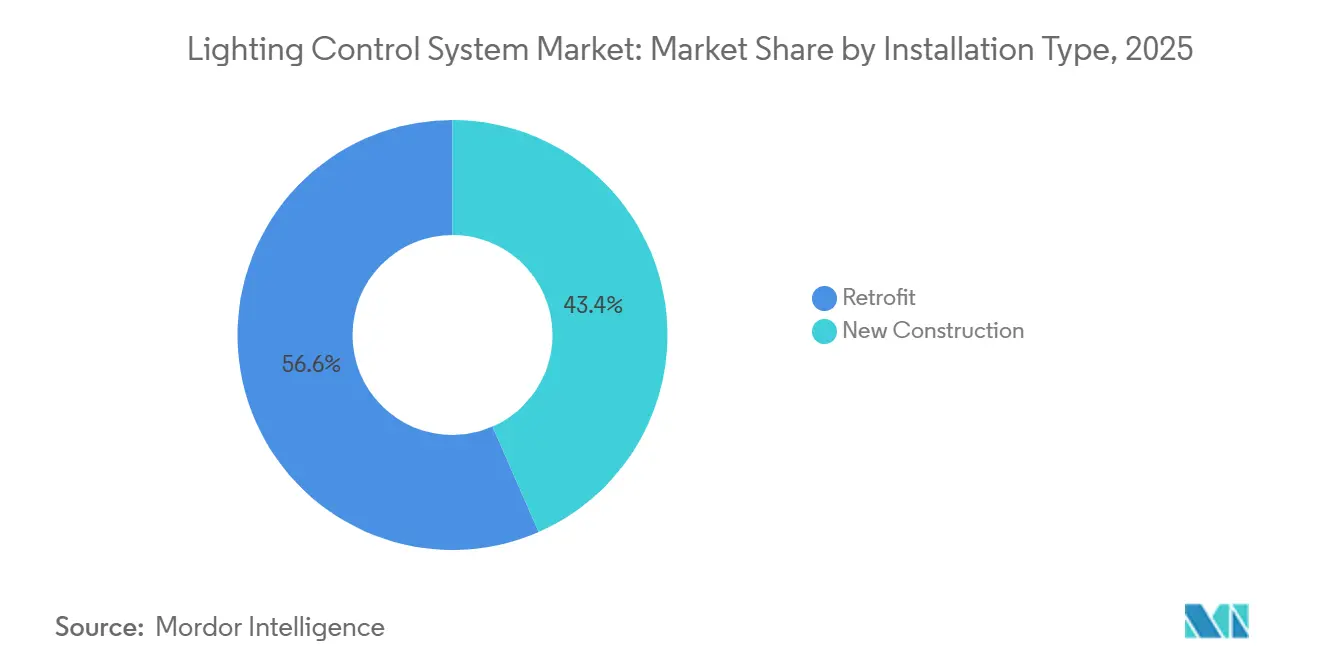
- By installation type, retrofit installations captured 56.57% of 2025 revenue and are forecast to expand at a 12.97% CAGR to 2031.
- By application, indoor deployments accounted for 63.66% of 2025 sales, whereas outdoor projects are growing fastest at a 13.07% CAGR to 2031.
- By geography, Asia Pacific commanded 35.92% revenue share in 2025; the Middle East region is projected to grow at a 12.88% CAGR through 2031.
Note: Market size and forecast figures in this report are generated using Mordor Intelligence’s proprietary estimation framework, updated with the latest available data and insights as of 2026.
Global Lighting Control System Market Trends and Insights
Drivers Impact Analysis*
| Driver | (~) % Impact on CAGR Forecast | Geographic Relevance | Impact Timeline |
|---|---|---|---|
| Growing Demand for Energy-Efficient Lighting Systems | +3.2% | Global, with peak adoption in North America and Europe | Medium term (2-4 years) |
| Stringent Building-Energy Codes and Green Certification Mandates | +2.8% | North America, Europe, and select Asia Pacific markets | Short term (≤ 2 years) |
| Rapid LED Price Erosion Expanding ROI | +2.1% | Global, accelerating in Asia Pacific and Middle East | Short term (≤ 2 years) |
| Smart-City Programs Using Adaptive Street Lighting | +1.9% | Asia Pacific, Middle East, and North America municipalities | Medium term (2-4 years) |
| ESG-Linked Finance Accelerating Smart Retrofits | +1.3% | North America and Europe, emerging in Asia Pacific | Long term (≥ 4 years) |
| Li-Fi Readiness Unlocking New Revenue Streams | +0.8% | Europe and North America, pilot deployments in Asia Pacific | Long term (≥ 4 years) |
| Source: Mordor Intelligence | |||
Growing Demand for Energy-Efficient Lighting Systems
Corporations now treat lighting loads as demand-response assets that can shift energy use away from expensive peak hours. Automated dimming and occupancy-based shut-off reduce lighting electricity by 50%-70% in high-hour office and warehouse facilities, improving Scope 2 emissions metrics. The 2024 International Energy Conservation Code makes networked controls mandatory in many interior spaces above 500 square feet, converting compliance into a primary retrofit trigger.[1]International Code Council, “2024 International Energy Conservation Code,” iccsafe.org Wireless sensor bundles that clip onto existing fixtures avoid rewiring costs in Europe, where labor budgets dominate project economics. Sensor costs have fallen below USD 10 per node, while cloud analytics monetize the resulting data streams for space-utilization reporting. These factors create a self-reinforcing cycle in which falling hardware prices and new performance metrics accelerate adoption.
Stringent Building-Energy Codes and Green Certification Mandates
California Title 24-2025 tightened power-density limits and forced automatic shut-off in private offices and conference rooms, regulations that influence almost 40% of commercial floor space in the state.[2]California Energy Commission, “2025 Building Energy Efficiency Standards,” energy.ca.gov ASHRAE 90.1-2022 introduced similar daylight-harvesting rules and is referenced by multiple U.S. jurisdictions. The European Union’s 2024 Energy Performance of Buildings Directive requires zero-emission new buildings by 2030, effectively mandating intelligent lighting. Non-compliant projects risk delayed occupancy certificates or loss of green-bond eligibility. LEED v4.1 awards up to 3 points for networked lighting systems, so landlords increasingly specify control-ready infrastructure to safeguard asset valuation.
Rapid LED Price Erosion Expanding ROI
LED luminaire component costs have declined steadily, bringing the installed price of a networked fixture with integrated sensor and wireless radio below USD 150 in municipal bulk buys during 2025. The resulting 18--36-month payback window unlocks many older warehouses that run long operating hours. Programmable drivers supporting 0-10 V dimming, DALI-2, and Bluetooth Mesh are now mainstream, reducing the historical premium once associated with “control-ready” luminaires. The incremental cost to add intelligence has dropped to less than 15% of the overall project budget, reshaping procurement decisions.
Smart-City Programs Using Adaptive Street Lighting
Cities deploy networked street lights to host air-quality sensors, traffic counters, and public-safety microphones. Los Angeles completed a 215,000-fixture LED retrofit in 2024, saving 63% on electricity and reducing maintenance truck rolls by 40% through predictive fault alerts. Singapore’s Smart Nation program connected 110,000 sensor-equipped luminaires to a centralized urban operations platform, demonstrating multi-service cost-sharing. Saudi Arabia’s USD 500 billion NEOM city mandates adaptive street lighting in all districts. These projects shift decision criteria from lowest upfront cost to total cost of ownership, valuing data monetization.
Restraints Impact Analysis*
| Restraint | (~) % Impact on CAGR Forecast | Geographic Relevance | Impact Timeline |
|---|---|---|---|
| High Upfront Installation and Integration Cost | -1.8% | Global, most acute in cost-sensitive markets | Short term (≤ 2 years) |
| Interoperability Issues Across Multi-Vendor Ecosystems | -1.3% | North America and Europe, emerging in Asia Pacific | Medium term (2-4 years) |
| Cyber-Security and Data-Privacy Risks | -0.9% | Global, heightened scrutiny in Europe and North America | Medium term (2-4 years) |
| Shortage of Qualified Commissioning Professionals | -0.7% | Asia Pacific, Latin America, and Middle East | Long term (≥ 4 years) |
| Source: Mordor Intelligence | |||
High Upfront Installation and Integration Cost
Complex commercial retrofits can reach USD 18 per square foot when wireless sensors, gateways, and commissioning fees are included, slowing adoption among owners that target three- to five-year payback ceilings. Labor remains 40%-50% of total expense in regions with technician shortages, notably Asia Pacific and Latin America. Gateway devices that bridge legacy DALI circuits to IP networks add USD 500-2,000 per zone, while cloud subscriptions introduce ongoing costs of USD 0.50-2.00 per luminaire. Elevated interest rates during 2025-2026 further compress return calculations.
Interoperability Issues Across Multi-Vendor Ecosystems
DALI-2 certification improves wired compatibility, yet proprietary extensions still require project-specific configuration tools.[3]Digital Illumination Interface Alliance, “DALI-2 Certification,” digitalilluminationinterface.org Wireless fragmentation persists across Zigbee, Bluetooth Mesh, Thread, and LoRaWAN. Matter 1.4 promises a common language, but commercial adoption remains limited in 2026. Integration failures inflate commissioning hours and, in severe cases, force hardware replacement, discouraging building owners from mixing vendors and reinforcing lock-in.
*Our forecasts treat driver/restraint impacts as directional, not additive. The impact forecasts reflect baseline growth, mix effects, and variable interactions.
Segment Analysis
By Offering: Hardware Anchors Revenue, Services Capture Recurring Value
Hardware generated 51.83% of 2025 revenue, yet services are growing at 12.22% annually through 2031 as cloud subscriptions and maintenance contracts expand recurring value. The lighting control system market size for services is set to widen further as multi-protocol gateways, sensor-fusion nodes, and predictive-analytics dashboards gain traction.
LED drivers with built-in radios replace magnetic ballasts and allow demand-response participation, while occupancy and daylight sensors now deliver multi-parameter data used by machine-learning models for space utilization and preventive maintenance. Platforms such as Signify Interact and Acuity Brands Atrius benchmark performance portfolios and auto-generate work orders. The lighting control system market will continue to see services eclipse hardware margins as outcome-based contracts guarantee savings.


By Communication Protocol: Wired Dominance Erodes as Wireless Simplifies Retrofits
Wired solutions held 60.52% revenue in 2025, powered by DALI-2 and BACnet reliability in mission-critical new builds. However, wireless uptake is climbing at a 12.73% CAGR because Matter, Bluetooth Mesh, and Thread cut labor hours and enable iterative rollouts.
The lighting control system market share for wired approaches will fall gradually as retrofits prioritize Bluetooth Mesh commissioning via smartphones and LoRaWAN for campus-scale street lights. Multi-protocol gateways preserve investment flexibility, letting owners mix legacy DALI circuits with new wireless fixtures inside a unified dashboard.
By Installation Type: Retrofit Momentum Driven by Code Compliance and ESG Pressure
Retrofits accounted for 56.57% revenue in 2025 and are projected to grow at 12.97% annually because policy triggers convert tenant improvements into mandatory control upgrades. California Title 24-2025 and the 2024 International Energy Conservation Code retroactively apply during major renovations, pushing landlords toward networked solutions.
Wireless overlays cut installation labor by half compared with rewiring, allowing phased deployment that aligns with tight capital budgets. New construction grows more slowly, yet integrated design lowers per-fixture costs and supports sophisticated zoning, ensuring that the lighting control system market continues to diversify revenue sources.
By Application: Indoor Dominates, Outdoor Accelerates on Municipal Spend
Indoor environments accounted for 63.66% of revenue in 2025, driven by office, warehouse, and manufacturing floor areas. High-bay fixtures with integrated sensors slash 60%-75% of lighting electricity in round-the-clock industrial sites.
Outdoor growth, forecast at 13.07% CAGR, rides on smart-city allocations for adaptive roadway lighting that pairs energy savings with air-quality monitoring and traffic analytics. Citywide projects in Los Angeles, Singapore, and Vienna demonstrate 50%-65% energy savings plus maintenance cost reductions.
Geography Analysis
Asia Pacific led with 35.92% revenue in 2025 as China, India, and Japan embedded lighting controls into green-building laws and national street-lighting programs. China’s smart-city pilots use luminaires as sensor hubs for 5G micro-cells, while South Korea’s Green New Deal allocates KRW 2 trillion for energy-efficient retrofits.
North America and Europe remain sizeable, as retrofit mandates, ESG-linked finance, and tenant certification requirements sustain double-digit growth. Germany’s GEG building-energy law and forthcoming United Kingdom Future Buildings Standard each push intelligent controls into new and existing stock.
The Middle East and Africa region is the fastest-growing, with a projected 12.88% CAGR, propelled by Saudi Arabia's Vision 2030, UAE smart-city projects, and South African demand-response pilots that reward dimmable fixtures during peak grid events.

Competitive Landscape
The lighting control system market is moderately fragmented; the top five vendors collectively control about 38% global revenue. Market concentration remains low because regional specialists and protocol-focused players fill technical niches. Signify, Acuity Brands, Legrand, Lutron Electronics, and Schneider Electric dominate specification-grade accounts, yet their combined share leaves room for disruptors.
Product strategy revolves around bundling hardware, cloud software, and lifecycle services into outcome-based contracts. Signify reported that connected lighting reached 28% of 2024 revenue, underscoring the pivot toward subscription models. Cisco leverages Power-over-Ethernet infrastructure to position IT departments as buyers, challenging traditional facilities budgets.
Li-Fi start-ups such as pureLiFi and Oledcomm pursue premium secure-connectivity niches. Competitive differentiation increasingly depends on IEC 62443 cyber-hardening and over-the-air firmware update capability. Vendors that supply commissioning labor alleviate the skilled-technician bottleneck and capture higher margins.
Lighting Control System Industry Leaders
Signify (Philips Lighting)
Acuity Brands
Lutron Electronics
Schneider Electric
Legrand S.A
- *Disclaimer: Major Players sorted in no particular order

Recent Industry Developments
- December 2025: Signify partnered with Microsoft to sync Interact data with Azure Digital Twins, enabling predictive maintenance across lighting, HVAC, and security .
- November 2025: Acuity Brands acquired Distech Controls for USD 400 million to deepen building-automation integration.
- October 2025: Lutron Electronics released Athena 2.0 with machine-learning occupancy prediction and voice-assistant support.
- September 2025: ams OSRAM opened a USD 165 million LED and sensor plant in Penang, Malaysia, targeting Southeast Asia demand.


Global Lighting Control System Market Report Scope
Smart lighting control systems improve energy efficiency and performance. These systems have countless applications across diverse verticals, like aircraft, automobiles, home appliances, etc. Smart lighting controls have been increasingly adopted in an effort to reduce energy consumption.
The Lighting Control System Market Report is Segmented by Offering (Hardware, Software, and Services), Communication Protocol (Wired and Wireless), Installation Type (New Construction and Retrofit), Application (Indoor and Outdoor), and Geography (North America, South America, Europe, Asia Pacific, Middle East, and Africa). The Market Forecasts are Provided in Terms of Value (USD).
By Offering
| Hardware | LED Drivers |
| Sensors | |
| Switches and Dimmers | |
| Relay Units | |
| Gateways and Control Panels | |
| Software | |
| Services |
By Communication Protocol
| Wired |
| Wireless |
By Installation Type
| New Construction |
| Retrofit |
By Application
| Indoor | Commercial Offices |
| Industrial and Warehousing | |
| Residential | |
| Hospitality and Leisure | |
| Rest of Indoor | |
| Outdoor | Roadway and Street |
| Architectural and Facade | |
| Sports and Stadium | |
| Rest of Outdoor |
Geography
| North America | United States |
| Canada | |
| Mexico | |
| South America | Brazil |
| Argentina | |
| Rest of South America | |
| Europe | Germany |
| United Kingdom | |
| France | |
| Italy | |
| Spain | |
| Rest of Europe | |
| Asia Pacific | China |
| Japan | |
| India | |
| South Korea | |
| Southeast Asia | |
| Rest of Asia Pacific | |
| Middle East | Saudi Arabia |
| United Arab Emirates | |
| Turkey | |
| Rest of Middle East | |
| Africa | South Africa |
| Nigeria | |
| Egypt | |
| Rest of Africa |
| By Offering | Hardware | LED Drivers |
| Sensors | ||
| Switches and Dimmers | ||
| Relay Units | ||
| Gateways and Control Panels | ||
| Software | ||
| Services | ||
| By Communication Protocol | Wired | |
| Wireless | ||
| By Installation Type | New Construction | |
| Retrofit | ||
| By Application | Indoor | Commercial Offices |
| Industrial and Warehousing | ||
| Residential | ||
| Hospitality and Leisure | ||
| Rest of Indoor | ||
| Outdoor | Roadway and Street | |
| Architectural and Facade | ||
| Sports and Stadium | ||
| Rest of Outdoor | ||
| Geography | North America | United States |
| Canada | ||
| Mexico | ||
| South America | Brazil | |
| Argentina | ||
| Rest of South America | ||
| Europe | Germany | |
| United Kingdom | ||
| France | ||
| Italy | ||
| Spain | ||
| Rest of Europe | ||
| Asia Pacific | China | |
| Japan | ||
| India | ||
| South Korea | ||
| Southeast Asia | ||
| Rest of Asia Pacific | ||
| Middle East | Saudi Arabia | |
| United Arab Emirates | ||
| Turkey | ||
| Rest of Middle East | ||
| Africa | South Africa | |
| Nigeria | ||
| Egypt | ||
| Rest of Africa | ||


Key Questions Answered in the Report
How large will the lighting control system market be in 2031?
The market is forecast to reach USD 90.53 billion by 2031, expanding at a 12.1% CAGR from 2026.
Which segment is growing fastest within lighting control systems?
Services, encompassing commissioning and cloud software, is projected to grow at 12.22% annually through 2031.
Why are retrofits outpacing new construction?
Retrofit demand rises because tightening energy codes apply when existing buildings undergo tenant improvements, and wireless systems cut labor costs.t rivals wired systems, fuelling a 14.85% CAGR for wireless solutions.
Which region will see the highest growth?
The Middle East region is expected to post a 12.88% CAGR thanks to large infrastructure programs tied to Vision 2030 and similar initiatives.
How fragmented is vendor competition?
The top five players account for roughly 38% revenue, so the market remains open for specialists and new entrants, reflected in a concentration score of 3.
Page last updated on:


