Connected Living Room Market Size and Share
Market Overview
| Study Period | 2019 - 2030 |
|---|---|
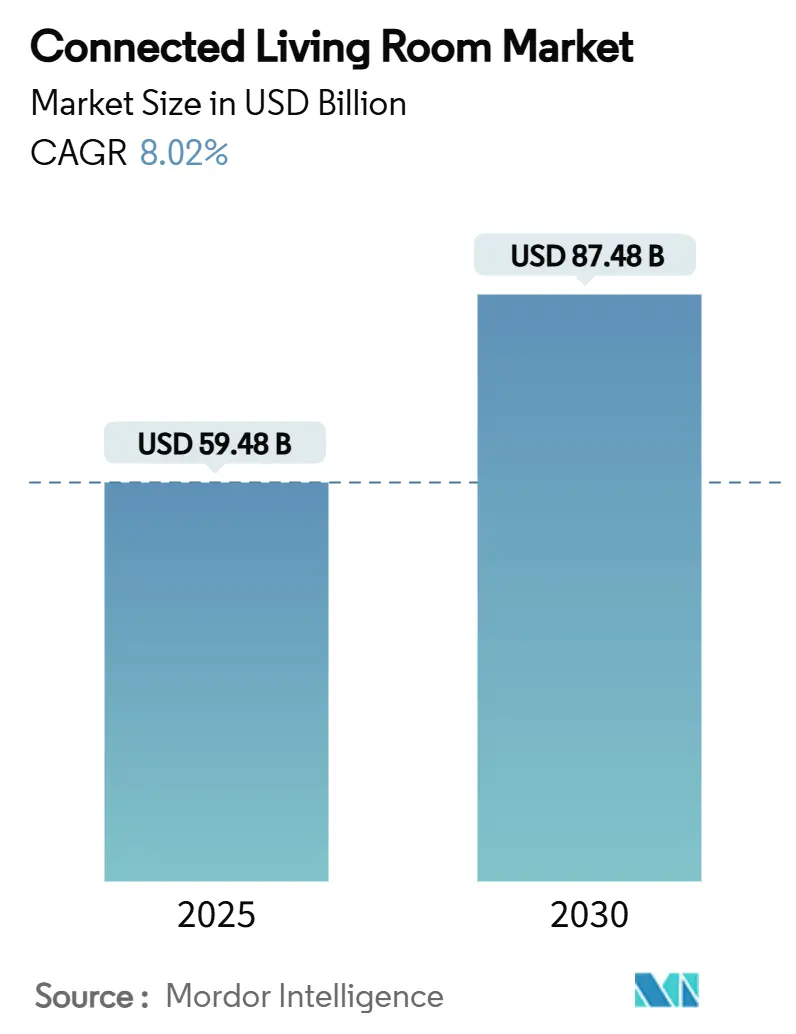
| Market Size (2025) | USD 59.48 Billion |
| Market Size (2030) | USD 87.48 Billion |
| Growth Rate (2025 - 2030) | 8.02% CAGR |
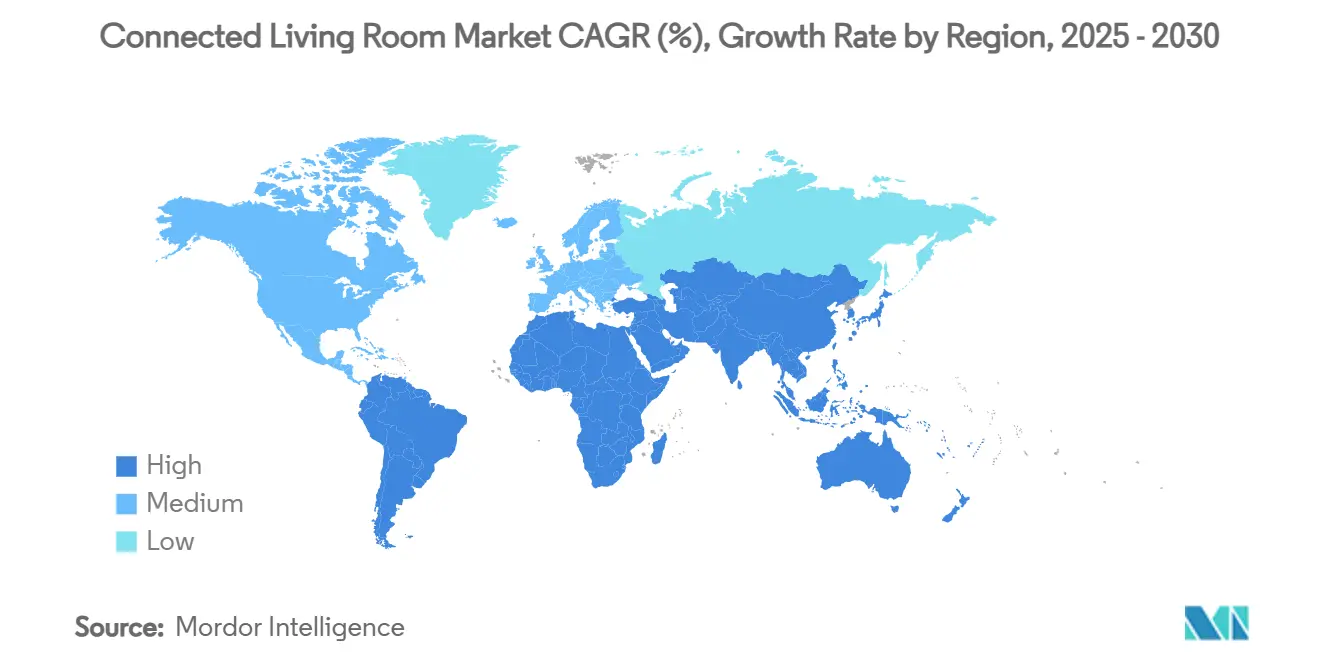
| Fastest Growing Market | Middle East and Africa |
| Largest Market | Asia Pacific |
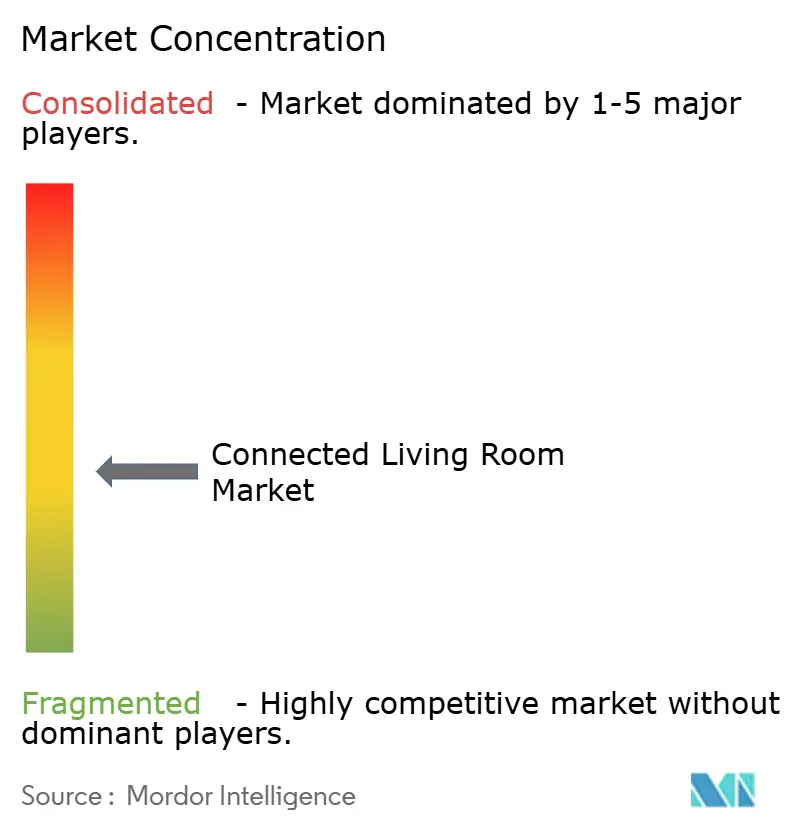
| Market Concentration | Medium |
Major Players *Disclaimer: Major Players sorted in no particular order Image © Mordor Intelligence. Reuse requires attribution under CC BY 4.0. | |
Connected Living Room Market Analysis by Mordor Intelligence
The connected living room market size stands at USD 59.48 billion in 2025 and is forecast to reach USD 87.48 billion by 2030, advancing at an 8.02% CAGR. Rapid device price compression, the shift from hardware-centric to platform-centric business models, and the availability of Wi-Fi 6E/7 infrastructure are accelerating adoption. Chinese manufacturers leverage vertically integrated supply chains to release large-screen smart TVs at disruptive prices, forcing incumbents to recalibrate premium strategies. Cloud gaming delivered natively through smart TV apps broadens the addressable base beyond traditional console owners, while retail-media and shoppable-TV monetization subsidize hardware costs and lower entry barriers for first-time buyers. Simultaneously, the gradual rollout of the Matter standard promises unified device interoperability, but fragmented operating systems and rising data-privacy scrutiny temper the medium-term growth outlook.
Key Report Takeaways
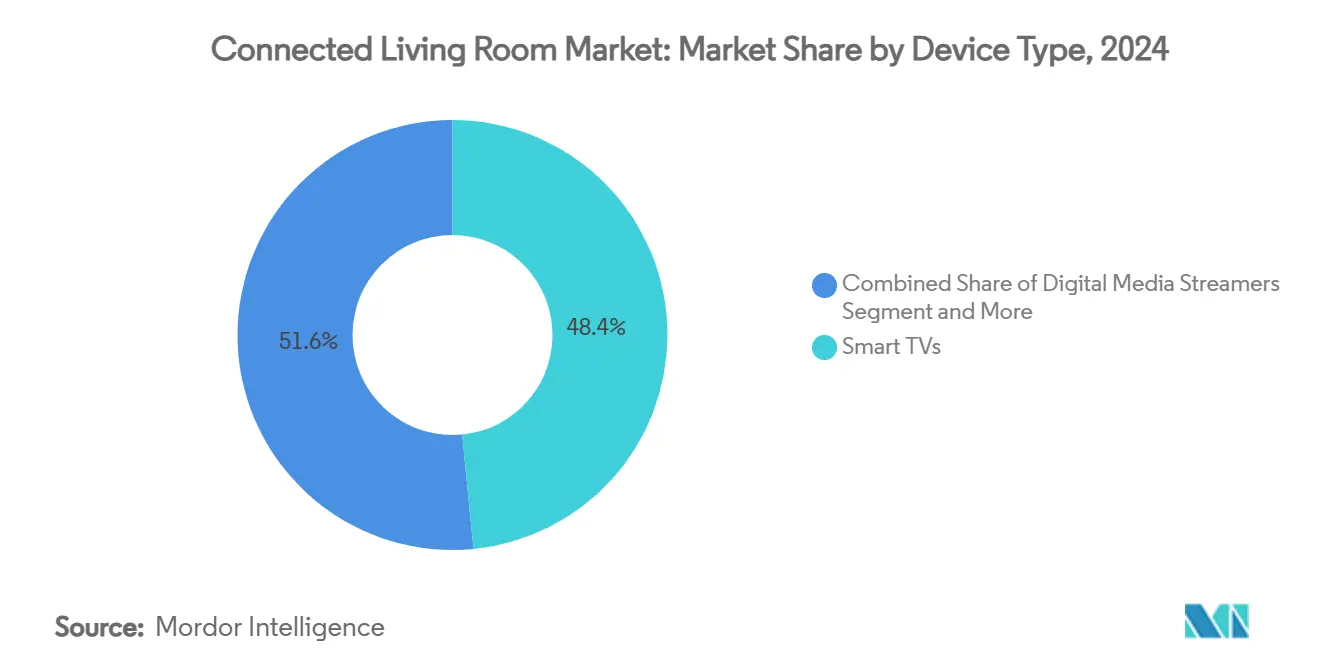
- By device type, Smart TVs led with 48.44% revenue share in 2024; Digital Media Streamers are projected to expand at a 12.54% CAGR through 2030.
- By connectivity technology, Wi-Fi commanded 90.13% share of the connected living room market size in 2024 and is heading toward an 11.73% CAGR to 2030.
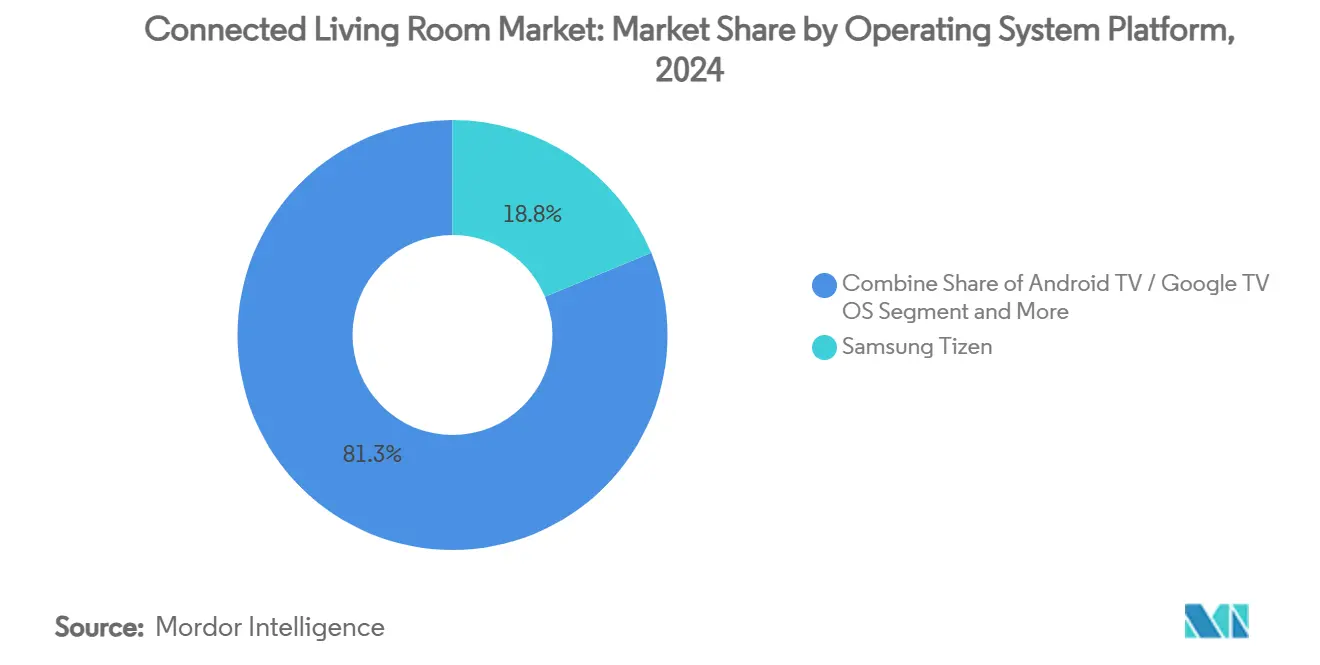
- By operating system, Samsung Tizen captured 18.75% of the connected living room market share in 2024, while Android TV/Google TV is rising at a 12.86% CAGR through 2030.
- By application, Video Streaming and OTT accounted for 63.54% share of the connected living room market size in 2024, and Gaming and eSports are advancing at a 10.65% CAGR to 2030.
- By geography, Asia-Pacific held 38.23% revenue share in 2024; the Middle East and Africa region is forecast to record an 11.89% CAGR between 2025-2030.
Global Connected Living Room Market Trends and Insights
Drivers Impact Analysis*
| Driver | (~) % Impact on CAGR Forecast | Geographic Relevance | Impact Timeline |
|---|---|---|---|
| Rapid decline in smart-TV prices and rising penetration in emerging markets | +1.5% | APAC core, spill-over to MEA and Latin America | Medium term (2-4 years) |
| Bundled streaming services accelerating device refresh cycles | +2.2% | Global, with concentration in North America & EU | Short term (≤ 2 years) |
| Wi-Fi 6E/7 roll-out enabling multi-device 4K/8K streaming | +1.8% | Global, led by North America and developed APAC markets | Medium term (2-4 years) |
| Cloud gaming arrives natively on smart TVs | +1.3% | Global, early adoption in North America and EU | Long term (≥ 4 years) |
| Retail-media and shoppable-TV monetization subsidising hardware | +0.9% | North America & EU, expanding to APAC | Medium term (2-4 years) |
| Matter standard promises unified device interoperability | + 0.8% | Global, with faster adoption in developed markets | Long term (≥ 4 years) |
| Source: Mordor Intelligence | |||
Rapid decline in smart-TV prices and rising penetration in emerging markets
Large-screen LCD prices have fallen by 66% since 2022, enabling Chinese brands to offer 98-inch models at USD 1,999 and accelerating household upgrades in India, Indonesia, and Brazil. TCL and Hisense each posted double-digit shipment growth in 2023 as vertically integrated component sourcing allowed leaner bill-of-materials costs. The price war is widening smart-TV access among first-time buyers who leapfrog set-top boxes and connect directly to streaming platforms. Incumbents Samsung and LG have countered with value-oriented 98-inch LCD ranges, balancing volume gains against margin pressure. Expanding installed bases feed service revenues from paid apps and advertising, sustaining the connected living room market even when hardware profits tighten.
Bundled streaming services accelerating device refresh cycles
Revenue-sharing deals between manufacturers and over-the-top platforms bundle premium content with new TV models, shortening replacement cycles from seven to five years in North America. Samsung Gaming Hub pre-installs Xbox Cloud Gaming, GeForce NOW, and Amazon Luna on 2022-onward TVs, nudging owners of 2019-models to upgrade for exclusive access. Amazon Fire TV’s Omni Mini-LED range similarly marries hardware subsidies with Prime Video and Alexa services, converting one-time buyers into subscription customers. LG’s promise of multiyear webOS updates reduces perceived obsolescence while sustaining engagement metrics, underlining the strategic pivot toward recurring revenue streams.
Wi-Fi 6E/7 roll-out enabling multi-device 4K/8K streaming
Wi-Fi 7’s 320 MHz channels and Multi-Link Operation provide more than 40 Gbps throughput, eliminating buffering in multi-stream households. [1]Qualcomm, “Wi-Fi 7 Next-Generation Standard,” qualcomm.com Samsung Neo QLED lines already carry Wi-Fi 6E certification, tapping the 6 GHz band for four-times capacity over Wi-Fi 5. Spectrum approvals in the EU, Saudi Arabia, and Brazil accelerate uptake, while router vendors embed tri-band radios to future-proof home networks. The upgrade wave lifts demand for higher-end TVs and media streamers capable of 8K playback, reinforcing connectivity as a core differentiator within the connected living room market.
Cloud gaming arrives natively on smart TVs
LG integrated the Xbox app directly into its 2025 TV portfolio, giving Game Pass Ultimate subscribers hundreds of games without console investment. The model democratizes AAA gaming in cost-sensitive regions where console penetration lingers in single digits. Samsung’s Gaming Hub unifies Xbox, NVIDIA GeForce NOW, and Blacknut with AI upscaling and low-latency modes, positioning the TV as a central entertainment gateway. Operators bundle fiber broadband, Wi-Fi 6E routers, and gaming subscriptions, forming triple-play packages that reinforce the connected living room market value chain.
Restraints Impact Analysis*
| Restraint | (~) % Impact on CAGR Forecast | Geographic Relevance | Impact Timeline |
|---|---|---|---|
| Fragmented OS ecosystem complicates app development | -0.7% | Global, particularly impacting smaller developers | Medium term (2-4 years) |
| Consumer privacy and data-sharing concerns | -1.1% | EU and North America leading, expanding globally | Short term (≤ 2 years) |
| Semiconductor supply-chain volatility | -0.9% | Global, with acute impact in APAC manufacturing hubs | Short term (≤ 2 years) |
| Rising e-waste compliance costs | -0.6% | EU leading, expanding to developed markets | Long term (≥ 4 years) |
| Source: Mordor Intelligence | |||
Consumer privacy and data-sharing concerns
Smart TVs harvest granular data on viewing habits, voice commands, and demographic profiles, often without clear consent. [2]Scarlata Alexa, “Smart TV Data Collection and How to Stop It,” Choice, choice.com.au EU regulators contemplate stricter opt-in requirements under the Digital Services Act, while California expands CCPA enforcement to connected devices. Academic studies flag “smart surveillance” risks as AI integrations such as Google Gemini require broader data sets. Manufacturers respond with on-device processing and clearer dashboards, but consumer trust lags, moderating uptake in privacy-sensitive regions.
Semiconductor supply-chain volatility
Post-pandemic chip demand for AI servers crowds foundry capacity, squeezing allocations for display drivers and Wi-Fi SoCs. [3]Cavallaro Frank, “What to Expect in the 2025 Semiconductor Supply Chain,” Supply Chain Dive, sdcexec.com Lead times for mid-range TV chipsets doubled from 12 to 24 weeks in early 2025, prompting inventory prepayments and higher working-capital needs, especially for second-tier brands. Samsung and LG diversify suppliers but still face cost swings that complicate launch calendars and price positioning. Persistent volatility detracts 0.9 percentage points from the projected CAGR of the connected living room market.
*Our forecasts treat driver/restraint impacts as directional, not additive. The impact forecasts reflect baseline growth, mix effects, and variable interactions.
Segment Analysis
By Device Type: Smart TVs Lead Despite Streaming Surge
Smart TVs held a 48.44% share of the connected living room market in 2024, confirming their status as the ecosystem anchor. Migration to 75-inch-plus panels under USD 2,000 fuels volume, while AI-powered picture processing and integrated gaming hubs lift premium ASPs. Digital Media Streamers trail but record a 12.54% CAGR as households add flexible dongles to older screens for app parity. Gaming consoles leverage cloud-gaming tie-ins and exclusive content to stay relevant, though native TV apps begin eroding the entry-level console base. Niche categories such as connected projectors win enthusiasts seeking portable cinema setups, and smart speakers grow through spatial audio pairings with TVs, underscoring multi-device synergy within the connected living room market.
Connected projectors and Blu-ray players together account for a single-digit share, catering to home-theater purists who value image size or uncompressed media. Smart lighting kits and soundbars integrate with TV picture modes to intensify immersion, strengthening the accessory layer around the connected living room market size. Device proliferation boosts demand for universal control hubs but amplifies interoperability pain points in regions where Matter rollouts remain uneven.


By Connectivity Technology: Wi-Fi Dominance Reinforced
Wi-Fi retained a 90.13% share of the connected living room market size in 2024, thanks to near-universal router penetration. Wi-Fi 6E adoption surges in North America and Western Europe as fiber rollouts exceed 1 Gbps household speeds. Early-adopter households embrace Wi-Fi 7 TV models capable of 8K streaming at negligible latency, creating a premium upgrade vector. Ethernet maintains relevance for hardcore gamers and professional creators requiring deterministic bandwidth, while Thread and Zigbee complement Wi-Fi by handling low-power sensors that enrich ambient experiences.
Bluetooth remains essential for audio peripherals, gamepads, and remote pairing. Cellular fallback via 5G routers gains momentum where fixed broadband lags, especially in parts of Africa and South Asia, broadening the connected living room market footprint. Hybrid chipsets combining Wi-Fi 7, Bluetooth 5.4, and Thread stack reduce bill-of-materials costs and simplify board layouts, benefiting mid-range SKUs.
By Operating System Platform: Tizen Leads Amid Android Acceleration
Samsung Tizen commanded 18.75% share in 2024 on the back of Samsung’s shipment scale, bundling Samsung TV Plus FAST channels and integrated shoppable-TV widgets. Android TV and Google TV accelerate at 12.86% CAGR as Google signs ODM deals and unveils Gemini AI voice search. LG webOS leverages ThinQ home-automation hooks and baked-in cloud gaming, preserving a loyal user base. Roku OS and Amazon Fire OS monetize heavily through ad inventory and first-party data, carving strong footholds in North America.
Hisense VIDAA and Whale OS power cost-optimized sets in Asia and Eastern Europe, exemplifying ongoing platform fragmentation. OS licensing to third-party brands blurs traditional lines: both Samsung and LG now ship Tizen and webOS reference boards to select partners, expanding connected living room market share but raising support complexity. AI overlays and cross-service search emerge as the next battleground, with privacy by design turning into a critical differentiator.
By Application: Streaming Dominates Gaming Growth
Video streaming and OTT services represented 63.54% usage time in 2024, cementing their role as primary living-room pastime. Growth stems from exclusive originals and sports streaming aimed at cord-cutters. Gaming and eSports apps grow at 10.65% CAGR as cloud gaming normalizes, bringing console-quality titles to any TV with a Bluetooth controller. Smart home control panes occupy a growing share of UI real estate, letting users adjust lighting, HVAC, and security without switching devices.
Interactive shopping turns TV screens into conversion engines, integrating QR codes and one-click purchase overlays that ride on retail-media demand. Video conferencing retains relevance for hybrid work and inter-generational calls, while multi-room audio extends playback to speakers and soundbars, enveloping households in synchronized soundscapes. These converging use cases amplify average daily viewing hours and reinforce the connected living room market trajectory.
Geography Analysis
Asia-Pacific accounted for 38.23% of global revenue in 2024, powered by China’s domestic oligopoly where seven local brands command 92% share. India’s connected living room market posts high-single-digit unit growth as Xiaomi, Samsung, and LG trade volume leadership, helped by sub-USD 400 average selling prices. Developed APAC clusters such as South Korea and Australia drive early Wi-Fi 6E TV upgrades and adopt cloud-gaming services at above-average rates.
North America leverages near-ubiquitous broadband and high subscription stacking, keeping ARPU elevated. CTV advertising grew 22.4% year-over-year, reinforcing platform monetization that subsidizes flagship devices. Europe balances premium adoption with regulatory oversight; right-to-repair rules and energy labels steer consumers toward longevity and efficiency. Japanese buyers favor domestic brands like Sony and Sharp, forcing foreign entrants to tailor UI language options and local tuner features.
The Middle East and Africa record the fastest CAGR at 11.89% as broadband infrastructure projects proliferate across Saudi Arabia, the United Arab Emirates, and Nigeria. Retail chains partner with telcos to bundle smart TVs with fiber packages, expanding connected living room market reach beyond early adopters. Latin America shows steady gains as currency stabilization in Brazil and Mexico improves consumer confidence; however, import duties still skew device mix toward locally assembled models. Collectively, geographic nuances require bespoke go-to-market playbooks that blend price tiers, content licensing, and after-sales networks.

Competitive Landscape
Competition is moderately fragmented, with top players leveraging brand equity, panel capacity, and software ecosystems to defend share against aggressive Chinese challengers. Samsung and LG focus on QD-OLED, miniLED, and AI processors to command premium ASPs while licensing Tizen and webOS to broaden platform reach. TCL and Hisense record double-digit shipment growth by using in-house fabs and partnering with regional distributors, steadily enlarging connected living room market penetration.
Advertising-led monetization reshapes strategic priorities. Vizio, Roku, and Amazon prioritize first-party data to maximize CPMs, pushing down hardware prices to grow addressable ad inventory. Apple explores an AI Home Display that fuses smart speaker, tablet, and TV functions, hinting at future convergence across Apple TV+, HomeKit, and Fitness+ ecosystems. White-space entrants such as Android TV operator-tier set-top vendors and pay-TV middleware providers target operators seeking differentiated UX for hybrid IPTV deployments.
Technology differentiation now centers on AI voice assistants, cross-device continuity, and sustainability credentials rather than pure display metrics. Vendors that excel at recurring revenue capture and open yet secure ecosystems are poised to consolidate share, while late adopters risk commoditization.
Connected Living Room Industry Leaders
Samsung Electronics Co., Ltd.
Apple Inc.
Roku, Inc.
Amazon.com, Inc.
Google LLC
- *Disclaimer: Major Players sorted in no particular order

Recent Industry Developments
- July 2025: Hisense debuted a 116-inch RGB miniLED UXQ TV, the first set to apply per-sub-pixel backlighting, challenging rival flagship displays.
- July 2025: Ocilion launched Android TV Operator-Tier set-top boxes aimed at European telcos, enabling customized UX and unified search.
- May 2025: Amazon unveiled Alexa+ devices with larger displays and on-device AI, broadening voice-first control across 140,000 compatible products.
- April 2025: LG natively integrated Xbox Cloud Gaming into webOS, letting subscribers play without consoles.


Global Connected Living Room Market Report Scope
| Smart TVs |
| Digital Media Streamers |
| Gaming Consoles |
| Set-Top Boxes and Hybrid STBs |
| Smart Speakers and Soundbars |
| Smart Lighting Systems |
| Smart Control Hubs and Universal Remotes |
| Connected Projectors and Blu-ray Players |
| Wi-Fi |
| Ethernet |
| Bluetooth |
| Zigbee / Thread / Matter |
| 5G / Cellular |
| Samsung Tizen |
| LG webOS |
| Android TV / Google TV OS |
| Roku OS |
| Amazon Fire OS |
| Apple tvOS |
| Hisense VIDAA |
| Other Operating System Platform |
| Video Streaming and OTT |
| Gaming and eSports |
| Smart Home Control and Automation |
| Interactive Shopping and T-Commerce |
| Video Conferencing and Remote Work |
| Multi-room Audio and Immersive Entertainment |
| North America | United States | |
| Canada | ||
| Mexico | ||
| Europe | Germany | |
| United Kingdom | ||
| France | ||
| Russia | ||
| Rest of Europe | ||
| Asia-Pacific | China | |
| Japan | ||
| India | ||
| South Korea | ||
| Rest of Asia-Pacific | ||
| Middle East and Africa | Middle East | Saudi Arabia |
| United Arab Emirates | ||
| Turkey | ||
| Rest of Middle East | ||
| Africa | South Africa | |
| Nigeria | ||
| Rest of Africa | ||
| South America | Brazil | |
| Argentina | ||
| Rest of South America | ||
| By Device Type | Smart TVs | ||
| Digital Media Streamers | |||
| Gaming Consoles | |||
| Set-Top Boxes and Hybrid STBs | |||
| Smart Speakers and Soundbars | |||
| Smart Lighting Systems | |||
| Smart Control Hubs and Universal Remotes | |||
| Connected Projectors and Blu-ray Players | |||
| By Connectivity Technology | Wi-Fi | ||
| Ethernet | |||
| Bluetooth | |||
| Zigbee / Thread / Matter | |||
| 5G / Cellular | |||
| By Operating System Platform | Samsung Tizen | ||
| LG webOS | |||
| Android TV / Google TV OS | |||
| Roku OS | |||
| Amazon Fire OS | |||
| Apple tvOS | |||
| Hisense VIDAA | |||
| Other Operating System Platform | |||
| By Application | Video Streaming and OTT | ||
| Gaming and eSports | |||
| Smart Home Control and Automation | |||
| Interactive Shopping and T-Commerce | |||
| Video Conferencing and Remote Work | |||
| Multi-room Audio and Immersive Entertainment | |||
| By Geography | North America | United States | |
| Canada | |||
| Mexico | |||
| Europe | Germany | ||
| United Kingdom | |||
| France | |||
| Russia | |||
| Rest of Europe | |||
| Asia-Pacific | China | ||
| Japan | |||
| India | |||
| South Korea | |||
| Rest of Asia-Pacific | |||
| Middle East and Africa | Middle East | Saudi Arabia | |
| United Arab Emirates | |||
| Turkey | |||
| Rest of Middle East | |||
| Africa | South Africa | ||
| Nigeria | |||
| Rest of Africa | |||
| South America | Brazil | ||
| Argentina | |||
| Rest of South America | |||


Key Questions Answered in the Report
How big is the connected living room market in 2025?
The connected living room market size is USD 59.48 billion in 2025 and is projected to reach USD 87.48 billion by 2030.
Which device category leads revenue?
Smart TVs lead with 48.44% revenue share in 2024 due to integrated displays and built-in streaming functions.
Which region grows the fastest through 2030?
The Middle East and Africa posts the fastest CAGR at 11.89%, spurred by infrastructure upgrades and rising disposable income.
Why is Wi-Fi 7 important for living room devices?
Wi-Fi 7’s high bandwidth and low latency enable simultaneous 4K/8K streams and cloud gaming without network congestion.
What is driving replacement cycles in mature markets?
Bundled streaming services and platform-exclusive features shorten TV replacement cycles from seven to roughly five years.
How are manufacturers offsetting lower hardware margins?
Brands increasingly rely on advertising, retail-media partnerships, and subscription revenue embedded in their proprietary operating systems.
Page last updated on:


