Virtual Fitting Room Market Size and Share
Market Overview
| Study Period | 2020 - 2031 |
|---|---|
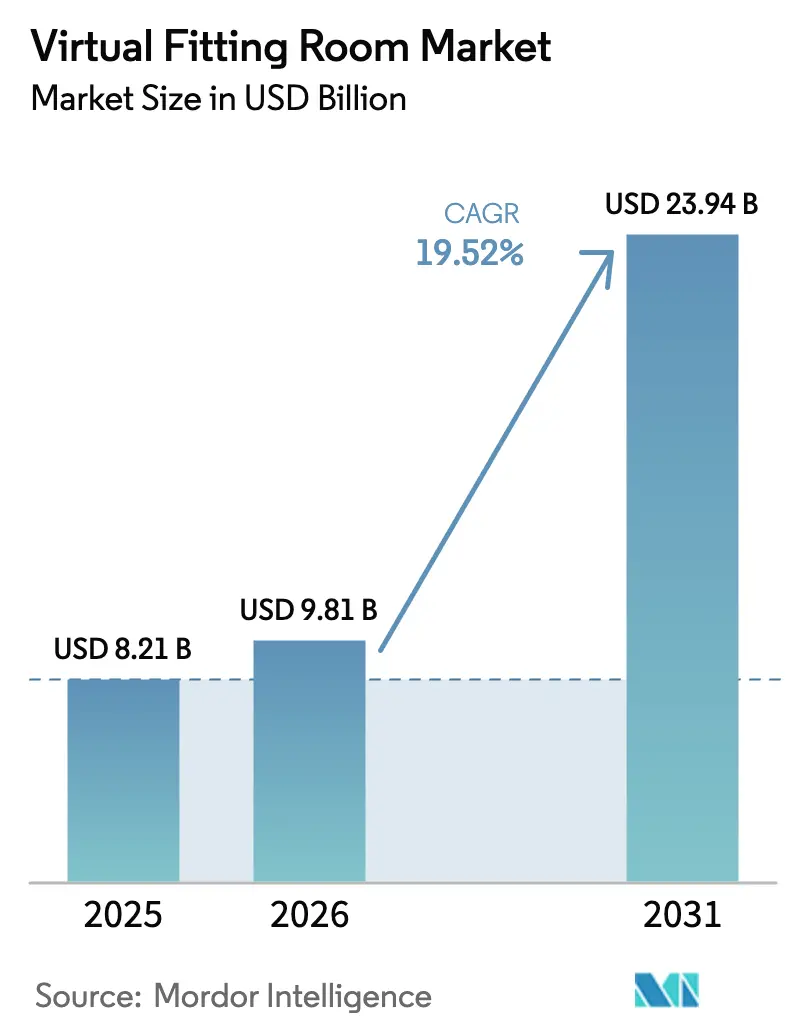
| Market Size (2026) | USD 9.81 Billion |
| Market Size (2031) | USD 23.94 Billion |
| Growth Rate (2026 - 2031) | 19.52% CAGR |
| Fastest Growing Market | Asia Pacific |
| Largest Market | North America |
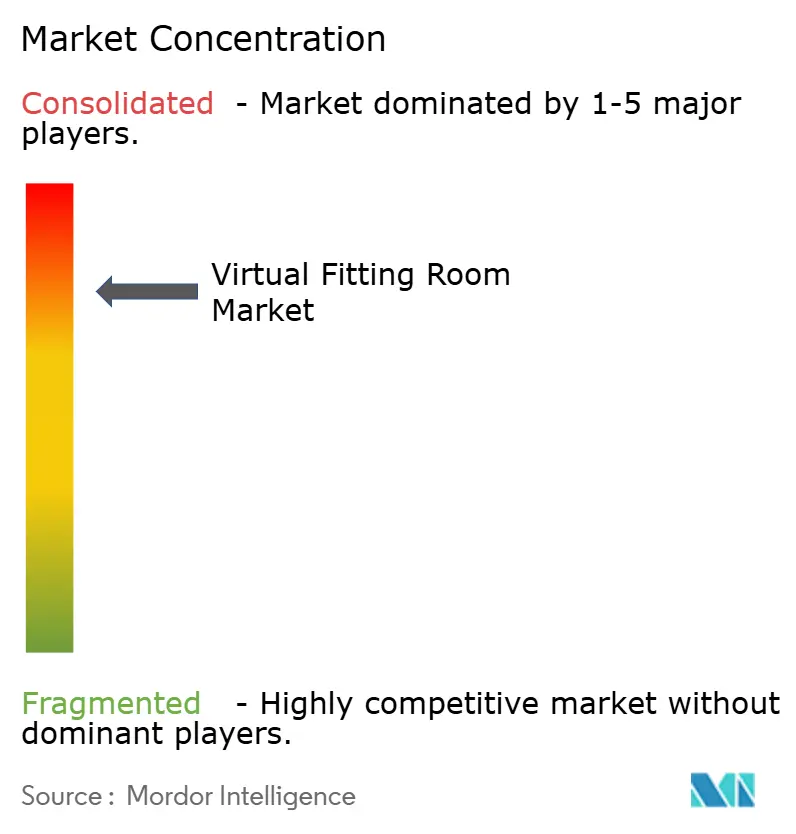
| Market Concentration | High |
Major Players*Disclaimer: Major Players sorted in no particular order Image © Mordor Intelligence. Reuse requires attribution under CC BY 4.0. | |
Virtual Fitting Room Market Analysis by Mordor Intelligence
Virtual fitting room market size in 2026 is estimated at USD 9.81 billion, growing from 2025 value of USD 8.21 billion with 2031 projections showing USD 23.94 billion, growing at 19.52% CAGR over 2026-2031. Rapid growth reflects retailers’ urgency to cut the USD 743 billion merchandise-returns bill and consumers’ demand for online shopping that feels as reliable as in-store try-ons. AI-driven size prediction, 3D avatars, and AR overlays help retailers trim return rates by up to 60% and lift conversion by 34% while generating rich data for retail-media networks. Software-led deployments dominate because cloud-hosted fit-recommendation engines scale quickly and avoid expensive in-store hardware. Asia-Pacific shows the fastest adoption as mobile-commerce booms and leading platforms add mixed-reality shopping apps for the Vision Pro headset.
Key Report Takeaways
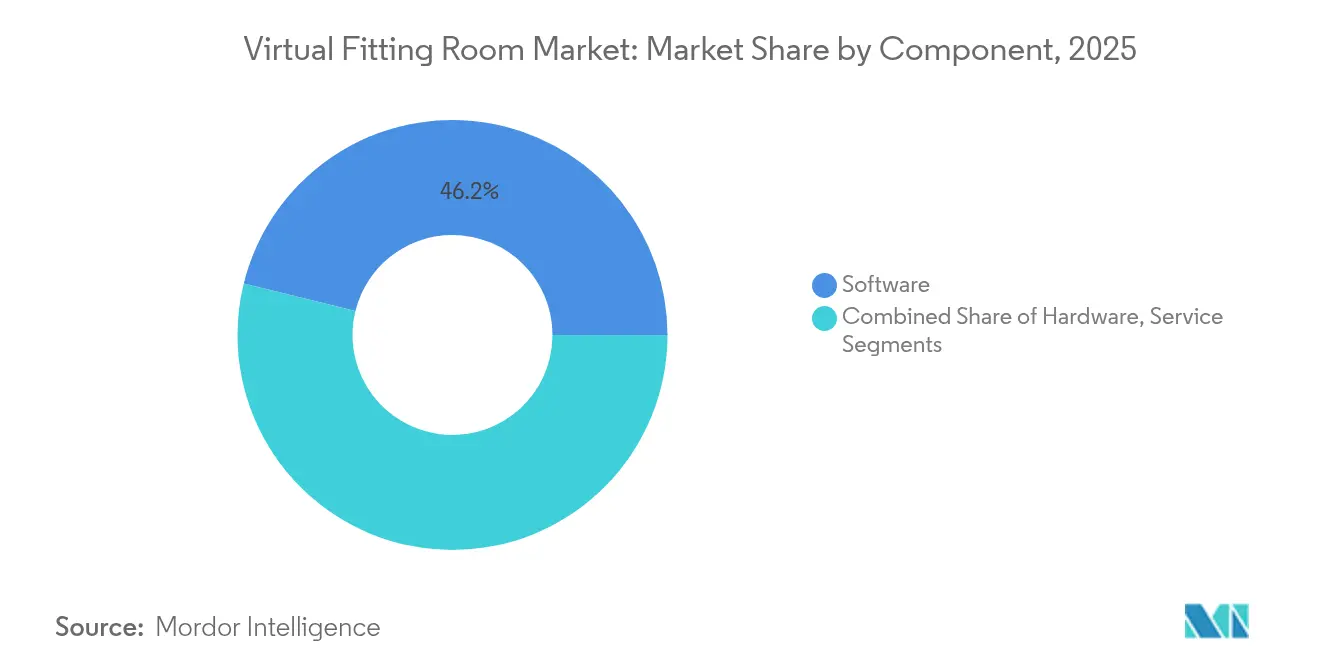
- By component, software held 46.15% of the virtual fitting room market share in 2025, while services are projected to expand at a 24.58% CAGR to 2031.
- By technology, web-based and mobile virtual stores commanded 60.92% revenue share in 2025; mixed-reality deployments inside physical outlets are forecast to grow at 27.04% CAGR to 2031.
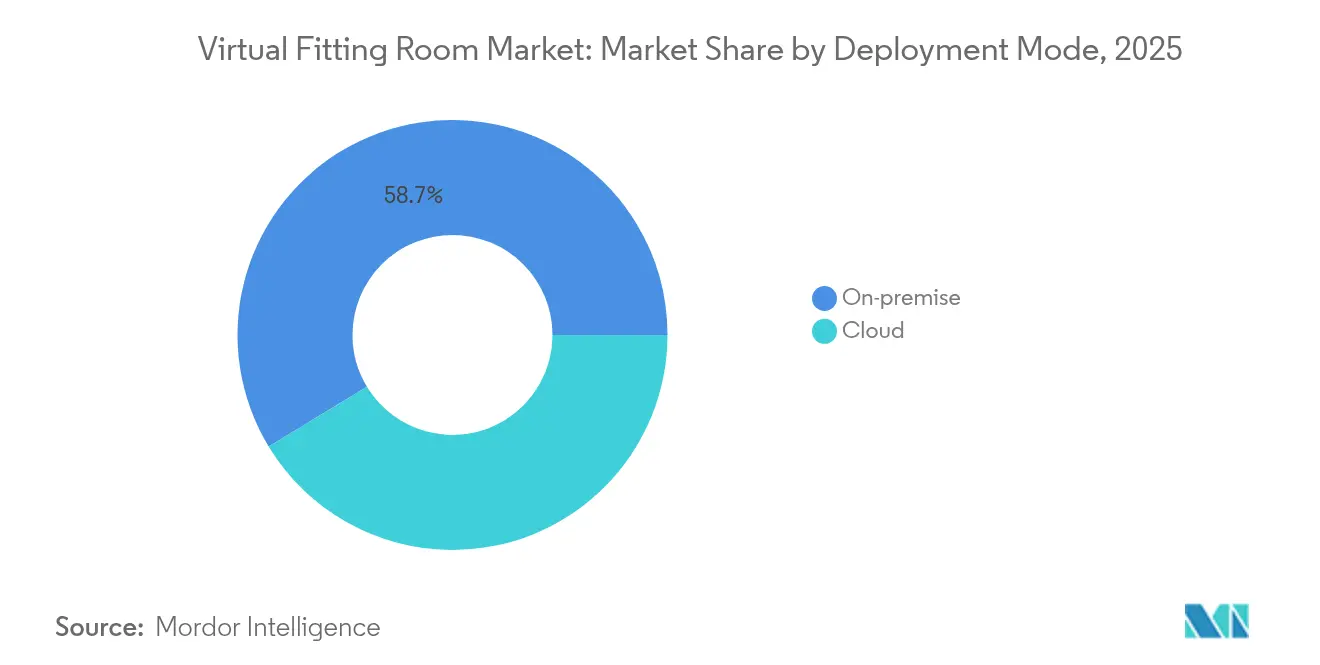
- By deployment model, on-premise solutions accounted for 58.67% of the virtual fitting room market size in 2025 and are set to record a 28.31% CAGR through 2031.
- By end user, physical stores captured 65.42% of the virtual fitting room market size in 2025, whereas virtual/e-commerce stores exhibit the highest projected CAGR at 24.41% to 2031.
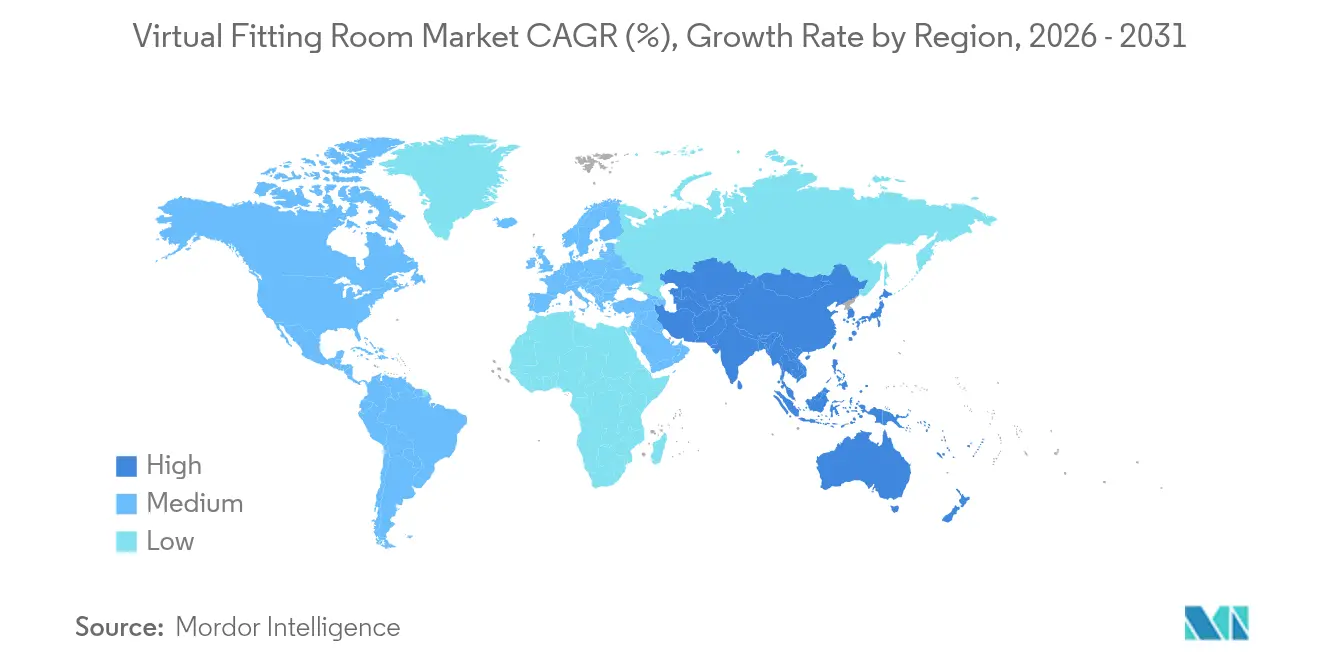
- By geography, North America led with 39.12% revenue share in 2025; Asia-Pacific is advancing at a 26.84% CAGR through 2031.
Note: Market size and forecast figures in this report are generated using Mordor Intelligence’s proprietary estimation framework, updated with the latest available data and insights as of 2026.
Global Virtual Fitting Room Market Trends and Insights
Drivers Impact Analysis*
| Driver | (~) % Impact on CAGR Forecast | Geographic Relevance | Impact Timeline |
|---|---|---|---|
| Rising demand for personalised online apparel shopping | +4.2% | North America, Europe, Global | Medium term (2-4 years) |
| Rapid penetration of AR and AI in fashion retail | +5.1% | North America, Asia-Pacific | Short term (≤2 years) |
| Surge in mobile-commerce transactions | +3.8% | Asia-Pacific, Global | Medium term (2-4 years) |
| E-commerce return-rate pressure for fit solutions | +4.9% | North America, Europe, Global | Short term (≤2 years) |
| Retail-media networks seeking data-rich engagement tools | +1.2% | North America, Europe, Emerging Asia-Pacific | Long term (≥4 years) |
| Generative-AI avatars unlocking plus-size and adaptive segments | +0.8% | Global | Long term (≥4 years) |
| Source: Mordor Intelligence | |||
Rising demand for personalised online apparel shopping
Eight in ten Hong Kong shoppers prefer stores that offer virtual try-ons, while 44% of US consumers have already used the feature and 69% of those users completed a purchase. True Fit’s Fashion Genome now serves 80 million active users across 29,000 brands and helped APL raise revenue by 2% while cutting returns 15%. Evidence shows that consumers increasingly reject generic experiences in favor of fit-specific recommendations that boost confidence and loyalty.
Rapid penetration of AR and AI in fashion retail
Google’s generative AI lets shoppers see garments draped over diverse body types. H&M’s smart-mirror deployment at its Soho flagship integrates AI-driven product recognition, tag scanning, and fitting-room assistance, improving conversion rates and in-store engagement, as the customers can use the interface to request different colors or sizes, check the product details, and get style recommendations. Japanese startup Makip improved conversion 1.2 times with 3D silhouettes.[1]Makip PR Team, “3D Silhouette Boosts Purchase Rate,” prtimes.jp True Fit reports 900% adoption growth on Shopify, and Amazon is beta-testing photorealistic try-ons. Better algorithms raise accuracy, fueling a flywheel of consumer trust and retailer investment.
Surge in mobile-commerce transactions
Zoff’s smartphone try-on boosted conversions 4-fold without raising return rates.[2]Augilo, “Virtual Mirror Try on Tech for E-commerce,” auglio.com Mobile-optimized engines from Reactive Reality generate USD 2.7 million in annual revenue by converting 2D snaps into 3D models. As handset cameras and on-device AI improve, retailers prioritise lightweight solutions that do not require special hardware or large data pipes.
E-commerce return-rate pressure for fit solutions
Return handling can reach 17% of prime costs and 72% of those costs stem from logistics. Precise fit tech can slash size-related returns by up to 80% and has already reduced returns 36% for Zeekit’s retail partners. Lower returns tie directly to sustainability targets by limiting wasteful reverse logistics and unsold stock.
Restraints Impact Analysis*
| Restraint | (≈) % Impact on CAGR Forecast | Geographic Relevance | Impact Timeline |
|---|---|---|---|
| High implementation and integration costs | -2.8% | Global | Short term (≤2 years) |
| Data-privacy concerns around body-scan analytics | -1.9% | Europe, North America | Medium term (2-4 years) |
| Lack of 3-D body-schema standards | -1.1% | Global | Long term (≥4 years) |
| Network-latency limits in emerging markets | -0.7% | Asia-Pacific, Middle East and Africa, South America | Medium term (2-4 years) |
| Source: Mordor Intelligence | |||
High implementation and integration costs
Retailers face upfront investments that average 17% of prime costs when rolling out body scanners, smart mirrors, and middleware. Complexity pushes many brands toward managed-service contracts, explaining the services segment’s.
Data-privacy concerns around body-scan analytics
Illinois’ BIPA and GDPR impose strict consent and retention rules, with non-compliance fines up to USD 1.0 million per incident.[3]Michael Vladeck, “Biometric Privacy Law and Retail,” smu.edu RedThread encrypts and deletes scans immediately after generating a 3D model to reassure consumers, yet varying global rules force multi-layer data governance and raise deployment hurdles.
*Our forecasts treat driver/restraint impacts as directional, not additive. The impact forecasts reflect baseline growth, mix effects, and variable interactions.
Segment Analysis
By Component: Software-led scalability attracts retailer
Software solutions contributed 46.15% of the virtual fitting room market share in 2025, supported by cloud-based fit engines that integrate with Shopify, Salesforce, and custom carts. Fit-prediction algorithms ingest purchase and return histories, then refine size advice in real time, raising unit economics for mid-market sellers. The services segment, expanding at 24.58% CAGR, mirrors retailers’ reliance on outside experts for API orchestration, data onboarding, and KPI tuning. Hardware remains niche but rising premium-store rollouts of smart mirrors demonstrate experiential value.
Smart mirrors at H&M and Superdry allow gesture-based outfit changes and sync with loyalty apps. Integration consultancies bundle computer-vision modules with sizing taxonomies, creating turnkey packages that shorten launch cycles from months to weeks. This evolution shows the virtual fitting room industry shifting from pilot tests toward repeatable enterprise blueprints.


By Technology: Mixed reality turns browsing into immersion
Web and app-based virtual stores represented 60.92% of revenue in 2025 given their device-agnostic reach and rapid code-push updates. Alibaba’s Taobao demo for Vision Pro highlights 3D product manipulation, adjustable lighting, and spatial audio that deepen engagement. Mixed-reality kiosks inside malls are forecast to grow at 27.04% CAGR because they bridge physical and digital shopping journeys.
Luxury brands use mixed-reality portals to livestream runway pieces that shoppers can scale and rotate at home, blurring marketing and commerce. Hybrid architectures that start with 2D photo dressing then escalate to 3D meshes keep compute costs low while satisfying power users who own spatial-computing headsets.
By Deployment Model: On-premise gains traction for data sovereignty
Large retailers preferred on-premise stacks for 58.67% of deployments in 2025, valuing direct control over biometric data. With tightening privacy laws, CIOs regard in-house hosting as insurance against third-party breaches. This preference drives a robust 28.31% CAGR as virtual fitting room market size expands across Fortune 500 apparel chains.
Smaller merchants lean toward SaaS subscriptions to conserve capex and tap continuous updates. Hybrid models appear, where body-scan processing occurs on local GPUs while asset libraries live in the cloud for uptime and content refreshes. Vendors answer security demands with ISO 27001 audits and zero-trust frameworks.
By End User: Stores weaponise experience, e-commerce prioritises ROI
Physical stores captured 65.42% of the virtual fitting room market size in 2025 as chains retrofit dressing rooms with AR mirrors that suggest accessories and gather fit feedback. These installations feed merchandising teams with SKU-level insight drawn from trial-to-purchase ratios. E-commerce pure-plays chase the 24.41% CAGR because every basis-point reduction in returns translates into shipping savings and lower landfill output.
J.Crew’s Vision Pro “Virtual Closet” lets shoppers style 3D mannequins with real inventory and share looks on SharePlay. As curbside pickup blurs lines between channels, omnichannel retailers deploy one algorithmic core that powers in-store kiosks and mobile carts alike, ensuring consistent fit logically.
Geography Analysis
North America commanded 39.12% of 2025 revenue owing to early adoption by Walmart, Amazon, and Macy’s that embed AR try-ons in apps and extend to eyewear, footwear, and apparel . High smartphone penetration, mature logistics, and venture funding encourage experimentation. Regulatory clarity around biometrics remains fluid yet manageable, keeping rollouts brisk.
Asia-Pacific drives the fastest 26.84% CAGR as mobile-first consumers embrace camera shopping on super-apps. Alibaba’s Vision Pro pilot, Japanese 3D silhouette engines, and Korean livestream shopping apps converge to normalize virtual fitting across price tiers. Government digital-commerce policies in China and India further accelerate uptake, and improving 5G coverage mitigates latency.
Europe balances innovation with privacy. Zalando’s body-measurement portal spans 14 markets and Levi’s categories, tailoring recommendations while respecting GDPR. French and Italian luxury houses explore mixed-reality runway commerce, yet many mid-sized retailers wait for pan-EU standards on 3D body schemas before large-scale investment. Emerging markets in MEA and Latin America trail due to bandwidth limitations but leapfrog via lightweight 2D solutions optimized for low-spec phones.

Competitive Landscape
True Fit controlled 62.70% of the size-and-fit engine sub-segment in 2024, leveraging its 350-million-SKU Fashion Genome to power recommendations for Nike, Gap, and Target. Fit Analytics held 12.36%, while Fits Me captured 8.92%. Despite this concentration, technology diversity invites entrants. 3DLOOK raised USD 10 million to refine smartphone scans for bespoke tailoring; Dopplr secured USD 750,000 to target circular-fashion rentals; Doji landed USD 14 million to fuse avatar social feeds with resale marketplaces.
M&A signals consolidation. Perfect Corp acquired Wannaby to add footwear try-ons; Zalando bought DeepAR to internalise AR IP; Snap invests in drape-simulation physics to keep Gen Z engaged. Vendors differentiate via accuracy benchmarks such as pixel-to-pixel garment overlay error rates under 3 mm, and by publishing verified ROI metrics showing 20-point NPS lifts or double-digit basket upticks.
Incumbents forge cloud alliances, True Fit deepened its Google Cloud pact to speed inference, while Amazon’s Machine Learning University open-sourced body-shape models to attract third-party sellers. Strategic thrusts converge on two axes as platform breadth, spanning apparel to accessories, and vertical specialisation, addressing plus-size, adaptive clothing, or sustainability scoring.
Virtual Fitting Room Industry Leaders
3DLOOK
AstraFit
True Fit Corporation
Metail
Zugara
- *Disclaimer: Major Players sorted in no particular order

Recent Industry Developments
- December 2024: Perfect Corp acquired Wannaby Inc. from Farfetch, enhancing its virtual try-on solutions for fashion, including shoes, bags, and apparel. The acquisition strengthens Perfect Corp’s AI-driven virtual fitting capabilities, enabling more personalized shopping experiences and supporting consolidation trends in the virtual fitting room market.
- October 2024: Zalando introduced body measurement technology integrated with its virtual fitting room, available in 14 European markets for Levi’s apparel.
- June 2024: H&M partnered with NeXR Technologies to develop a virtual fitting room solution, enabling customers to try on perfectly fitted outfits using 3D body scanning and AI-driven recommendations.


Global Virtual Fitting Room Market Report Scope
A Virtual Fitting Room (VFR) is a function that shows and visualizes a shopper's outfit without physically trying on and touching items. VFR utilizes Augmented Reality (AR) and Artificial Intelligence (AI).
The virtual fitting room market is segmented by component (hardware, software, services), by end-users (physical store, virtual store), by geography (North America, Europe, Asia-Pacific, Latin America, Middle East and Africa). The market sizes and forecasts are provided in terms of value (USD) for all the above segments.
| Hardware | Body Scanners |
| Smart Mirrors / Interactive Kiosks | |
| Software | Fit-Recommendation Engines |
| 3-D Avatar Creation Suites | |
| Services | Integration and Deployment |
| Managed Services |
| 2-D Image-Based |
| 3-D Model-Based |
| Augmented / Mixed Reality |
| Cloud |
| On-premise |
| Physical Stores |
| Virtual / E-commerce Stores |
| North America | United States | |
| Canada | ||
| Mexico | ||
| South America | Brazil | |
| Argentina | ||
| Rest of South America | ||
| Europe | United Kingdom | |
| Germany | ||
| France | ||
| Italy | ||
| Spain | ||
| Russia | ||
| Rest of Europe | ||
| Asia-Pacific | China | |
| Japan | ||
| India | ||
| South Korea | ||
| Australia and New Zealand | ||
| Rest of Asia-Pacific | ||
| Middle East and Africa | Middle East | Saudi Arabia |
| UAE | ||
| Turkey | ||
| Rest of Middle East | ||
| Africa | South Africa | |
| Nigeria | ||
| Rest of Africa | ||
| By Component | Hardware | Body Scanners | |
| Smart Mirrors / Interactive Kiosks | |||
| Software | Fit-Recommendation Engines | ||
| 3-D Avatar Creation Suites | |||
| Services | Integration and Deployment | ||
| Managed Services | |||
| By Technology | 2-D Image-Based | ||
| 3-D Model-Based | |||
| Augmented / Mixed Reality | |||
| By Deployment Model | Cloud | ||
| On-premise | |||
| By End-User | Physical Stores | ||
| Virtual / E-commerce Stores | |||
| By Geography | North America | United States | |
| Canada | |||
| Mexico | |||
| South America | Brazil | ||
| Argentina | |||
| Rest of South America | |||
| Europe | United Kingdom | ||
| Germany | |||
| France | |||
| Italy | |||
| Spain | |||
| Russia | |||
| Rest of Europe | |||
| Asia-Pacific | China | ||
| Japan | |||
| India | |||
| South Korea | |||
| Australia and New Zealand | |||
| Rest of Asia-Pacific | |||
| Middle East and Africa | Middle East | Saudi Arabia | |
| UAE | |||
| Turkey | |||
| Rest of Middle East | |||
| Africa | South Africa | ||
| Nigeria | |||
| Rest of Africa | |||


Key Questions Answered in the Report
What is the current size of the virtual fitting room market?
The virtual fitting room market is valued at USD 9.81 billion in 2026.
How fast is the market expected to grow?
It is projected to register a 19.52% CAGR between 2026 and 2031, reaching USD 23.94 billion.
Which component segment leads the market?
Software solutions led with a 46.15% share in 2025 owing to scalable fit-recommendation engines.
Why are retailers investing in this technology?
Retailers use virtual fitting to cut return rates by up to 60% and boost conversions by 34%, reducing the USD 743 billion global returns burden.
Page last updated on:


