Commercial Lighting Control Market Size and Share
Market Overview
| Study Period | 2020 - 2031 |
|---|---|
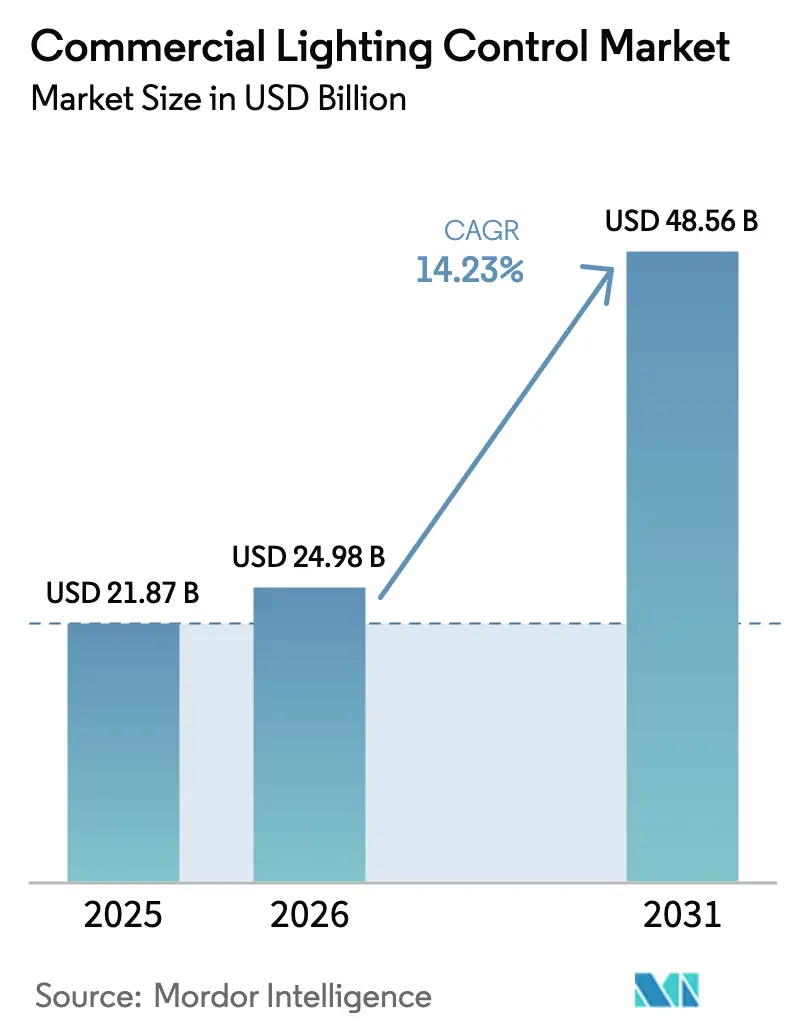
| Market Size (2026) | USD 24.98 Billion |
| Market Size (2031) | USD 48.56 Billion |
| Growth Rate (2026 - 2031) | 14.23% CAGR |
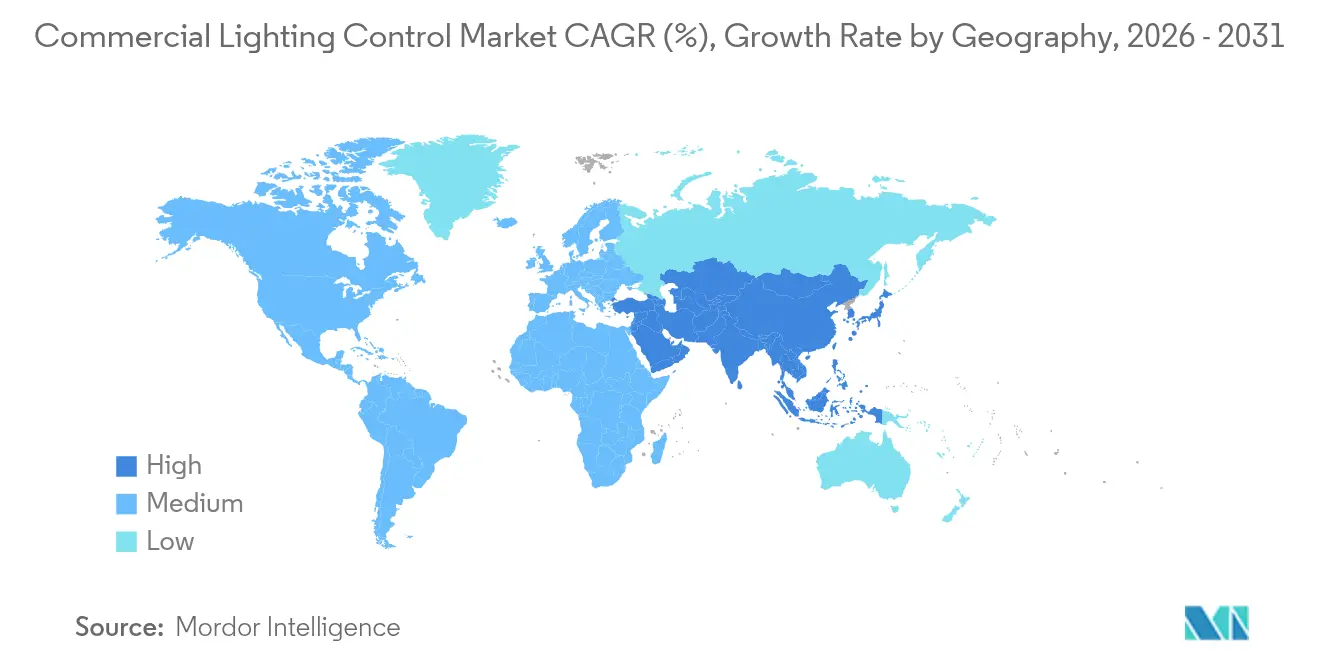
| Fastest Growing Market | Asia Pacific |
| Largest Market | Asia Pacific |
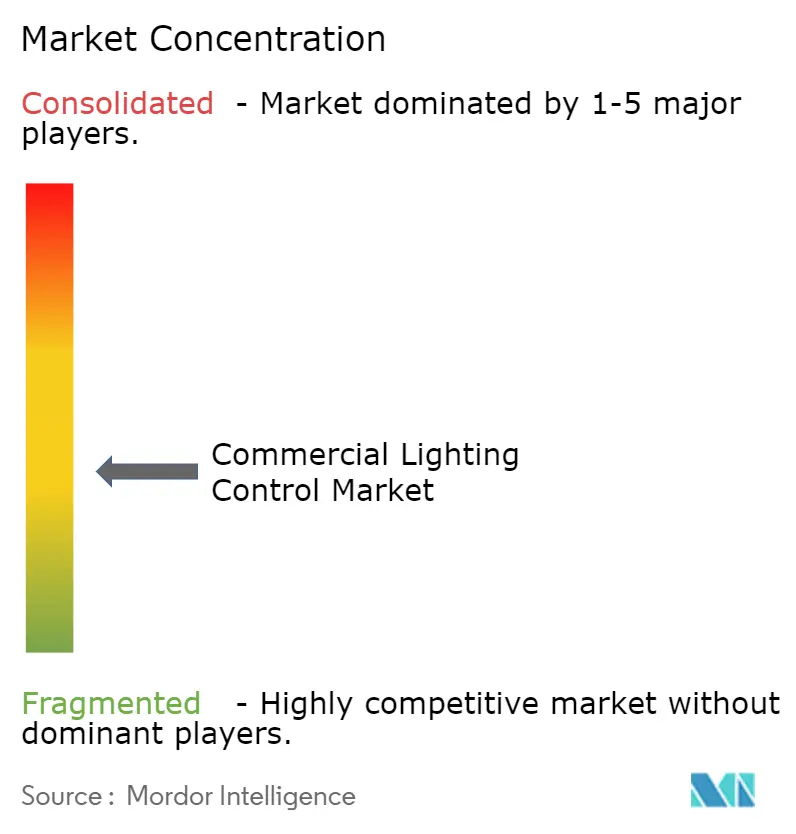
| Market Concentration | Medium |
Major Players *Disclaimer: Major Players sorted in no particular order Image © Mordor Intelligence. Reuse requires attribution under CC BY 4.0. | |
Commercial Lighting Control Market Analysis by Mordor Intelligence
Commercial lighting control market size in 2026 is estimated at USD 24.98 billion, growing from 2025 value of USD 21.87 billion with 2031 projections showing USD 48.56 billion, growing at 14.23% CAGR over 2026-2031. Regulatory pressure for energy-efficient buildings, corporate net-zero commitments, and rapid digitization of commercial real estate continue to propel demand. Power-over-Ethernet (PoE) cabling is removing installation hurdles and lowering labor costs, while networked systems that merge lighting with occupancy analytics are unlocking granular data on space utilization. Asia Pacific leads current adoption and is also the fastest-growing region, helped by large-scale retrofits that convert aging offices into net-zero assets. Easing semiconductor shortages are favoring hardware deliveries, yet protocol fragmentation still inflates integration costs and slows some projects.
Key Report Takeaways
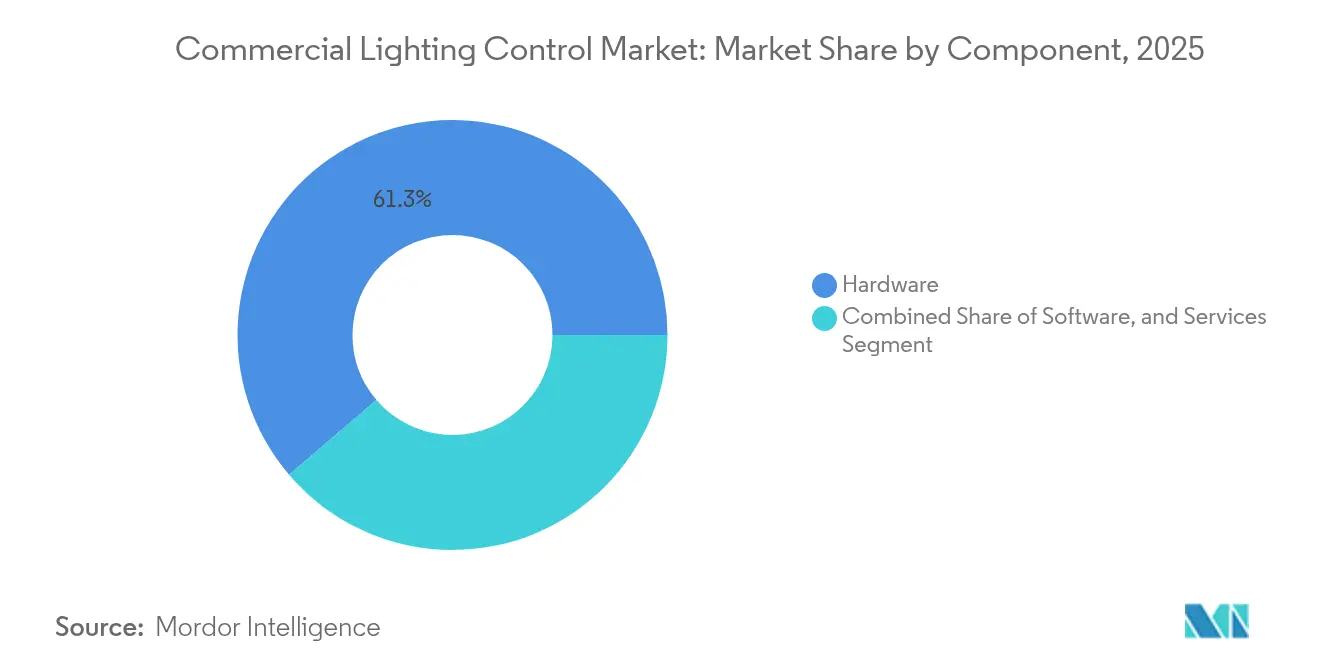
- By component, hardware held 61.25% of the commercial lighting control market share in 2025; services post the highest 14.2% CAGR through 2031.
- By communication protocol, wired systems commanded 57.20% of the commercial lighting control market size in 2025, while wireless protocols expand at 14.9% CAGR.
- By installation type, new construction accounted for 54.20% revenue in 2025; retrofit projects lead growth at 14.2% CAGR thanks to stricter energy codes.
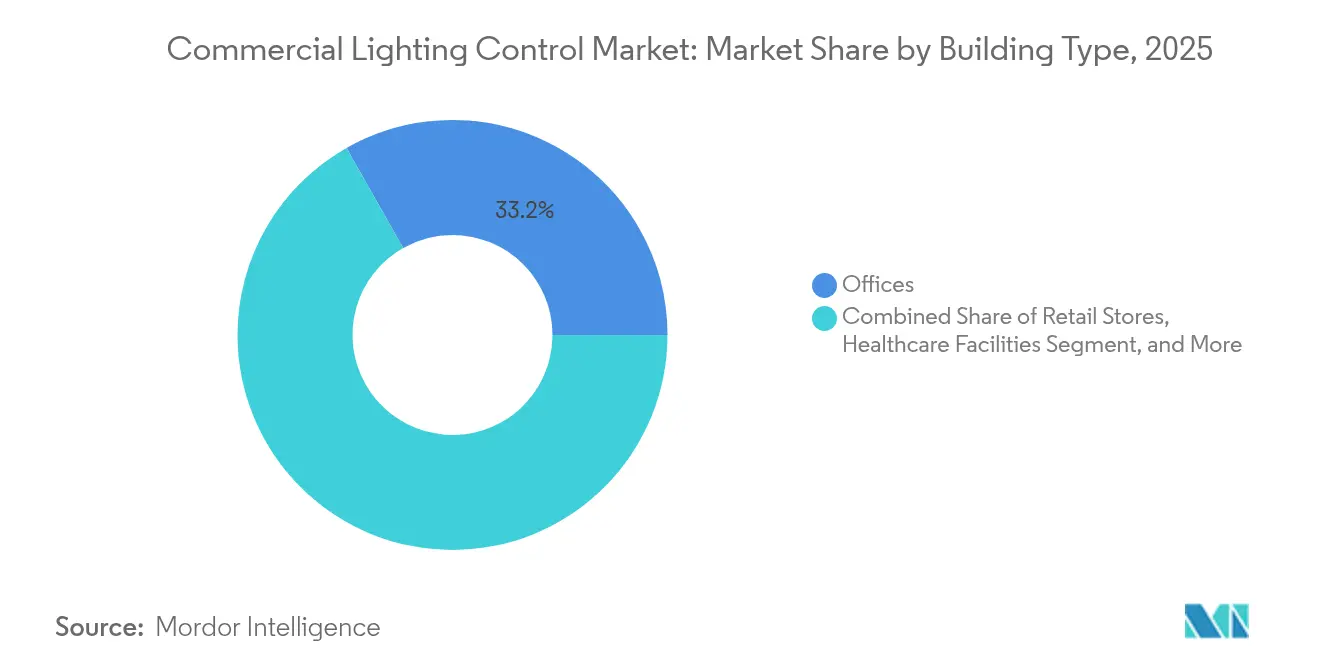
- By building type, office buildings led with 33.20% share of the commercial lighting control market size in 2025; hospitality and leisure buildings advance at 15.7% CAGR.
- By control strategy, networked systems already capture 66.30% share, and enterprise/cloud solutions rise at 16.9% CAGR.
- By geography, Asia Pacific led with 33.70% revenue share of the commercial lighting control market in 2025, while it is also projected to expand at an 17.6% CAGR to 2031.
Note: Market size and forecast figures in this report are generated using Mordor Intelligence’s proprietary estimation framework, updated with the latest available data and insights as of 2026.
Global Commercial Lighting Control Market Trends and Insights
Drivers Impact Analysis*
| Driver | (~) % Impact on CAGR Forecast | Geographic Relevance | Impact Timeline |
|---|---|---|---|
| Mandatory building energy codes | +3.1% | North America & EU | Medium term (2-4 years) |
| Corporate net-zero office retrofits | +2.8% | Asia Pacific & Oceania | Medium term (2-4 years) |
| Power-over-Ethernet infrastructure | +2.6% | Global (early uptake in North America) | Medium term (2-4 years) |
| Lighting–occupancy analytics convergence | +2.2% | North America, Europe, advanced APAC | Long term (≥ 4 years) |
| Human-centric lighting for hybrid work | +1.9% | Developed markets worldwide | Medium term (2-4 years) |
| Utility-funded incentive programs | +1.6% | North America & Nordics | Short term (≤ 2 years) |
| Source: Mordor Intelligence | |||
Mandatory Building Energy Codes Accelerating Networked Controls Adoption
The 2024 International Energy Conservation Code now requires continuous dimming and daylight-responsive controls for most retrofit work, forcing owners to select networked solutions even on small projects. Field studies show energy savings of 30–40% over baseline retrofits, and California’s 2025 code draft lowers connected lighting load limits further, expanding coverage to classrooms and other small rooms.[1]Gary Meshberg, “An Updated Code: Keeping an Eye on the 2024 IECC,” Lighting Design & Application, read.nxtbook.com Component suppliers that can prove out-of-the-box compliance are seeing specification preference from architects and ESCOs.
Corporate Net-Zero Retrofits in Asia & Oceania Office Campuses
Sydney and other gateway cities face a projected 79% shortage of net-zero office stock within five years. Property owners therefore retrofit existing towers, prioritizing advanced lighting controls because they deliver quick payback and underpin deeper smart-building upgrades. Such retrofits cut operating costs 16.9% while raising rental premiums up to 31%.[2]Jones Lang LaSalle, “Cities Brace for Shortage of Net-Zero Carbon Office Stock,” jll.com ABB projects the region’s cumulative opportunity for net-zero building upgrades at USD 43 trillion by 2070.[3]ABB, “The USD 43 Trillion Opportunity: Why Net-Zero Buildings Are Smart Business,” new.abb.com
Power-over-Ethernet Infrastructure Enabling Low-Voltage Lighting Control
IEEE 802.3bt delivers up to 90 W, allowing PoE fixtures, sensors, and switches to share one cable for power and data. Cisco field tests indicate PoE cuts installation complexity by near 50% compared with line-voltage wiring.[4]Cisco, “Low-Voltage PoE Lighting Design Guide,” cisco.com Deloitte’s headquarters retrofits confirmed lower cabling cost and faster space-reconfiguration cycle.
Convergence of Lighting Controls with Occupancy Analytics
Lighting networks increasingly embed environmental and presence sensors, feeding building analytics platforms that optimize layouts and maintenance schedules. In healthcare, dynamic tuning of light levels against real-time occupancy improves patient rest and nursing efficiency. Retail pilots show 12–15% uplifts in shopper engagement when merchandisers refine aisle lighting using traffic heat maps. Vendors able to bundle actionable dashboards with controls are gaining stickiness in renewals.
Restraints Impact Analysis*
| Restraint | (~) % Impact on CAGR Forecast | Geographic Relevance | Impact Timeline |
|---|---|---|---|
| Interoperability across protocols | −2.1% | Global | Medium term (2-4 years) |
| Commissioning-skilled labor shortage | −1.4% | Middle East & Africa | Short term (≤ 2 years) |
| Cyber-security risks in wireless backbones | −1.2% | North America & Europe | Medium term (2-4 years) |
| Inflation-driven CAPEX delays for SMB retrofits | −1.1% | South America & other emerging markets | Short term (≤ 2 years) |
| Source: Mordor Intelligence | |||
Interoperability Issues from Fragmented Protocol Standards
Dozens of regional or proprietary protocols persist, compelling manufacturers to maintain multi-stack firmware and raising design costs. While ANSI/NEMA C137.10 and the Matter initiative aim for harmonization, adoption remains partial. Building managers therefore face integration risk, delaying upgrades or forcing single-vendor lock-in.
Commissioning-Skilled Labor Shortage in MEA
Advanced systems require specialists adept in networking and sensor calibration, yet the Middle East and Africa lack adequate training pipelines. Contractors often price a 30–40% premium to hedge commissioning uncertainty, prolonging project ROIs. Studies show poorly commissioned systems yield only 60–70% of theoretical energy savings. Regional trade groups are launching fast-track courses, but near-term capacity gaps persist.
*Our forecasts treat driver/restraint impacts as directional, not additive. The impact forecasts reflect baseline growth, mix effects, and variable interactions.
Segment Analysis
By Component: Services Scale Up Optimization Demand
The commercial lighting control market size for hardware reached USD 13.39 billion in 2025, equivalent to 61.25% of total revenue. Services, though smaller, expand at 14.2% CAGR as owners recognize that expert commissioning unlocks an additional 15–20% energy reduction beyond equipment savings. Software platforms add remote diagnostics and AI-based fault detection, pushing recurring revenue for vendors.
Escalating building integration needs position design-engineering consultancies as critical partners. Vendors like Signify already derive 30% of sales from connected offerings, signaling a pivot from hardware margins toward data-driven services. As large portfolios standardize on common cloud dashboards, multi-year support contracts secure predictable income streams.


By Communication Protocol: Wireless Momentum Builds
Wired DALI networks held a 57.20% slice of the commercial lighting control market in 2025. Yet wireless shipments post 14.9% CAGR, driven by retrofit economics and evolving Bluetooth Mesh, Zigbee, and Thread ecosystems. DALI + now transports familiar commands across IP or wireless media, bridging legacy and emerging systems.
PoE blurs traditional wiring categories by combining data and low-voltage power. It retains cabled reliability while simplifying topology, boosting share in tenant-improvement projects. Energy-harvesting switch technology from EnOcean further cuts battery maintenance, reinforcing wireless ROI in high-ceiling applications.
By Installation Type: Retrofits Outpace New Builds
Retrofit activity captures 45.80% of 2025 revenue but grows faster than new construction, reflecting code-driven replacements of luminaires that now trigger control upgrades. The commercial lighting control market share for retrofit projects benefits from 18-24-month paybacks and improved 179D tax deductions. Wireless kits minimize tenant disruption, while fixture-integrated sensors speed approvals.
In contrast, greenfield projects still specify centralized networks from day one, especially for campus and datacenter builds that value unified dashboards. Long design cycles, however, can expose them to protocol changes, making modularity paramount.
By Building Type: Hospitality Prioritizes Experience
Office stock generated 33.20% of 2025 revenue, but hotels and leisure venues advance at 15.7% CAGR. Operators deploy color-tunable luminaires and scene presets that elevate guest comfort while trimming energy budgets. Verified studies show human-centric lighting boosts staff productivity 6% and creativity 15% in hybrid offices.
Retail chains pair lighting with shopper analytics, guiding product placement in real time. Healthcare facilities require circadian-supportive lighting to aid recovery and nurse alertness, forcing vendors to meet tight glare and flicker standards.
By Control Strategy: Cloud Platforms Lead Integration
Networked solutions already dominate 66.30% of revenue, and enterprise cloud architectures record a 16.9% CAGR. AI modules forecast occupancy and modulate brightness, integrating seamlessly with HVAC for holistic demand response. The commercial lighting control market size linked to cloud services is expanding as campuses aim for portfolio-wide dashboards.
Stand-alone sensors still serve budget renovations, but falling gateway costs and easier commissioning tilt preferences toward room-level networks. Continuous dimming mandated by codes accelerates this shift because single-purpose switches cannot deliver the required granularity.
Geography Analysis
Asia Pacific accounts for 33.70% of global revenue in 2025 and posts an 17.6% CAGR through 2031. Accelerated urbanization, combined with a shortfall in certified net-zero offices, drives aggressive retrofits where lighting controls are the first capital-light intervention. Government carbon-neutral roadmaps and expansive supply-chain investments further stimulate demand.
North America ranks second. The updated 179D deduction plus USD 13.5 billion in DOE efficiency grants lower project paybacks and popularize advanced controls, especially in PoE-enabled campuses Active utility rebates for networked systems reinforce adoption. Europe follows, propelled by the EU Green Deal and stringent building performance standards. Public-sector upgrades lead specification volume, ensuring steady demand for open-protocol solutions. The Middle East and Africa grow from a smaller base but are constrained by scarce commissioning talent. Training alliances are emerging, yet near-term project pipelines remain cautious. South America confronts inflation-driven CAPEX delays, stalling smaller business retrofits, although policy clarity could unlock latent potential in the medium term.
Mordor Intelligence provides coverage of the commercial lighting control market across other key regional markets, including North America, each with their regulatory frameworks and demand patterns.

Competitive Landscape
The commercial lighting control market displays moderate concentration. Tier-one players leverage global channels and full-stack portfolios, while niche entrants differentiate through specialized software or vertical know-how. Acuity Brands’ 2024 acquisition of QSC integrates AV with lighting controls, illustrating convergence trends that favor solution breadth. Signify continues to pivot toward connected lighting, now 30% of its turnover, backed by AI investment and 3D-printed fixtures.
IT firms such as Cisco are seeding PoE ecosystems, challenging traditional lighting vendors on digital expertise. Standardization efforts by the DALI Alliance intensify platform competition by reducing lock-in advantages and encouraging multi-vendor tendering. The race now centers on cloud analytics and seamless BMS integration rather than hardware cost alone.
Channel partnerships remain critical. Distributors increasingly bundle commissioning services, while software start-ups license APIs to OEMs to reach volume. Strategic consolidation is expected to continue as firms seek scale to fund protocol compliance and AI feature roadmaps.
Commercial Lighting Control Industry Leaders
Signify N.V.
Honeywell International Inc.
General Electric Lighting
Infineon Technologies AG
Schneider Electric SE
- *Disclaimer: Major Players sorted in no particular order

Recent Industry Developments
- May 2025: Synapse Wireless integrated its SimplySnap outdoor platform with Lutron Athena, enabling unified interior-exterior lighting control for campuses
- April 2025: DALI Alliance announced winners of the 2024/2025 DALI Lighting Awards, highlighting progress in open-standard commercial solutions.
- March 2025: Signify disclosed that connected lighting now spans 8% of the installed base, underscoring ongoing digital transition.
- January 2025: Legrand reported datacenter activity reaching 20% of revenue, with energy-efficient infrastructure including advanced controls as a strategic focus.


Research Methodology Framework and Report Scope
Market Definitions and Key Coverage
Our study views the commercial lighting control market as all hardware, embedded software, and cloud services that sense, dim, switch, schedule, or network luminaires in non-residential buildings. Typical devices include LED drivers, gateways, occupancy and daylight sensors, and supervisory dashboards that integrate with building management systems.
Scope exclusion: fixtures, lamps, or building-wide automation platforms sold without dedicated lighting control functionality remain outside this assessment.
Segmentation Overview
- By Component
- Hardware
- LED Drivers
- Sensors
- Switches and Dimmers
- Relay Units
- Gateways
- Luminaires with Integrated Controls
- Software
- On-premise Platforms
- Cloud-based Platforms
- Services
- Design and Engineering
- Installation and Integration
- Maintenance and Support
- Consulting and Training
- Hardware
- By Communication Protocol
- Wired
- DALI
- KNX
- PLC
- PoE
- Wireless
- Zigbee
- Bluetooth/BLE
- Wi-Fi
- Thread
- EnOcean
- Wired
- By Installation Type
- New Construction
- Retrofit
- By Building Type
- Offices
- Retail Stores
- Hospitality and Leisure
- Healthcare Facilities
- Educational Institutions
- Industrial and Warehouses
- Transportation Hubs (Airports, Rail)
- Sports and Entertainment Venues
- By Control Strategy
- Stand-Alone Controls (Wall Dimmers, Occupancy Sensors)
- Networked Lighting Control Systems
- Room-level
- Building-level
- Enterprise/Cloud
- By Geography
- North America
- United States
- Canada
- Mexico
- Europe
- Germany
- United Kingdom
- France
- Italy
- Spain
- Russia
- Rest of Europe
- Asia-Pacific
- China
- Japan
- South Korea
- India
- South East Asia
- Rest of Asia-Pacific
- South America
- Brazil
- Argentina
- Rest of South America
- Middle East and Africa
- Middle East
- United Arab Emirates
- Saudi Arabia
- Qatar
- Rest of Middle East
- Africa
- South Africa
- Nigeria
- Kenya
- Rest of Africa
- Middle East
- North America
Detailed Research Methodology and Data Validation
Primary Research
Mordor analysts interviewed facility managers, energy-service contractors, sensor OEM engineers, and regional code officials across North America, Europe, and Asia Pacific. These exchanges clarified retrofit uptake rates, average selling prices, protocol preferences, and commissioning pain points that secondary data could not capture.
Desk Research
We started with public datasets from sources such as the US Department of Energy, Eurostat construction indices, the International Energy Agency, and LightingEurope. Trade flows from UN Comtrade, patent trends on lighting protocols examined through Questel, and peer-reviewed IEEE papers on wireless mesh standards enriched the technical baseline. Company filings, investor presentations, and press releases were screened through D&B Hoovers and Dow Jones Factiva to benchmark supplier revenues and project pipelines. The sources listed illustrate the breadth of material consulted, yet many additional references fed into our evidence base.
Market-Sizing & Forecasting
A top-down model begins with new commercial floor space completions and existing stock earmarked for retrofits, which are then multiplied by regional control penetration rates derived from codes and primary interviews. Results are cross-checked through sampled bottom-up roll-ups of vendor revenues, channel checks, and ASP × unit estimates before fine-tuning totals. Key variables include LED luminaire price erosion, Title 24 and IECC code adoption timelines, PoE port shipments, sensor attach rates, and corporate net-zero retrofit targets. A multivariate regression projects each driver forward, while scenario analysis stress-tests price and uptake assumptions. Data gaps in supplier rolls are bridged with conservative imputation based on nearest-neighbor averages and verified with experts.
Data Validation & Update Cycle
Model outputs pass variance and anomaly checks against independent energy intensity metrics, followed by dual-analyst review. We refresh the dataset each year and issue interim updates when material events, such as landmark code revisions, occur. A final validation sweep is completed immediately before publication.
Why Mordor's Commercial Lighting Control Baseline Commands Reliability
Published values differ because providers select unlike scopes, currencies, and refresh cadences. Component mix, inclusion of software subscriptions, and retrofit eligibility often drive the widest gaps.
Benchmark comparison
| Market Size | Anonymized source | Primary gap driver |
|---|---|---|
| USD 21.87 B (2025) | Mordor Intelligence | - |
| USD 9.10 B (2025) | Global Consultancy A | Excludes cloud and services, counts hardware only |
| USD 42.78 B (2025) | Trade Journal B | Blends residential controls and broader smart-home devices |
The comparison shows that once residential devices or service revenues are added or removed, totals swing widely. Mordor's disciplined component list, dual research stream, and annual refresh give decision-makers a balanced, transparent baseline that can be retraced to clear variables and repeatable steps.


Key Questions Answered in the Report
What is the current size of the commercial lighting control market?
The commercial lighting control market stands at USD 24.98 billion in 2026.
How fast will the commercial lighting control market grow?
T is forecast to expand at a 14.23% CAGR, reaching USD 48.56 billion by 2031.
Which region leads the commercial lighting control market?
Asia Pacific holds 33.70% of global revenue and grows fastest at 17.6% CAGR.
Why are retrofit projects gaining traction?
Updated energy codes now require controls even for minor luminaire changes, and incentives like the U.S. 179D deduction cut payback to under two years.
Which communication protocols are most popular?
DALI dominates wired installations, while Bluetooth Mesh, Zigbee, and Thread drive wireless growth at 14.9% CAGR.
How are vendors addressing interoperability issues?
Industry groups such as the DALI Alliance and the Connectivity Standards Alliance promote open specifications, while manufacturers add multi-protocol gateways to ease integration.
Page last updated on:


