School Information Management System Market Size and Share
Market Overview
| Study Period | 2020 - 2031 |
|---|---|
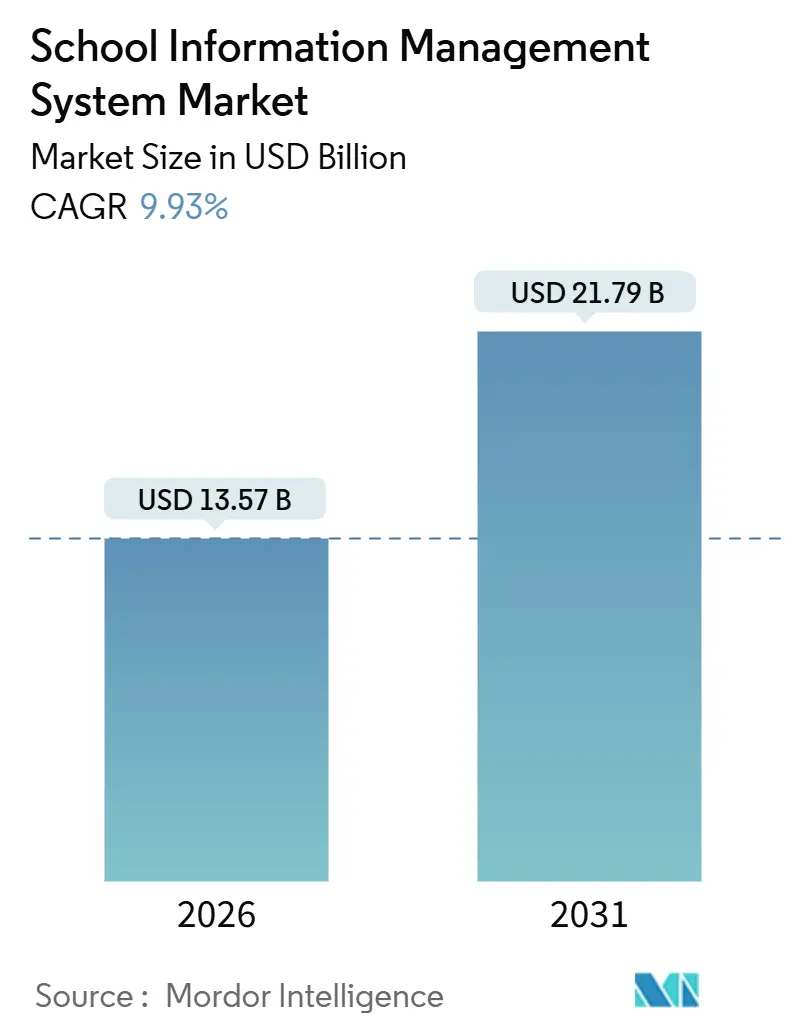
| Market Size (2026) | USD 13.57 Billion |
| Market Size (2031) | USD 21.79 Billion |
| Growth Rate (2026 - 2031) | 9.93% CAGR |
| Fastest Growing Market | Asia Pacific |
| Largest Market | North America |
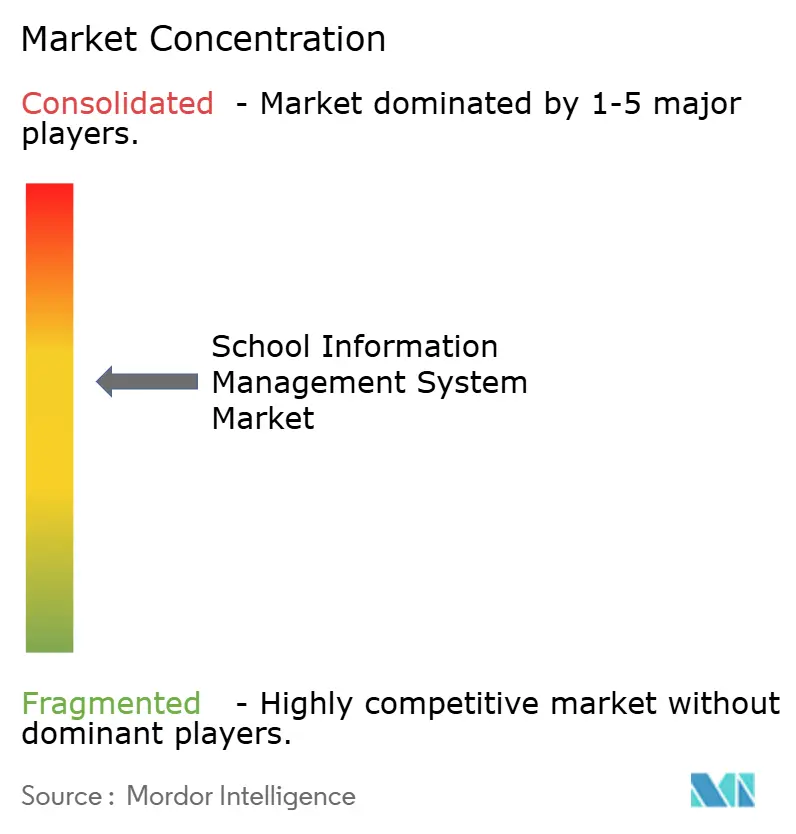
| Market Concentration | Medium |
Major Players *Disclaimer: Major Players sorted in no particular order Image © Mordor Intelligence. Reuse requires attribution under CC BY 4.0. | |
School Information Management System Market Analysis by Mordor Intelligence
The School Information Management System market size is valued at USD 13.57 billion in 2026 and is projected to reach USD 21.79 billion by 2031, reflecting a 9.93% CAGR. Mandatory digital-accountability frameworks, tighter links between public funding and data transparency, and the need to curb cybersecurity liability are redefining procurement priorities. Institutions worldwide now rank seamless interoperability ahead of feature depth, favoring platforms that can surface real-time records for regulators and parents alike. Cloud deployment models dominate because districts prefer elastic infrastructure to heavy capital expenditures, yet the steepest growth arises in academic analytics modules that help schools retain students, rather than merely automating back-office tasks. Services revenue is expanding faster than software subscriptions as institutions realize that implementation, training, and custom integrations consume roughly half of total ownership costs. Regionally, North America currently holds the largest share, but Asia Pacific is leading the growth charts as demographic scales meet assertive digitization mandates.
Key Report Takeaways
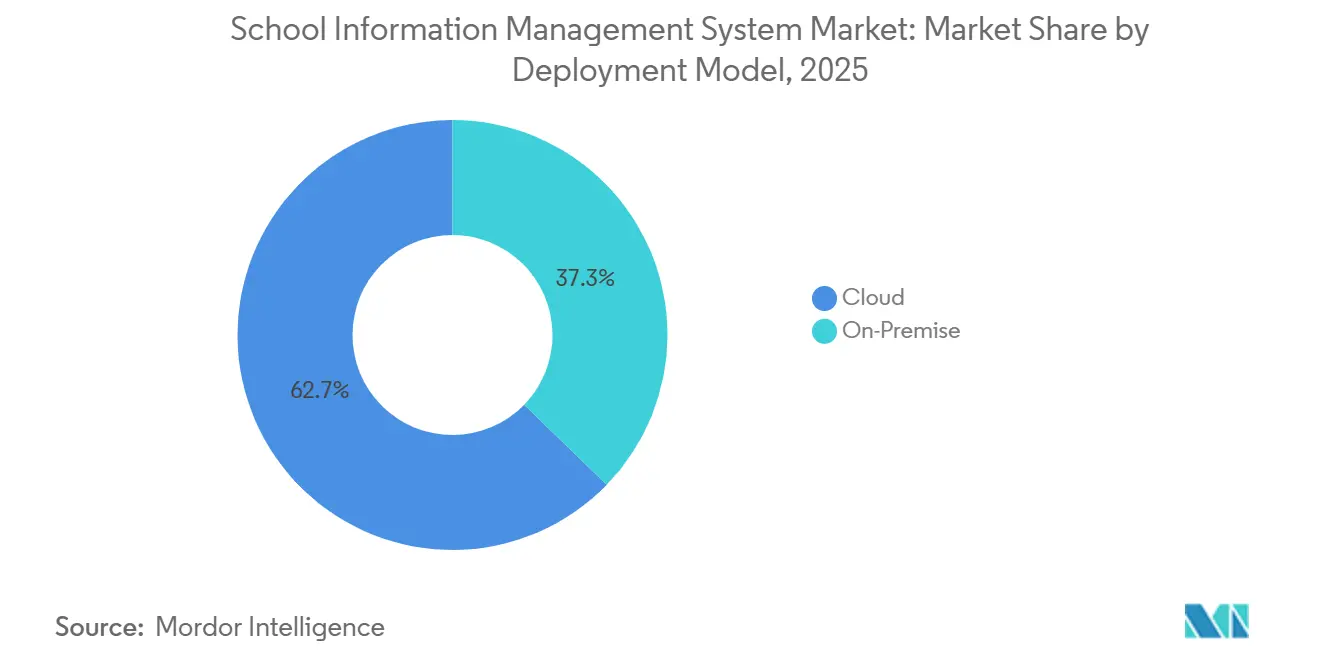
- By deployment model, cloud captured 62.73% of the School Information Management System market share in 2025 while sustaining a 10.16% CAGR through 2031.
- By application, administration led with a 39.26% revenue share in 2025, whereas academics are advancing at a 10.67% CAGR to 2031.
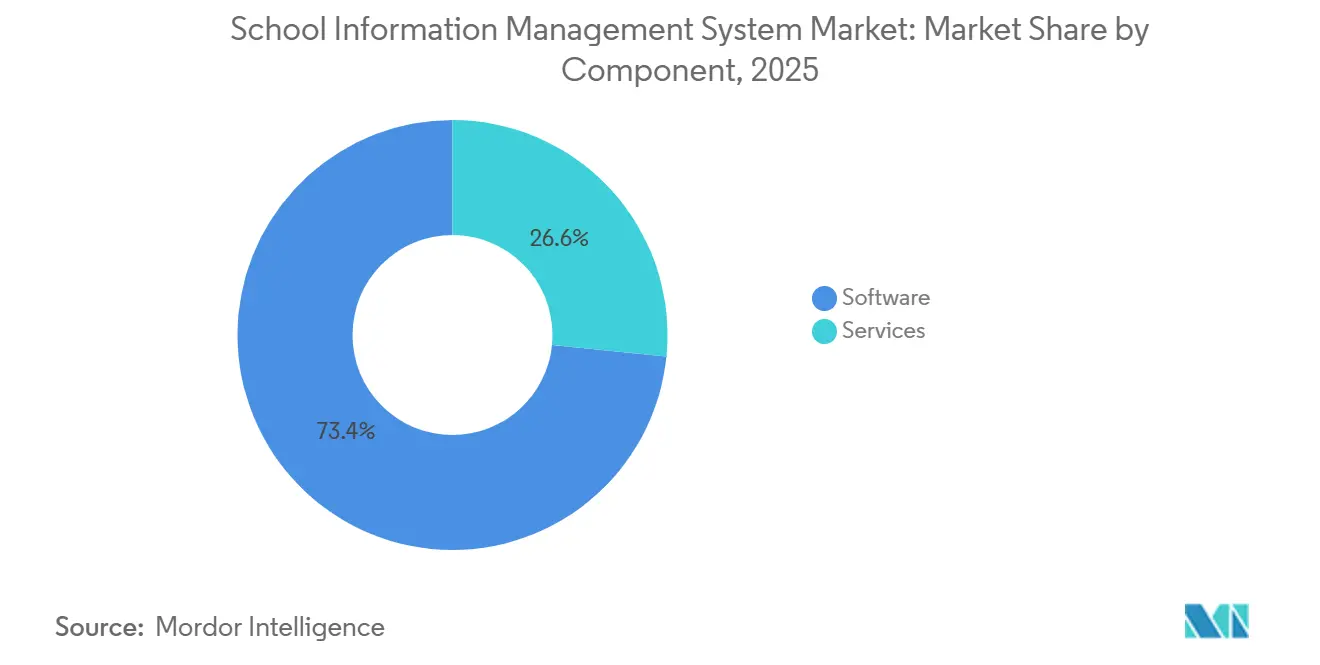
- By component, software accounted for 73.41% of the School Information Management System market size in 2025, yet services are growing faster at a 10.21% CAGR.
- By end user, K-12 schools held a 53.82% share in 2025, while higher education is expected to expand at a 10.44% CAGR through 2031.
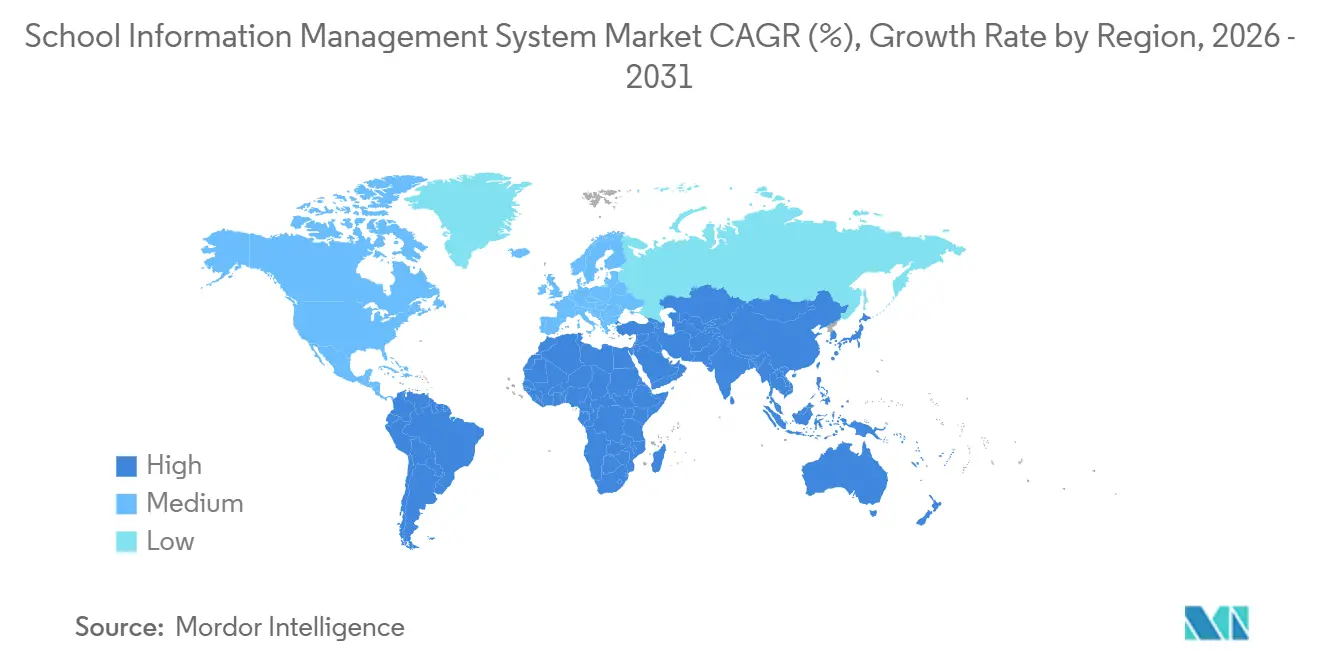
- By geography, North America dominated with a 37.89% revenue share in 2025; the Asia Pacific is projected to rise at a 10.89% CAGR through 2031.
Note: Market size and forecast figures in this report are generated using Mordor Intelligence’s proprietary estimation framework, updated with the latest available data and insights as of January 2026.
Global School Information Management System Market Trends and Insights
Drivers Impact Analysis*
| Driver | (~) % Impact on CAGR Forecast | Geographic Relevance | Impact Timeline |
|---|---|---|---|
| Greater Emphasis on Digital Tools to Track Student Activity | +1.8% | Global, with concentration in North America and Europe | Medium term (2-4 years) |
| Growing Government Investments in School Digitization | +2.3% | Asia Pacific core, spillover to Middle East and Africa | Short term (≤ 2 years) |
| Rising Adoption of Cloud-Based Solutions | +2.1% | Global, led by North America and Western Europe | Medium term (2-4 years) |
| Increasing Need for Centralized Administrative Automation | +1.6% | Global, strongest in urban districts | Long term (≥ 4 years) |
| Integration of AI-Driven Predictive Analytics for Retention | +1.4% | North America and Europe, emerging in Asia Pacific | Long term (≥ 4 years) |
| Emergence of EdTech Ecosystems Requiring Open APIs | +1.2% | Global, concentrated in mature EdTech markets | Medium term (2-4 years) |
| Source: Mordor Intelligence | |||
Greater Emphasis on Digital Tools to Track Student Activity
Litigation risk, rather than pedagogy, is driving demand for platforms that record attendance, behavior, and interventions in real-time. United States districts faced 47% more student-safety lawsuits in 2024 than in 2019, compelling administrators to secure audit trails that stand up in court.[1]National School Boards Association, “School Safety Litigation Trends,” Nsba.org California’s AB 1432 mandates early-warning analytics for chronic absenteeism across 420 districts, triggering immediate procurement of interoperable SIS modules. At the post-secondary level, new Title IX rules require electronic case-management workflows, so 1,800 colleges have retrofitted their existing systems or transitioned to cloud suites with embedded compliance templates. Vendors offering out-of-the-box regulatory workflows capture a disproportionate share because institutions lack the bandwidth to code bespoke solutions.
Growing Government Investments in School Digitization
Public-sector capital has pivoted decisively toward software. India directed INR 32 billion (USD 384 million) in 2024-2025 to equip 650,000 schools with interoperable SIS and learning platforms. The United Arab Emirates earmarked AED 1.2 billion (USD 327 million) through 2025 to unify emirate-level student records, replacing seven legacy systems. Australia’s AUD 500 million (USD 335 million) Digital Education Revolution Phase 2 hinges on adopting SIS that comply with a national unique-identifier framework. Lengthy multiyear contracts create lock-in, favoring incumbent vendors once initial deployments conclude.
Rising Adoption of Cloud-Based Solutions
Districts continue to shift to SaaS, even though five-year ownership costs run 18-22% above those of on-premise deployments after factoring in migration and integration fees.[2]Consortium for School Networking, “IT Leadership Survey 2024,” Cosn.org Security concerns override cost hesitancy because K-12 ransomware incidents rose 34% year over year in 2024. New EU rules classify schools as essential entities, obligating cyber-incident reporting and nudging 28,000 institutions toward cloud providers with managed compliance dashboards. National data-residency laws, however, force suppliers to stand up regional clouds, diluting global economies of scale.
Increasing Need for Centralized Administrative Automation
Fragmented point solutions impede real-time oversight of enrollment, finance, and staffing. Urban districts with more than 50,000 students typically run eight separate databases; consolidating them under one SIS cuts data-reconciliation labor by 30-40% in the first year, according to 2025 district case studies. Emerging economies echo the priority: China’s “smart campus” mandate spans 210,000 K-12 institutions and explicitly lists centralized automation as a compliance target. The longer-term impact arises from integrating payroll, transportation, and cafeteria modules, which rely on common student identifiers to avoid duplicate data entry.
Restraints Impact Analysis*
| Restraint | (~) % Impact on CAGR Forecast | Geographic Relevance | Impact Timeline |
|---|---|---|---|
| Limited IT Budgets in Public Schools | -1.9% | Global, acute in rural North America, Europe and emerging markets | Short term (≤ 2 years) |
| Data Privacy and Security Concerns | -1.4% | Global, heightened in Europe and North America | Medium term (2-4 years) |
| Resistance from Faculty Due to UX Complexity | -0.8% | Global, strong where educator average age is high | Medium term (2-4 years) |
| Regulatory Restrictions on Cross-Border Data | -0.7% | Asia Pacific, Europe and Middle East with strict localization laws | Long term (≥ 4 years) |
| Source: Mordor Intelligence | |||
Limited IT Budgets in Public Schools
Flat nominal spending since 2019, coupled with 18% inflation, has slashed real technology purchasing power by 15% in U.S. districts. Rural systems spend 38% less per student on IT than their urban peers, which hampers vendor traction where cloud migration costs are highest. European austerity after energy-price shocks forced France to delay EUR 180 million (USD 203 million) in SIS upgrades to 2026. Subscription fatigue compounds the squeeze, with 17% of districts evaluating reversion to on-premise installations to cap recurring fees.
Data Privacy and Security Concerns
A 2024 ransomware attack at Los Angeles Unified exposed 540,000 student records and cost USD 18 million in remediation, spurring California to impose strict liability on districts for vendor breaches. GDPR compliance adds up-front friction: sixty-two percent of surveyed European schools delayed SIS rollouts by up to nine months to complete data-protection impact assessments.[3]European Data Protection Board, “Data Protection Impact Assessments in Education,” Edpb.europa.eu Smaller vendors struggle to meet heightened indemnity and audit requirements, narrowing district choice sets and slowing overall replacement velocity.
*Our forecasts treat driver/restraint impacts as directional, not additive. The impact forecasts reflect baseline growth, mix effects, and variable interactions.
Segment Analysis
By Deployment Model: Cloud Dominance Masks On-Premise Resilience
Cloud platforms commanded a 62.73% market share of the School Information Management System market in 2025 and are projected to grow at a 10.16% CAGR, driven by districts eager to offload infrastructure and cyber-risk. The School Information Management System market size tied to cloud subscriptions is projected to more than double by 2031, despite the five-year total cost often surpassing legacy ownership costs. Mandatory incident-reporting rules under the European NIS2 directive further tilt adoption toward vendors that operate managed security centers.
Yet on-premise deployments persist where data-sovereignty laws prohibit foreign cloud storage, particularly in China, Russia, and parts of the Middle East. Chinese K-12 institutions must house student records domestically, so global suppliers either concede the market or partner with local providers. A 2024 survey across 200 U.S. districts showed that on-premise installations older than a decade yielded 23% lower annual IT costs because subscription fees were absent and data-egress charges were negligible. Hybrid architectures, where core records remain on-site, and parent portals run in the cloud, are gaining traction but introduce integration complexity that fuels demand for services.


By Application: Academics Rise as Retention Outpaces Administration
Administration modules still held the largest 39.26% revenue share in 2025, reflecting long-standing needs for scheduling, grading, and enrollment workflows. However, the academic segment is expanding at 10.67% CAGR, the fastest among all use cases, as universities deploy learning analytics to cut attrition. The School Information Management System market size attached to academic analytics is therefore growing faster than any other module family, underscoring a shift from compliance to student success outcomes.
Case evidence is compelling: Georgia State University shaved first-year dropout rates by 11 percentage points after embedding predictive alerts into its SIS. Similar results from the University of California system triggered a USD 25 million expansion in 2025. Finance and ancillary applications remain strategic for audit compliance, yet their growth trails as districts redirect funds toward AI-enabled coursework recommendations and competency mapping that promise direct revenue or grant upside.
By Component: Services Surge as Complexity Deepens
Software licenses represented 73.41% of 2025 revenue, while services are growing at a faster rate of 10.21% CAGR as institutions confront data migration headaches, integration gaps, and change management fatigue. In many contracts, the first-year service spend equals or exceeds the license value because 15-25% of legacy student records contain inconsistencies that require manual cleanup. Implementation partners now bundle extensive API work, linking SIS backbones to learning management systems, video conferencing systems, and library systems.
The School Information Management System market is thus inverting the traditional value capture model. Vendors that lead with consulting teams lock in multiyear recurring service milestones, while stand-alone software providers risk margin compression. Standardization efforts, such as OneRoster, help, but are inconsistently interpreted, as forty percent of SIS suppliers deviate from the protocol, obliging districts to hire middleware specialists.
By End User: Higher Education Accelerates Past K-12 in Growth Terms
K-12 campuses generated 53.82% revenue in 2025 due to sheer scale, yet higher-education spending is increasing at a 10.44% CAGR. Universities invest an average of USD 1,840 per student in IT, compared with USD 276 in K-12 education, freeing up budgets for AI-driven degree planning and early-alert systems. The School Information Management System market share attributable to higher education is therefore set to rise steadily through 2031.
Demographic contraction amplifies urgency. The U.S. college-age population is expected to decline by 15% between 2025 and 2035, prompting institutions to shift their focus from top-line growth to retention optimization. Arizona State University exemplifies the payoff, retaining USD 14 million in tuition by shortening time-to-degree after a 2024 SIS overhaul. K-12 adoption remains compliance-driven, anchored by federal interoperability mandates that affect 18,000 U.S. Title I schools.
Geography Analysis
North America retained a 37.89% revenue share in 2025, as refresh cycles and federal standards continued to maintain steady replacement momentum. Yet, funding gaps pose growth ceilings; implementation grants under the 2024 National Education Technology Plan cover only a fraction of the projected SIS upgrade costs. Canada exhibits provincial divergence: Ontario centralized procurement across seventy-two school boards in 2024, whereas Alberta continues to let 379 schools choose independently.
Asia Pacific leads in growth, advancing at a 10.89% CAGR as governments mandate smart-campus infrastructure. China’s sweeping 2025 deadline affects 210,000 K-12 schools. India is channeling INR 57 billion (USD 685 million) into state-level SIS rollouts. Japan’s GIGA program equips 10 million students with cloud devices, all tethered to an interoperable SIS for usage monitoring. Data-localization statutes, however, splinter the landscape, forcing globally active vendors to invest in costly, country-specific infrastructure.
Europe shows moderated prospects because austerity budgets collide with complex procurement. Germany’s sixteen federal states operate forty-seven separate platforms, which limits scale economies. GDPR-driven impact assessments add six- to nine-month delays for two-thirds of new projects. Meanwhile, gains in the Middle East and Africa emanate from the United Arab Emirates’ AED 1.2 billion consolidation program, while those in South America hinge on Brazil’s multi-year municipal rollout, which now stretches into 2027.

Competitive Landscape
The School Information Management System market is moderately concentrated. The top five vendors capture roughly 35-40% of the global revenue, leaving ample space for regional specialists and newcomers with a vertical focus. Cloud-native challengers, such as Infinite Campus and Skyward, leverage pre-configured templates to win mid-sized U.S. districts, whereas enterprise resource planning (ERP) incumbents like Oracle and SAP remain entrenched in large university systems that favor deep back-office integration. Platform consolidation is the dominant strategy: PowerSchool’s 2024 acquisition of Schoology folded learning management into its SIS core, offering a one-stop K-12 suite that competes head-to-head with Google Classroom.
White-space growth clusters around underserved rural districts, vocational colleges needing niche compliance workflows, and international schools juggling multiple curricula. European disruptor Classter captured international programs by shipping pre-sets for International Baccalaureate and Cambridge frameworks, slashing configuration times by 40%. Technical differentiation hinges on embedded AI and a mobile-first design approach. Ellucian has patented a 2025 machine-learning engine that predicts course demand eighteen months ahead, enabling smarter faculty allocation. Security certifications, such as ISO/IEC 27001, and adherence to IMS interoperability standards are now appearing in almost every RFP, narrowing the competitive field to providers that can meet those requirements.
Sustained investment in region-specific data centers is another battleground. Oracle’s USD 150 million expansion across India and the United Arab Emirates aims to clear data residency hurdles and unlock access to 45,000 schools in those markets. Vendors unable to amortize such capex will likely seek channel partnerships or exit geographies governed by strict localization statutes.
School Information Management System Industry Leaders
XIPHIAS Software Technologies
Foradian Technologies
Tribal Group PLC
Technology One Corporation
Jenzabar Inc.
- *Disclaimer: Major Players sorted in no particular order

Recent Industry Developments
- August 2025: IMS Global Learning Consortium reported that 450 institutions had adopted the OneRoster interoperability standard, signaling rapid acceleration in simplified SIS integrations worldwide.
- June 2025: Ellucian secured a U.S. patent for a machine-learning system that forecasts course-enrollment demand 18 months in advance, giving universities new tools to optimize faculty allocation and course scheduling.
- April 2025: The University of California Office of the President approved a USD 25 million rollout of predictive-analytics modules across 10 campuses, integrating them into existing SIS infrastructure to improve student-retention outcomes.
- January 2025: Ellucian Company LP launched Ellucian Experience 2.0, a mobile-first SIS interface with embedded AI-driven degree-audit capabilities tailored to its 2,700 higher-education customers.


Global School Information Management System Market Report Scope
The School Information Management System Report is Segmented by Deployment Model (On-Premise, and Cloud), Application (Administration, Finance, Academics, Other Applications), Component (Software, and Services), End User (K-12 Schools, Higher Education Institutions, Other End Users), and Geography (North America, Europe, Asia-Pacific, Middle East and Africa, South America). The Market Forecasts are Provided in Terms of Value (USD).
| On-Premise |
| Cloud |
| Administration |
| Finance |
| Academics |
| Other Applications |
| Software |
| Services |
| K-12 Schools |
| Higher Education Institutions |
| Other End Users |
| North America | United States | |
| Canada | ||
| Mexico | ||
| Europe | Germany | |
| United Kingdom | ||
| France | ||
| Russia | ||
| Rest of Europe | ||
| Asia-Pacific | China | |
| Japan | ||
| India | ||
| South Korea | ||
| Australia | ||
| Rest of Asia-Pacific | ||
| Middle East and Africa | Middle East | Saudi Arabia |
| United Arab Emirates | ||
| Rest of Middle East | ||
| Africa | South Africa | |
| Egypt | ||
| Rest of Africa | ||
| South America | Brazil | |
| Argentina | ||
| Rest of South America | ||
| By Deployment Model | On-Premise | ||
| Cloud | |||
| By Application | Administration | ||
| Finance | |||
| Academics | |||
| Other Applications | |||
| By Component | Software | ||
| Services | |||
| By End User | K-12 Schools | ||
| Higher Education Institutions | |||
| Other End Users | |||
| By Geography | North America | United States | |
| Canada | |||
| Mexico | |||
| Europe | Germany | ||
| United Kingdom | |||
| France | |||
| Russia | |||
| Rest of Europe | |||
| Asia-Pacific | China | ||
| Japan | |||
| India | |||
| South Korea | |||
| Australia | |||
| Rest of Asia-Pacific | |||
| Middle East and Africa | Middle East | Saudi Arabia | |
| United Arab Emirates | |||
| Rest of Middle East | |||
| Africa | South Africa | ||
| Egypt | |||
| Rest of Africa | |||
| South America | Brazil | ||
| Argentina | |||
| Rest of South America | |||


Key Questions Answered in the Report
What is the current value of the School Information Management System market?
The School Information Management System market size stands at USD 13.57 billion in 2026.
How fast is the market expected to grow over the next five years?
The market is projected to post a 9.93% CAGR, reaching USD 21.79 billion by 2031.
Which deployment model leads in adoption?
Cloud deployments hold 62.73% market share and continue to expand rapidly due to cybersecurity and scalability advantages.
Which application segment is growing the fastest?
Academic analytics is forecast to grow at a 10.67% CAGR as institutions focus on student-retention tools.
How significant are services compared with software in total spending?
Services are growing at a 10.21% CAGR because implementation, customization and integration often equal or exceed first-year license fees.
Which region will contribute the most incremental revenue through 2031?
Asia Pacific, driven by large-scale government digitization mandates, is expected to add the greatest absolute growth at a 10.89% CAGR.
Page last updated on:


