Immersive Analytics Market Size and Share
Market Overview
| Study Period | 2020 - 2031 |
|---|---|
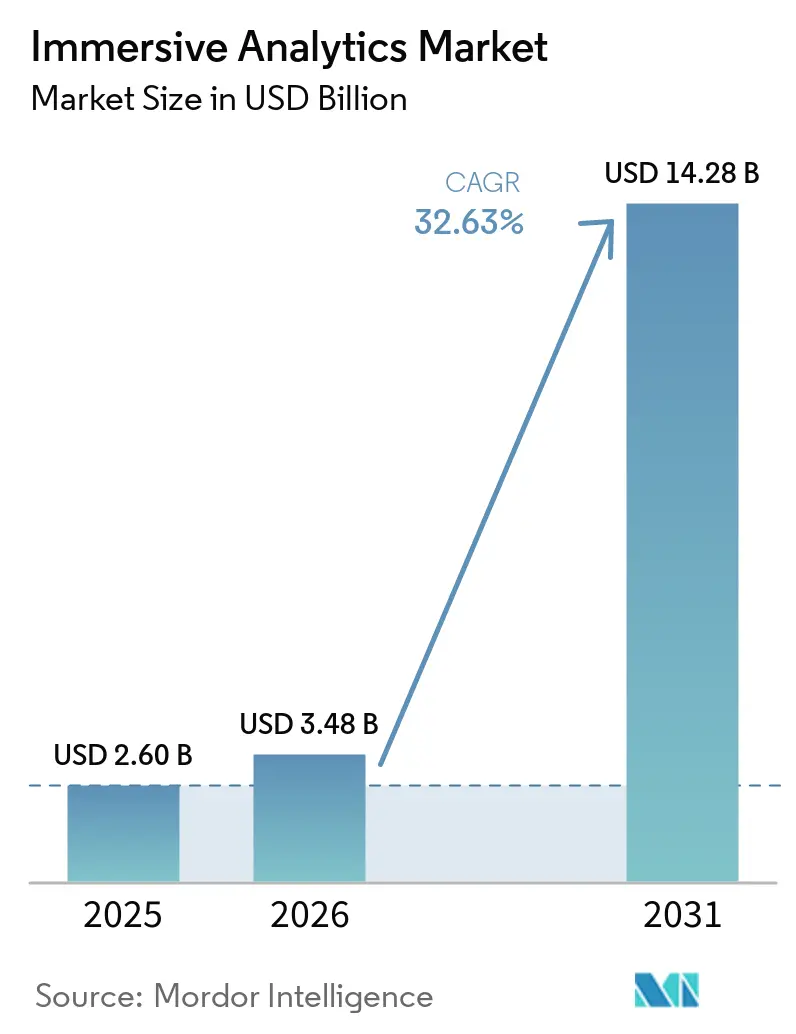
| Market Size (2026) | USD 3.48 Billion |
| Market Size (2031) | USD 14.28 Billion |
| Growth Rate (2026 - 2031) | 32.63% CAGR |
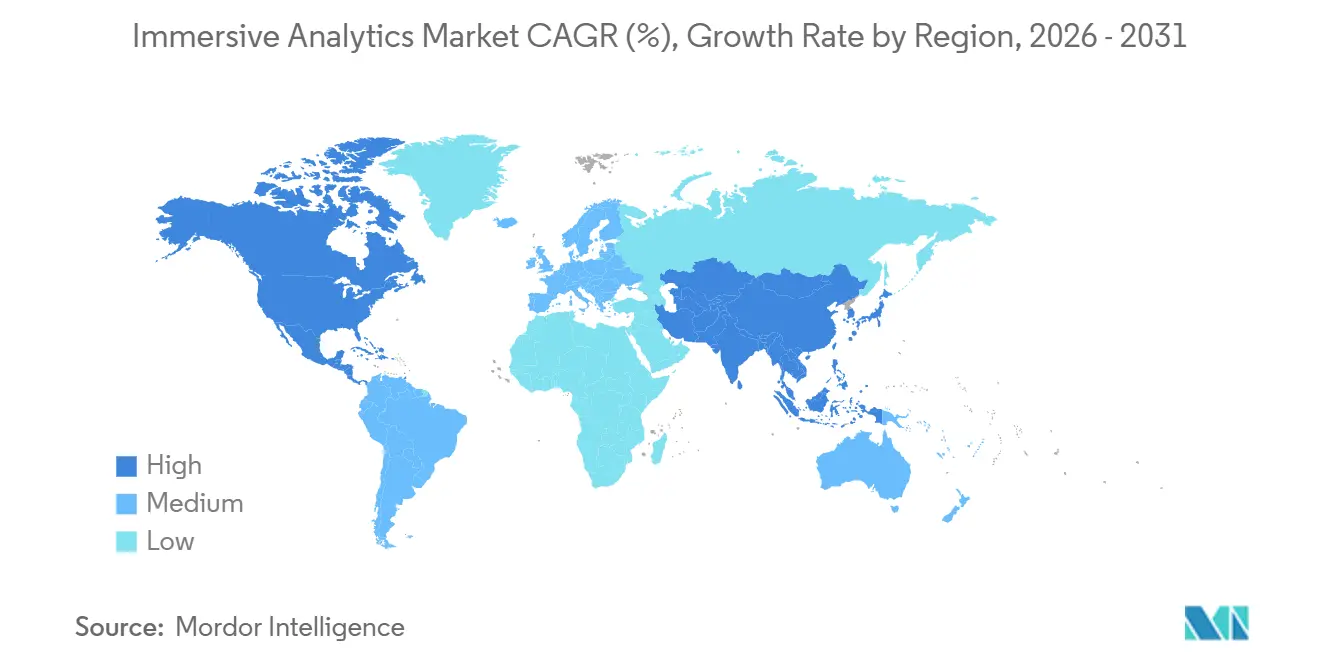
| Fastest Growing Market | Asia Pacific |
| Largest Market | North America |
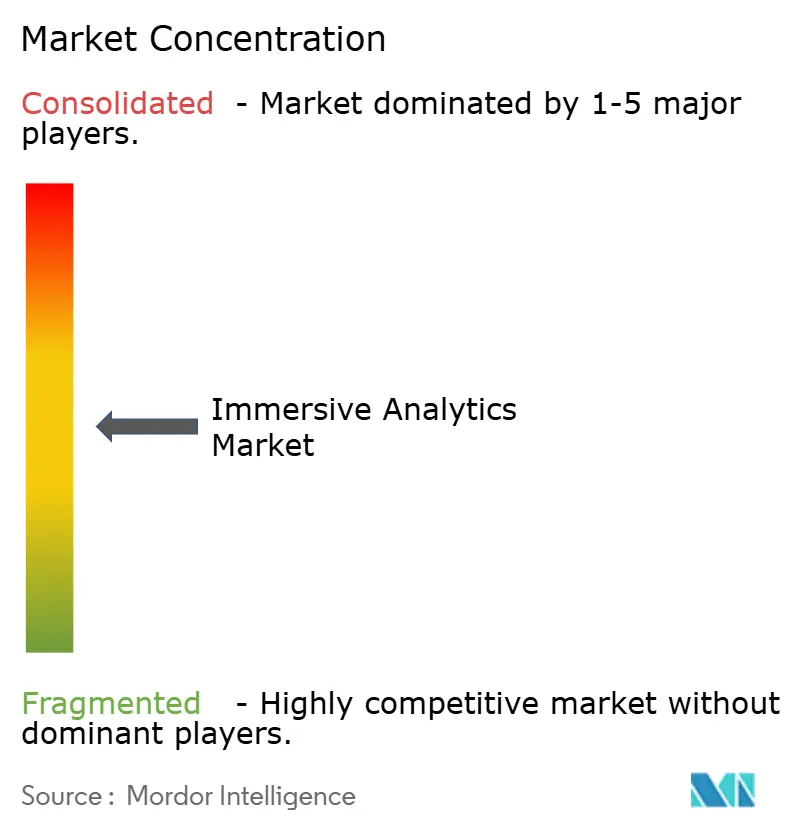
| Market Concentration | Medium |
Major Players *Disclaimer: Major Players sorted in no particular order Image © Mordor Intelligence. Reuse requires attribution under CC BY 4.0. | |
Immersive Analytics Market Analysis by Mordor Intelligence
The immersive analytics market size is expected to increase from USD 2.6 billion in 2025 to USD 3.48 billion in 2026 and reach USD 14.28 billion by 2031, growing at a CAGR of 32.63% over 2026-2031. Rising demand for spatial data storytelling, the mainstreaming of digital twins, and falling head-mounted display prices are shifting analytics budgets away from flat dashboards toward 3D workspaces. Cloud-native toolchains connect business-intelligence data lakes directly to augmented-reality overlays, letting analysts filter, slice, and simulate on live streams instead of static extracts. Enterprises also view immersive analytics as an on-ramp to operational efficiency because predictive-maintenance alerts, remote-expert workflows, and collaborative design reviews shorten decision cycles and trim rework costs. Meanwhile, open standards such as OpenUSD and OpenXR are limiting proprietary lock-in, so buyers increasingly favor vendors that interoperate across headsets, browsers, and mobile devices, a preference that keeps competitive intensity high and margins disciplined.
Key Report Takeaways
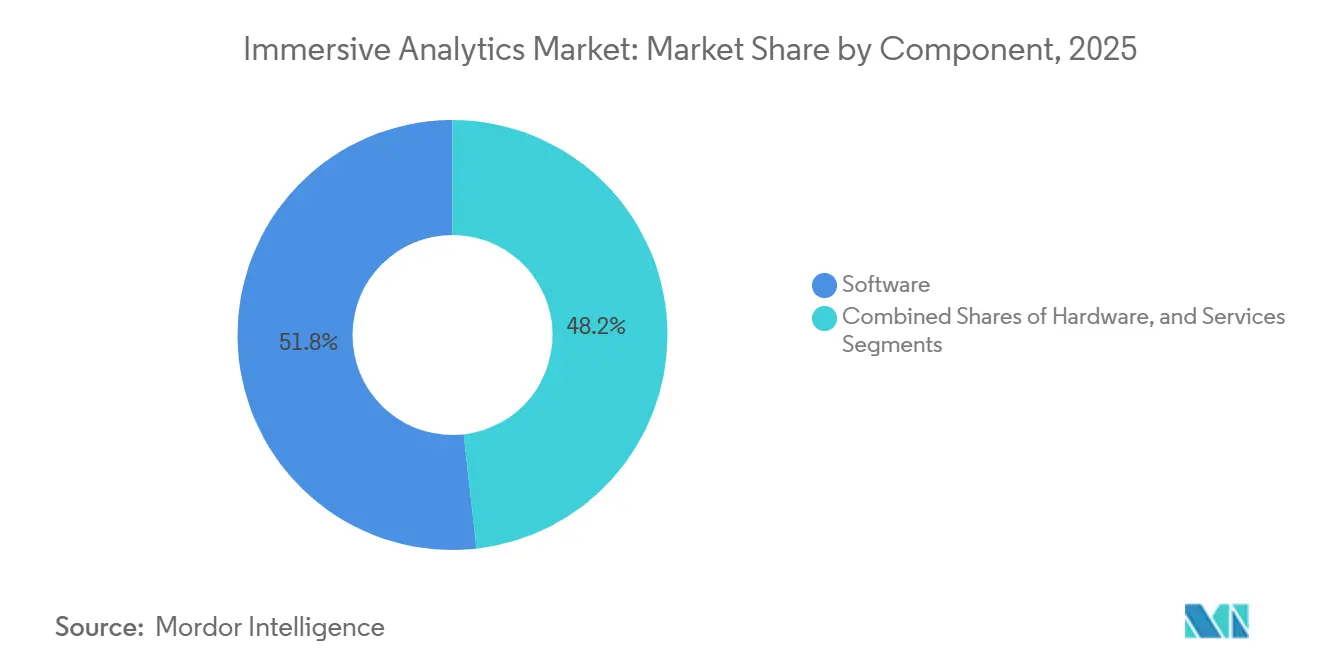
- By component, software captured 51.78% of the immersive analytics market share in 2025, while services are forecast to expand at a 33.23% CAGR through 2031.
- By technology, augmented reality led with 44.82% revenue share in 2025, whereas mixed reality is projected to post the fastest 33.03% CAGR to 2031.
- By deployment model, cloud accounted for 55.39% of installations in 2025, while edge and on-device architectures are advancing at a 33.18% CAGR over the forecast horizon.
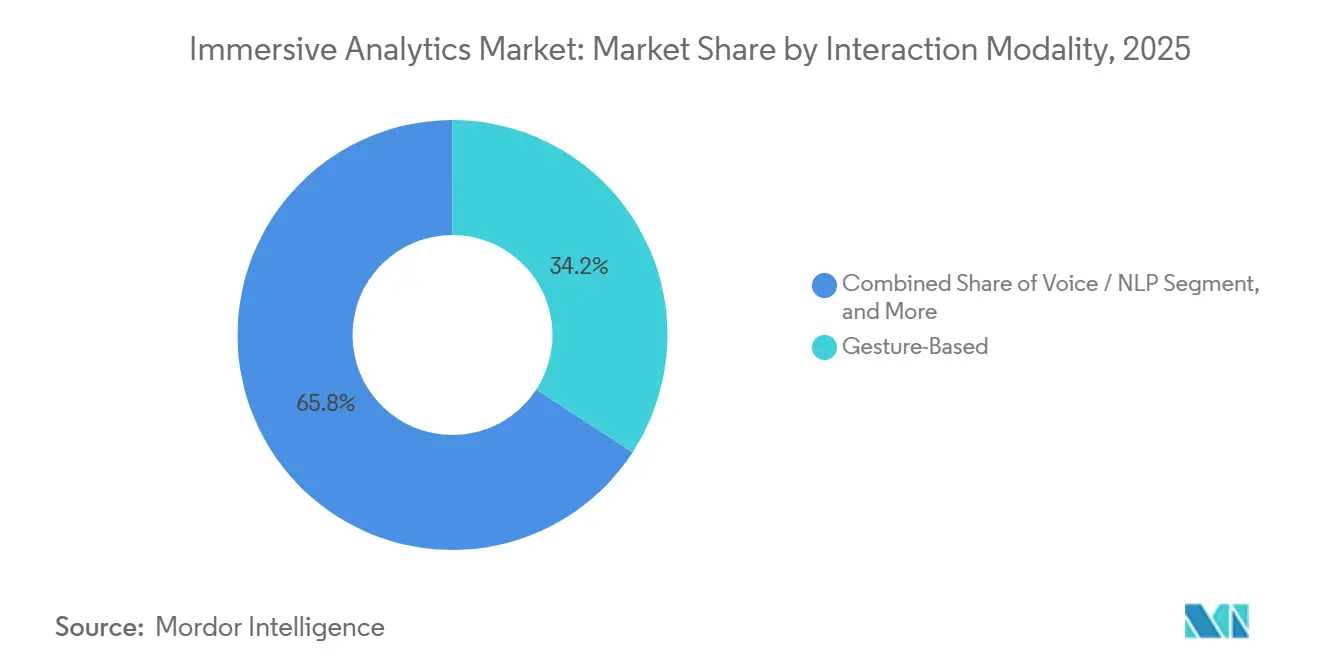
- By interaction modality, gesture-based interfaces held 34.18% share in 2025, and multimodal fusion is set to accelerate at a 33.63% CAGR through 2031.
- By end-user industry, manufacturing and industrial applications accounted for 26.74% of spending in 2025, while healthcare and life sciences are poised for the highest 34.23% CAGR through 2031.
- By geography, North America dominated with 35.62% of revenue in 2025, and Asia-Pacific is on track for the strongest 33.74% CAGR through 2031.
Note: Market size and forecast figures in this report are generated using Mordor Intelligence’s proprietary estimation framework, updated with the latest available data and insights as of January 2026.
Global Immersive Analytics Market Trends and Insights
Driver Impact Analysis*
| Driver | (~) % Impact on CAGR Forecast | Geographic Relevance | Impact Timeline |
|---|---|---|---|
| Accelerating Enterprise Digital Twins Adoption | +5.2% | Global, strong in North America, Germany, Japan | Medium term (2-4 years) |
| Falling Unit Costs of XR Head-Mounted Displays | +4.8% | Global, price-sensitive uptake in Asia-Pacific and South America | Short term (≤ 2 years) |
| Expansion of 5G and Edge Computing Infrastructure | +4.5% | North America, Europe, Asia-Pacific; spill-over to Middle East | Medium term (2-4 years) |
| Integration of Generative AI for Real-Time Insights | +4.3% | Global, led by North America and Europe | Short term (≤ 2 years) |
| Open-Source Spatial Analytics Frameworks Maturing | +2.8% | Global, developer communities in North America and Europe | Long term (≥ 4 years) |
| Rise of Analytics as a Feature in Industrial IoT Platforms | +3.1% | Global, strongest in manufacturing verticals | Medium term (2-4 years) |
| Source: Mordor Intelligence | |||
Accelerating Enterprise Digital Twins Adoption
Near-real-time synchronization of physical assets with virtual replicas is turning digital twins into a live data substrate for immersive analytics. Manufacturers that combined IoT telemetry, simulation, and 3D visualization recorded median payback periods of 18 months, twice as fast as legacy dashboards. Platform launches such as ABB Genix deliver sub-2-second alerting latencies, so maintenance crews can overlay failure probabilities on equipment before downtime occurs.[1]ABB, “ABB Launches Genix Industrial Analytics and AI Suite to Boost Productivity and Sustainability,” abb.com Government-backed initiatives, including Japan’s Ouranos Ecosystem, are addressing cross-factory interoperability, enabling multinational deployments rather than isolated pilots. As a result, vendors that refine data-assimilation algorithms to fuse sparse sensors with physics models will stand out in the immersive analytics market.
Falling Unit Costs of XR Head-Mounted Displays
Enterprise-grade mixed-reality headsets now retail for a fraction of 2022 prices. Meta Quest 3 ships for under USD 500 yet rivals workstation-class visuals, and high-end options such as the Apple Vision Pro have proved that premium optics can still move one million units in one year. Display makers are reutilizing smartphone OLED fabs, pushing price declines faster than Moore’s Law. Cost parity with rugged tablets means mid-market firms in retail, education, and construction can finally equip entire teams, unlocking volume orders that lift the immersive analytics market far beyond pilot scale.
Expansion of 5G and Edge Computing Infrastructure
Twenty-millisecond round-trip latencies delivered by operator-edge clouds allow remote experts to annotate 3D asset models while on-site technicians view overlays in real time. Examples include automotive assembly lines in Germany and offshore substations in India. AWS Outposts and telco multi-access edge nodes reduce the penalty of transmitting volumetric data, making immersive analytics viable for quality inspection and predictive maintenance. The proliferation of local edge zones, therefore, expands the immersive analytics market into latency-sensitive domains that cloud-only architectures cannot serve.
Integration of Generative AI for Real-Time Insights
Conversational interfaces powered by large language models let analysts voice queries such as filter defects last quarter by shift and supplier and receive an instant spatial heatmap. SAP, Google, and Oracle have embedded generative-AI translators that turn plain language into SQL, accelerate root-cause discovery, and even draft narrative explanations. The fusion of voice, gesture, and AI shortens analysis cycles, so decision-makers spend less time coding and more time strategizing. Vendors that stream inference results directly into 3D canvases will capture a premium in the immersive analytics market because static visualization libraries cannot keep pace with dynamic Q&A workflows.
Restraint Impact Analysis*
| Restraint | (~) % Impact on CAGR Forecast | Geographic Relevance | Impact Timeline |
|---|---|---|---|
| Limited Availability of Authoring Talent | -2.9% | Global, acute in North America and Europe | Medium term (2-4 years) |
| Hardware-Induced Motion Sickness and Fatigue | -2.1% | Global, higher sensitivity in Asia-Pacific | Short term (≤ 2 years) |
| Immature Enterprise Security Standards for XR Data | -2.4% | Global, most restrictive in Europe and U.S. regulated sectors | Long term (≥ 4 years) |
| High Customization Costs for Domain-Specific Workflows | -2.6% | Global, friction in manufacturing, healthcare, energy | Medium term (2-4 years) |
| Source: Mordor Intelligence | |||
Limited Availability of Authoring Talent
Spatial design, data engineering, and domain knowledge rarely coexist in one role, so enterprises struggle to convert 2D dashboards into immersive layouts. European Union programs such as XR2Learn aim to widen the pipeline, but will not graduate cohorts fast enough to meet demand.[2]European Commission CORDIS, “XR2Learn Project,” cordis.europa.eu Even with no-code editors in Microsoft Mesh, firms still hire Unity or Unreal specialists for fine-tuning, creating project bottlenecks. Universities focus on bar charts and scatter plots, so retraining is essential. Until the talent pool deepens, hiring costs and lead times will slow rollouts and shave points off the growth of the immersive analytics market.
Hardware-Induced Motion Sickness and Fatigue
Vestibular conflicts limit headset sessions to short bursts for many users. Eye-tracked foveated rendering eases GPU strain and lowers heat, while mid-air haptics from Ultraleap anchor virtual interactions in tactile cues, yet discomfort persists. Organizations therefore deploy hybrid workflows in which analysts dive into 3D for 15-minute anomaly hunts and then revert to monitors, capping daily immersive usage. Unless advances in optics, ergonomics, and field of view converge, this physiological ceiling will restrain full-shift adoption in the immersive analytics market.
*Our forecasts treat driver/restraint impacts as directional, not additive. The impact forecasts reflect baseline growth, mix effects, and variable interactions.
Segment Analysis
By Component: Software Anchors Recurring Revenue Models
Software accounted for 51.78% of the immersive analytics market in 2025 as subscription platforms integrated directly into enterprise data warehouses. Vendors released plug-ins that embed 3D canvases inside Tableau and Power BI so analysts avoid switching tools. Implementation projects often involve translating legacy SQL into spatial queries, which drive double-digit growth in service revenue. The immersive analytics services market is projected to grow briskly, with a 33.23% CAGR, as organizations need change management roadmaps, security hardening, and custom workflow logic. Hardware remains essential for optics, sensors, and compute, yet bring-your-own-headset policies dampen capital-expenditure growth and shift value to software ecosystems.
Ongoing middleware innovation also sustains the software lead. Unity’s robotics connector synchronizes real-world telemetry with scene graphs at 99.99% accuracy, allowing factories to see updated digital twins without code refactoring. Immersion Analytics patented layered glow and translucency techniques that display half a dozen variables at once without information collapse. As low-code authoring templates become commonplace, the immersive analytics market will see software retention rates edge higher than hardware refresh cycles, reinforcing a subscription-centric revenue mix.


By Technology: Mixed Reality Bridges Physical and Digital Workflows
Augmented reality held 44.82% share in 2025 because line workers value hands-free overlays that superimpose manuals or quality metrics onto machinery. However, the immersive analytics market for mixed reality will expand faster, with a CAGR of 33.03%, as blending sensor feeds with 3D simulations enables predictive tasks, such as fusing thermal data with substation twins to spot transformer stress. Virtual-reality cocoons remain popular for training pilots or surgeons where external distractions hinder focus, but their isolation limits operational dashboards that require situational context.
Device roadmaps hint that modalities are converging rather than competing. Apple Vision Pro users pin analytics dashboards beside physical sticky notes, and Meta’s focus on open Quest hardware lets third-party developers target any immersive scenario. Enterprises, therefore, demand cross-device synchronization, prompting vendors to architect cloud orchestration layers that hand off a session from VR headsets to AR glasses and back to 2D browsers without losing state. That interoperability will become table stakes for contenders in the immersive analytics market.
By Deployment Model: Edge Architectures Unlock Latency-Sensitive Use Cases
Cloud remained the default deployment path in 2025, powering 55.39% of installations because central data lakes and elastic GPUs simplify scaling. Yet edge and on-device compute will outpace the overall immersive analytics market with a CAGR of 33.18% because millisecond-level responsiveness is mandatory for autonomous vehicles, assembly-line defect detection, and telesurgery guidance. These workloads cannot tolerate round-trips to far-flung regions, so enterprises deploy micro data centers on factory floors or in telecom racks.
Demonstrations such as NVIDIA's and T-Mobile’s AI platform show that inference directly on radio-access network servers can predict coverage gaps before users notice signal drops, a capability impossible with pure cloud. Where regulations hinder cross-border data flows, on-premises clusters persist, especially in defense and pharmaceuticals. Consequently, vendors that package lightweight containerized renderers and allow incremental model downloads will win share as the immersive analytics market bifurcates between scale-out cloud tenants and low-latency edge adopters.
By Interaction Modality: Multimodal Fusion Resolves Speed-Precision Trade-Offs
Gesture recognition dominated at 34.18% in 2025 because hand tracking feels natural and controller-free. Yet selecting a single point in a dense scatter plot still frustrates users. The immersive analytics market size linked to multimodal fusion will climb fastest with a CAGR of 33.63% over the forecast period, as eye tracking guides cursor focus, voice filters data, and haptic pings confirm actions. Voice-only command systems help field crews wearing gloves, but noisy plants erode speech-to-text accuracy. Eye-tracked, foveated rendering triples battery life for untethered headsets, yet requires voice or touch for explicit selection.
Haptic technologies are maturing. Ultraleap’s millimeter-accurate mid-air pulses allow analysts to feel a histogram bar swell as values rise, reinforcing cognitive mapping. As devices shrink and SDKs unify haptic, gaze, and speech streams, multimodal stacks will become baseline, making single-channel interfaces look archaic. Vendors that coordinate these inputs seamlessly will capture stickier contracts inside the immersive analytics market.
By End-User Industry: Healthcare Leads Growth on Clinical Evidence
Manufacturing accounted for 26.74% of 2025 spending because lean-production managers can quickly quantify ROI when line optimization reduces scrap. Digital twins also reduce machine downtime penalties, a prime motivator in high-volume sectors. Healthcare, however, tops the growth chart with a 34.23% CAGR to 2031, as peer-reviewed studies now confirm that immersive surgical planning can revise procedures in up to half of cases, trimming operative times and blood loss. Cardiologists, orthopedic surgeons, and radiologists increasingly view 3D pre-operative rehearsals as best practice.
Retailers deploy store-twin merchandise analytics to halve manual audit hours and double visual-merchandising productivity. Energy utilities overlay GIS layers onto live video feeds so linemen avoid underground cables. Education, media, defense, and financial services round out spending with specialized use cases, mission rehearsal, sports broadcast overlays, and portfolio risk mapping, each require domain-tuned data models. Collectively, this sector diversity insulates the immersive analytics market from cyclic downturns in any single vertical.
Geography Analysis
North America generated 35.62% of 2025 revenue, backed by federal appropriations that embed digital twins into transportation safety studies and defense testbeds. A bipartisan Leadership in Immersive Technology Act elevates the technology to national-competitiveness status, unlocking grants and coordination across agencies. Canadian miners and foresters rely on immersive subsurface models to safely staff remote operations, while Mexico’s automotive clusters integrate spatial quality dashboards directly into line-side SAP systems. Enterprise buyers also benefit from dense 5G rollouts and hyperscale cloud nodes that host low-latency rendering farms.
Asia-Pacific is forecast to be the fastest-growing region, with a 33.74% CAGR through 2031. Japan’s PLATEAU project already offers 3D city models for 236 municipalities and aims for 500 by 2027, a public data asset that fuels urban disaster simulations and infrastructure planning. China’s Shanghai twin maps waste collection and e-bike charging while feeding epidemiological analyses, proving out city-scale use cases. India’s Jio True5G blanket now covers 5,500 cities, enabling immersive field-service overlays in far-flung substations. South Korea and Australia invest in smart factories and mining twins, rounding out regional momentum.
Europe held a mid-tier share in 2025, yet policy tailwinds portend acceleration. The European Partnership for Virtual Worlds commits EUR 200 million (USD 226 million) in joint funding, and the Digital Europe Test Beds funnel EUR 17 million (USD 19.2 million) into cross-border sandboxes.[3]European Commission, “European Commission Launches European Partnership for Virtual Worlds,” digital-strategy.ec.europa.eu These programs mandate open-standard APIs, encouraging vendor neutrality and boosting buyer confidence. Pilots such as the x-CITE CitiVerse in Belgium, Finland, and the Netherlands let citizens visualize zoning proposals in 3D, widening public familiarity. South America, the Middle East, and Africa trail in absolute spend but leverage sovereign-wealth funds and commodity-sector use cases, oil, gas, and mining, to finance lighthouse projects that can scale regionally.

Competitive Landscape
The immersive analytics market is moderately fragmented, with no vendor exceeding 15% share. Buyers seek interoperable platforms that export data in open formats, aligning with European Commission guidelines. NVIDIA’s Omniverse marries OpenUSD scenes with RTX ray tracing, delivering physics simulations 1,200 times faster than legacy CAD workflows, shortening automotive line validation from weeks to hours.[4]NVIDIA, “Digital Twins and Physical AI with Omniverse Cloud Sensor RTX,” nvidia.com Microsoft Mesh embeds spatial canvases into Teams, so companies already paying for Microsoft 365 licenses incur no additional software cost, accelerating land-and-expand plays.
Hardware rivalry centers on optics and price. Meta Quest 3 offers 10× pixel density and full-color passthrough for under USD 500, targeting mass deployment, whereas Apple Vision Pro positions at USD 3,500 with integrated eye tracking for premium enterprise rollouts. Varjo, HTC, and Lenovo compete on resolution, field of view, and ergonomic comfort. Systems integrators such as Accenture and Capgemini wrap these platforms in workflow consulting, but specialists like ArborXR win deals by decoupling headset fleet management from analytics dashboards and syncing 500+ learning-management systems.
Strategically, legacy ERP giants embed immersive options into existing stacks, monetizing installed bases, while XR-native startups pursue narrow wedges, training, maintenance, before upselling end-to-end analytics. Open-source frameworks deck.gl and Apache Superset’s 3D extensions lower entry barriers for in-house developer teams. Success will favor vendors that combine seamless data-lake integration, low-code spatial authoring, and cross-device session hand-off because enterprises now view those three capabilities as minimum criteria during RFP evaluations.
Immersive Analytics Industry Leaders
Microsoft Corporation
NVIDIA Corporation
Unity Software Inc.
PTC Inc.
Magic Leap, Inc.
- *Disclaimer: Major Players sorted in no particular order

Recent Industry Developments
- March 2026: ArborXR completed its acquisition of InformXR after raising USD 12 million in Series A funding and launched ArborXR Insights to deliver real-time training analytics across 500+ LMS integrations.
- March 2026: NVIDIA and T-Mobile showcased a physical-AI platform on 5G edge servers that generates real-time digital twins of cellular base stations, enabling proactive coverage optimization.
- February 2026: United States fiscal-year 2026 appropriations mandated that the Department of Transportation, the Department of Defense, and CISA study digital-twin applications and institutionalize immersive analytics in federal workflows.
- December 2025: The European Commission inaugurated the European Partnership for Virtual Worlds, pledging up to EUR 200 million (USD 226 million) in funding for immersive R&D, co-financed by Siemens, SAP, and others.


Global Immersive Analytics Market Report Scope
The Immersive Analytics Market refers to the global industry centered on technologies, platforms, and solutions that combine advanced data analytics with immersive visualization environments, enabling users to interact with complex datasets in more intuitive, interactive, and spatial ways. Immersive analytics integrates technologies such as augmented reality (AR), virtual reality (VR), mixed reality (MR), spatial computing, and 3D visualization to enhance data exploration, interpretation, collaboration, and decision-making across enterprise, industrial, scientific, and consumer applications. These solutions allow users to analyze real-time and historical data through interactive digital environments using natural human-computer interaction methods such as gestures, voice commands, eye tracking, and haptic feedback.
The Immersive Analytics Market Report is Segmented by Component (Software, Hardware, and Services), Technology (Augmented Reality, Virtual Reality, Mixed Reality, and 3D Desktop and Spatial-Computing Displays), Deployment Model (Cloud, On-Premises, and Edge and On-Device), Interaction Modality (Gesture-Based, Voice and NLP, Eye-Tracking, Haptic and Force-Feedback, and Multimodal Fusion), End-User Industry (Healthcare and Life Sciences, Manufacturing and Industrial, Retail and e-Commerce, Energy and Utilities, Education and Research, Media and Entertainment and Sports, Defense and Aerospace, and Financial Services), and Geography (North America, South America, Europe, Asia-Pacific, and Middle East and Africa). The Market Forecasts are Provided in Terms of Value (USD).
| Software |
| Hardware |
| Services |
| Augmented Reality (AR) |
| Virtual Reality (VR) |
| Mixed Reality (MR) |
| 3D Desktop / Spatial-Computing Displays |
| Cloud |
| On-Premises |
| Edge / On-Device |
| Gesture-Based |
| Voice / NLP |
| Eye-Tracking |
| Haptic / Force-Feedback |
| Multimodal Fusion |
| Healthcare and Life Sciences |
| Manufacturing and Industrial |
| Retail and e-Commerce |
| Energy and Utilities |
| Education and Research |
| Media, Entertainment and Sports |
| Defense and Aerospace |
| Financial Services |
| North America | United States | |
| Canada | ||
| Mexico | ||
| South America | Brazil | |
| Argentina | ||
| Rest of South America | ||
| Europe | United Kingdom | |
| Germany | ||
| France | ||
| Italy | ||
| Rest of Europe | ||
| Asia-Pacific | China | |
| Japan | ||
| India | ||
| South Korea | ||
| Rest of Asia-Pacific | ||
| Middle East and Africa | Middle East | United Arab Emirates |
| Saudi Arabia | ||
| Rest of Middle East | ||
| Africa | South Africa | |
| Egypt | ||
| Rest of Africa | ||
| By Component | Software | ||
| Hardware | |||
| Services | |||
| By Technology | Augmented Reality (AR) | ||
| Virtual Reality (VR) | |||
| Mixed Reality (MR) | |||
| 3D Desktop / Spatial-Computing Displays | |||
| By Deployment Model | Cloud | ||
| On-Premises | |||
| Edge / On-Device | |||
| By Interaction Modality | Gesture-Based | ||
| Voice / NLP | |||
| Eye-Tracking | |||
| Haptic / Force-Feedback | |||
| Multimodal Fusion | |||
| By End-User Industry | Healthcare and Life Sciences | ||
| Manufacturing and Industrial | |||
| Retail and e-Commerce | |||
| Energy and Utilities | |||
| Education and Research | |||
| Media, Entertainment and Sports | |||
| Defense and Aerospace | |||
| Financial Services | |||
| By Geography | North America | United States | |
| Canada | |||
| Mexico | |||
| South America | Brazil | ||
| Argentina | |||
| Rest of South America | |||
| Europe | United Kingdom | ||
| Germany | |||
| France | |||
| Italy | |||
| Rest of Europe | |||
| Asia-Pacific | China | ||
| Japan | |||
| India | |||
| South Korea | |||
| Rest of Asia-Pacific | |||
| Middle East and Africa | Middle East | United Arab Emirates | |
| Saudi Arabia | |||
| Rest of Middle East | |||
| Africa | South Africa | ||
| Egypt | |||
| Rest of Africa | |||


Key Questions Answered in the Report
What is the current immersive analytics market size and how fast is it growing?
The immersive analytics market size is USD 3.48 billion in 2026 and is projected to reach USD 14.28 billion by 2031 on a 32.63% CAGR, according to Mordor Intelligence.
Which component segment leads spending?
Software commands 51.78% of 2025 spending because enterprises favor subscription platforms that embed immersive dashboards inside existing BI stacks, notes Mordor Intelligence.
Which region is expected to grow the fastest?
Asia-Pacific is forecast to register the highest 33.74% CAGR through 2031 due to national 3D-city programs and pervasive 5G rollouts.
Why are mixed-reality deployments accelerating?
Enterprises blend real-time sensor data with simulations to predict failures, a capability neither standalone AR nor VR delivers, so mixed-reality growth tops 33.03% CAGR.
What key restraint could slow adoption?
A global shortage of spatial-authoring talent raises project costs and delays deployments, shaving nearly 3 percentage points off forecast CAGR.
How concentrated is vendor competition?
The market scores 5 on a 10-point concentration scale because the top five players hold roughly 50% combined share, leaving ample room for niche specialists.
Page last updated on:


