GPU Database Market Size and Share
Market Overview
| Study Period | 2020 - 2031 |
|---|---|
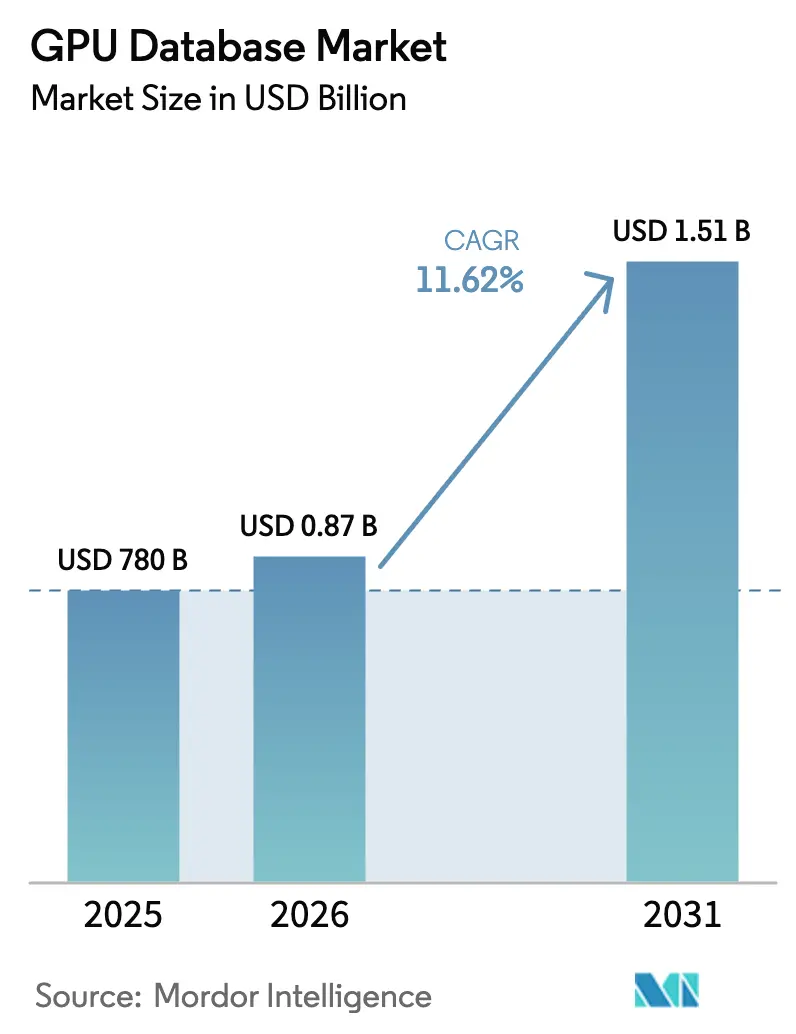
| Market Size (2026) | USD 0.87 Billion |
| Market Size (2031) | USD 1.51 Billion |
| Growth Rate (2026 - 2031) | 11.62% CAGR |
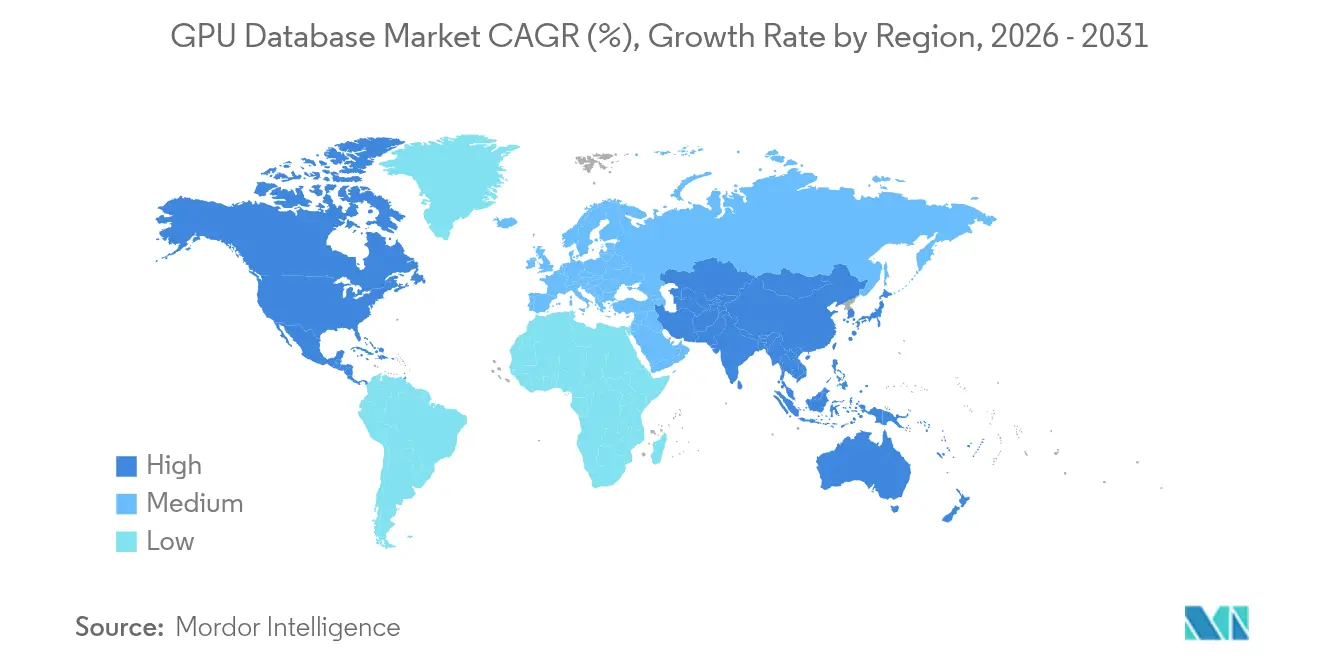
| Fastest Growing Market | Asia Pacific |
| Largest Market | North America |
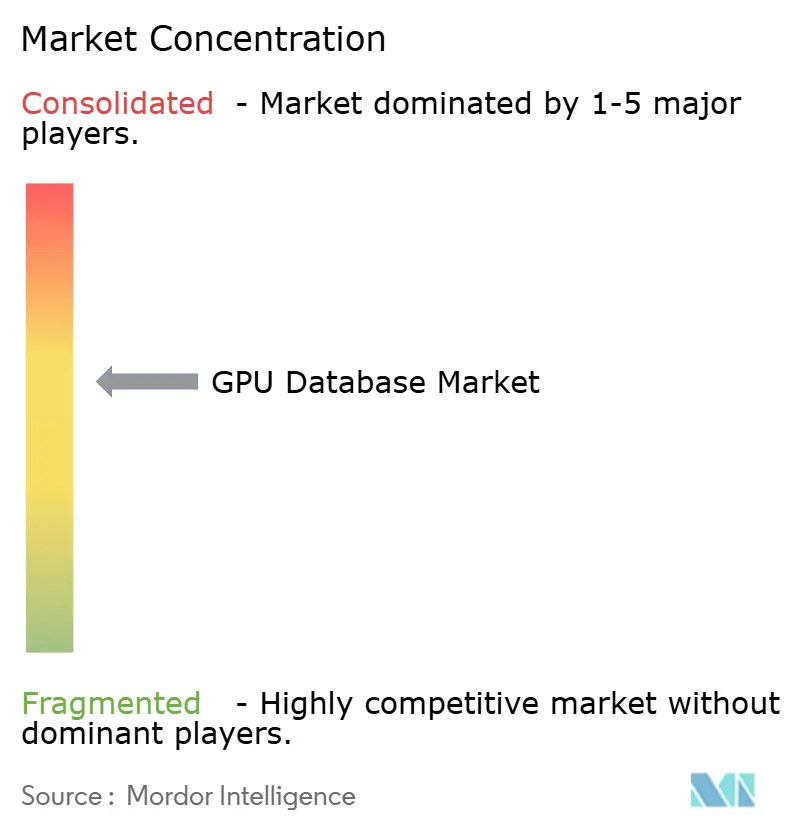
| Market Concentration | Medium |
Major Players *Disclaimer: Major Players sorted in no particular order Image © Mordor Intelligence. Reuse requires attribution under CC BY 4.0. | |
GPU Database Market Analysis by Mordor Intelligence
GPU database market size in 2026 is estimated at USD 870.64 million, growing from 2025 value of USD 780 million with 2031 projections showing USD 1.51 billion, growing at 11.62% CAGR over 2026-2031. Enterprises pursue these platforms to support real-time analytics, vector search for large language model (LLM) inference, and hybrid transactional / analytical workloads that remove ETL delays. North American hyperscalers scale out multi-tenant GPU clusters, Asia-Pacific governments subsidize AI infrastructure, and high-bandwidth memory (HBM) suppliers continue to report capacity sold out through 2025[1]Anton Shilov, “SK Hynix, Micron Report Sold-Out HBM Capacity Through 2025,” AnandTech, anandtech.com. Competitive dynamics center on the NVIDIA CUDA ecosystem, but alternative accelerators such as Groq LPUs and open-source SQL engines running on Apache Arrow have begun to reset performance expectations. Margin pressure from a 500% rise in HBM pricing, together with scarce CUDA talent, keeps smaller providers focused on vertical niches where switching costs remain high.
Key Report Takeaways
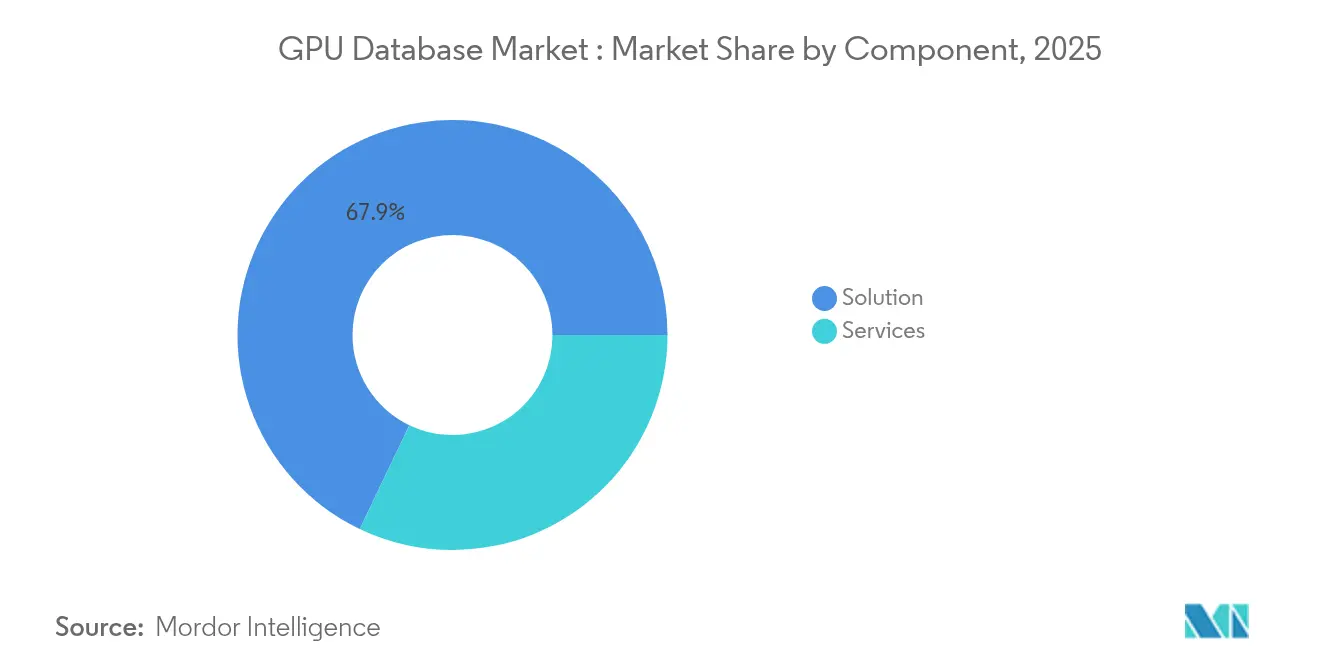
- By component, Solutions led with 67.90% of the GPU database market share in 2025, while Services posted the fastest growth at a 35.2% CAGR through 2031.
- By deployment model, Cloud accounted for 77.60% share of the GPU database market size in 2025 and is expanding at a 33.1% CAGR to 2031.
- By end-user industry, BFSI commanded 25.00% revenue share in 2025; Healthcare & Life Sciences is projected to grow at a 28.4% CAGR between 2026-2031.
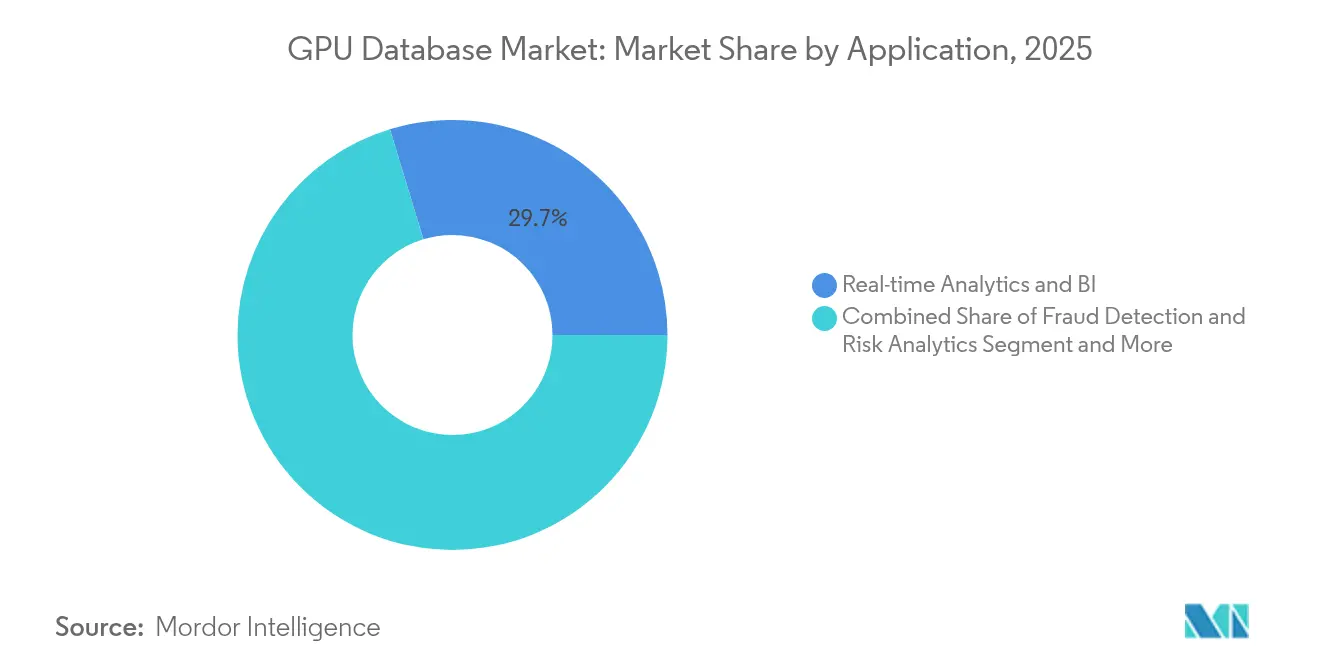
- By application, Real-time Analytics held 29.70% of the GPU database market size in 2025, whereas Fraud Detection & Risk Analytics records the highest projected CAGR at 31.5% through 2031.
- By data model, Column-store engines captured 44.10% share of the GPU database market size in 2025, while Vector / Document databases are advancing at a 38.9% CAGR to 2031.
- By geography, North America retained 41.10% GPU database market share in 2025; Asia-Pacific is set to expand at a 26.2% CAGR during the forecast window.
Note: Market size and forecast figures in this report are generated using Mordor Intelligence’s proprietary estimation framework, updated with the latest available data and insights as of 2026.
Global GPU Database Market Trends and Insights
Drivers Impact Analysis*
| Driver | (~) % Impact on CAGR Forecast | Geographic Relevance | Impact Timeline |
|---|---|---|---|
| Rising demand for real-time analytics | +3.2% | Global | Short term (≤ 2 years) |
| Proliferation of AI/ML workloads needing GPU acceleration | +4.1% | North America and Asia-Pacific | Medium term (2-4 years) |
| Explosive growth of LLM inference boosting vector-search DB adoption | +2.8% | Global, concentrated in US and China | Short term (≤ 2 years) |
| Convergence of analytical and transactional processing (HTAP) on GPUs | +1.9% | North America and EU | Long term (≥ 4 years) |
| Open-source GPU SQL engines maturing | +1.3% | Global | Medium term (2-4 years) |
| Edge-cloud GPU marketplaces lowering entry barriers | +0.9% | Asia Pacific core, spill-over to MEA | Long term (≥ 4 years) |
| Source: Mordor Intelligence | |||
Rising Demand for Real-Time Analytics
Financial institutions dismantle overnight batch routines in favor of continuous analytics that detect fraud within milliseconds. BNY Mellon’s deployment of an NVIDIA DGX SuperPOD enables immediate risk scoring across USD 48 trillion in assets under custody. Compliance teams benefit from sub-second visibility into anomalous transactions, and customer-facing applications personalize offers on the fly. GPU databases ingest time-series data streams in parallel, executing millions of concurrent aggregations that CPU systems queue sequentially. Edge architectures add resilience by performing latency-sensitive risk checks locally before synchronizing with cloud analytics. These gains reinforce enterprise appetite for scale-out GPU clusters despite tight HBM supply and rising electricity costs.
Proliferation of AI / ML Workloads Needing GPU Acceleration
Databricks’ integration of CUDA libraries shows how co-located storage and compute eliminate data-movement overheads for generative AI pipelines. Healthcare providers employ vector embeddings to triage medical images; UCLA’s SLIViT model reached expert-level accuracy on NVIDIA T4 and V100 GPUs. Matrix operations that dominate model inference align with the thousands of cores on a modern GPU, unlocking real-time radiology reporting and drug-discovery simulations. As reasoning-centric models push memory bandwidth requirements past 3 TB/s, GPU databases integrated with on-package HBM enjoy a structural advantage over DDR-bound CPU appliances. Enterprises thus allocate a growing fraction of AI budgets to in-database training and inference.
Explosive Growth of LLM Inference Boosting Vector-Search DB Adoption
E-commerce firms deploy vector databases to match products to user intent. A SaaS retailer on Zilliz Cloud performs semantic search across billions of reviews to refine recommendations. Similarity search scales with the number of embedding dimensions, and GPU parallelism keeps latency within interactive thresholds. FARFETCH’s Milvus-based conversational shopping agent illustrates how RAG architectures personalize browsing sessions in real time. As enterprise chatbots shift from keyword retrieval to embedding look-ups, GPU native vector indices integrate with transactional records to update recommendations mid-session. The cross-pollination of unstructured and structured data sources yields higher conversion and reduced cart abandonment.
Convergence of Analytical and Transactional Processing (HTAP) on GPUs
GPU clusters run ACID-compliant writes while answering analytical joins, erasing the historic split between OLTP and OLAP. Benchmark research on GPU OLTP engines shows thousands of parallel commits per second alongside complex four-way joins. Retailers recalibrate prices based on instantaneous inventory snapshots, and logistics managers reroute fleets using live telematics. Eliminating ETL copies cuts infrastructure overhead and curbs data-freshness errors. Over the long term, this trend lowers total cost of ownership and anchors the GPU database market as a default choice for mission-critical workloads.
Restraint Impact Analysis*
| Restraint | (~) % Impact on CAGR Forecast | Geographic Relevance | Impact Timeline |
|---|---|---|---|
| High implementation cost and integration complexity | -2.7% | Global, acute in emerging markets | Short term (≤ 2 years) |
| Scarcity of skilled CUDA / OpenCL database talent | -1.8% | Global, concentrated in Asia-Pacific | Medium term (2-4 years) |
| GPU supply-chain volatility and allocation to AI training clusters | -1.4% | Global | Short term (≤ 2 years) |
| Immature standards for persistent GPU memory management | -0.9% | Global | Long term (≥ 4 years) |
| Source: Mordor Intelligence | |||
High Implementation Cost and Integration Complexity
A single NVIDIA H100 retails near USD 40,000, and enterprise deployments often require dozens of units along with redundant InfiniBand fabrics. Oracle’s USD 40 billion purchase of NVIDIA inventory for an OpenAI facility underscores capital intensity at scale[2]Mike O’Connor, “Oracle to Spend USD 40 Billion on NVIDIA Chips for OpenAI,” Data Center Dynamics, datacenterdynamics.com. Facilities teams must upgrade power distribution and liquid cooling to manage 700 W per card. On the software front, DBAs face a steep learning curve when tuning CUDA kernels for index builds and shuffle operations. Mid-market firms offset capital hurdles via cloud instances, yet recurring compute bills can rival on-prem depreciation if workloads run continuously.
Scarcity of Skilled CUDA / OpenCL Database Talent
Global demand for engineers who grasp both relational optimization and GPU thread scheduling far exceeds supply. Many APAC enterprises cite six-month delays in filling senior positions. AMD’s expansion of ROCm to Windows and Linux aims to broaden the talent pool by supporting mainstream AI frameworks. However, mastery of warp-level parallelism and unified memory remains rare outside top research universities. Limited staff slows migration timelines and raises deployment risk, prompting some firms to adopt managed GPU database services despite higher operating costs.
*Our forecasts treat driver/restraint impacts as directional, not additive. The impact forecasts reflect baseline growth, mix effects, and variable interactions.
Segment Analysis
By Component: Solutions Drive Market with Services Accelerating
Solution offerings dominated revenue, holding 67.90% GPU database market share in 2025 as enterprises preferred off-the-shelf SQL, vector, and graph engines tuned for CUDA cores. This segment is projected to compound at 35.2% through 2031 as proof-of-concept pilots move into mission-critical production. Vendors compete by shipping converged data models inside unified runtimes, enabling a single cluster to serve time-series monitoring in parallel with semantic search. Open-source projects such as Apache Gluten deliver 23.45× SparkSQL speed-ups, reducing license outlays and expanding adoption among cost-sensitive users. Smaller developers integrate REST APIs for no-code analytics to tap line-of-business teams that lack SQL expertise.
Services account for the remaining share but register comparable growth as enterprises confront integration complexity. GPU schema design, memory optimization, and index partitioning require consulting engagements that often exceed license fees. System integrators bundle migration roadmaps, CUDA training workshops, and 24/7 performance monitoring, reinforcing the total contract value. As multi-tenant compliance audits become stricter, managed-service providers certify clusters for SOC 2 and ISO 27001 to secure finance and healthcare workloads. Together, Solutions and Services underpin the expanding GPU database market as users demand turnkey acceleration without sacrificing governance.


By Deployment Model: Cloud Dominance with Hybrid Architectures Emerging
Cloud delivery commanded 77.60% share of the GPU database market size in 2025, reflecting hyperscaler investments that allow instant provisioning of hundreds of H100 units on hourly terms. The same model is forecast to grow 33.1% annually as enterprises dodge capex and tap geographic redundancy. Providers such as Oracle plan 130,000 Blackwell GPUs across multiple regions to meet surging inference traffic. Consumption-based pricing aligns with bursty AI pipelines, enabling data-science teams to spin up clusters for experiments and tear them down after model validation.
Hybrid patterns now emerge as organizations pair cloud training with edge inference to reduce latency and data-sovereignty risk. NVIDIA DGX Cloud Lepton exposes elastic GPU pools while edge nodes execute real-time scoring on local replicas. Telecom operators exploit 5G networks to ship feature vectors back to regional cores that recalibrate models overnight. Highly regulated industries keep personally identifiable information on-prem and push anonymized embeddings to the cloud, satisfying privacy mandates. These hybrid designs exemplify how the GPU database market flexes to diverse workload placements.
By End-user Industry: BFSI Leadership with Healthcare Transformation
Banks, brokers, and insurers collectively held 25.00% of the GPU database market share in 2025, relying on streaming analytics for microsecond trade matching and Basel III liquidity calculations. Algorithmic traders archive order books directly in GPU memory to replay patterns during volatile sessions. Regulatory pressure for real-time stress testing further embeds GPU engines into treasury operations, locking in long replacement cycles.
Healthcare and life-science players fuel the fastest expansion at a 28.4% CAGR as radiology, genomics, and drug-discovery workflows migrate to GPU-native data stores. GE HealthCare’s autonomous imaging suite processes CT slices on-board, generating diagnostic reports during patient scans. Hospitals then federate de-identified images into national research clouds where cross-cohort analytics accelerate clinical trials. As reimbursement models shift to outcome-based metrics, GPU databases underpin real-time dashboards that monitor treatment efficacy across populations.
By Application: Real-time Analytics Foundation with Fraud Detection Acceleration
Real-time Analytics held 29.70% of the GPU database market size in 2025 as IT teams prioritized rapid dashboards and anomaly alerts for IoT telemetry and clickstream data. Streaming pipelines leverage windowed joins across billions of events to trigger inventory reallocations in seconds. GPU acceleration cuts report refresh cycles from minutes to milliseconds, enabling continuous intelligence.
Fraud Detection and Risk Analytics grows at 31.5% CAGR to 2031, capitalizing on graph traversal and vector similarity to flag suspicious patterns as they emerge. Payment processors execute 70-feature gradient-boosted trees on every card swipe, rejecting fraudulent attempts before authorization completes. Telecommunications carriers compare SIM swap requests against historical embeddings to spot social-engineering attacks. As attack surfaces widen, zero-trust policies require near-instant verdicts, and GPU engines provide the compute headroom.
By Data Model: Column-Store Stability with Vector Database Revolution
Column-store engines retained 44.10% GPU database market share in 2025 because columnar compression and scan-friendly layouts map efficiently to GPU memory bandwidth. Heavy.AI and SQream optimize predicate pushdown and dictionary encoding to sustain multi-TB per second throughput on HBM stacks. Finance and telecom operators stick with familiar SQL syntax while exploiting massively parallel scans for ad-hoc analytics.
Vector / Document databases register the sharpest climb at 38.9% CAGR, powered by LLM deployment. Milvus, Qdrant, and Weaviate index billions of 768-dimension embeddings for semantic search that traditional B-tree structures cannot handle. The GPU database industry now integrates approximate nearest-neighbor algorithms with ACID compliance so chatbots can fetch context while updating user sessions. Emerging multi-model engines layer columnar tables over vector indices, giving developers one API for metrics, logs, and embeddings.
Geography Analysis
North America generated the largest revenue slice in 2025 at 41.10% on the back of hyperscaler build-outs, Wall Street trading volumes, and early-stage healthcare AI deployments. Enterprises in the United States capitalize on proximity to NVIDIA’s developer ecosystem and to venture funding that sponsors GPU acceleration pilots. Canada’s public-sector AI strategy finances edge-ready GPU nodes for smart-city traffic flows, reinforcing regional demand.
Asia-Pacific shows the highest growth rate at 26.2% through 2031 as India, China, and Southeast Asian economies subsidize domestic AI supply chains. The IndiaAI Mission grants cloud credits that reduce GPU access costs to INR 67 (USD 0.77) per hour, boosting pilot projects across fintech and agri-tech. Chinese handset makers like Xiaomi assemble 10,000-GPU clusters to refine multimodal assistants despite export restrictions. Start-ups in Singapore and Korea exploit regional GPU marketplaces to rent idle accelerators during off-peak windows, lowering total cost of experimentation.
Europe maintains steady adoption, balancing GDPR requirements with the need for real-time analytics in manufacturing and energy. National frameworks such as GAIA-X promote sovereign cloud zones, nudging GPU vendors to certify for data-residency compliance. Meanwhile, the Middle East and Africa digitize oil fields and logistics corridors, deploying GPU databases for satellite-enhanced asset tracking. South American miners process hyperspectral images on-prem to reduce cloud bandwidth fees while tapping hybrid conferences for CUDA training. Together, these geographies diversify the GPU database market footprint and insulate it from single-region shocks.

Competitive Landscape
The market remains moderately consolidated around NVIDIA’s CUDA moat, which supplies mature libraries, driver support, and a large developer base. Heavy.AI, Kinetica, and SQream bundle proprietary kernels that exploit warp scheduling to exceed 100 GB/s query throughput. Their long-standing optimization expertise raises switching costs, locking in Fortune 500 contracts. Oracle and Microsoft embed GPU acceleration inside mainstream databases, compressing average selling prices and nudging specialized vendors to differentiate on advanced data models.
Disruptors challenge orthodoxy with fresh silicon and open licenses. Groq’s Logic Processing Unit advertises 18× faster inference, tempting teams to bypass CUDA altogether. Apache Gluten and Arrow deliver compile-time optimizations that approach proprietary performance while keeping code transparent, drawing attention from cost-sensitive cloud natives. Patent filings show an uptick in GPU-resident buffer management and dynamic NVLink routing, signaling an arms race in R&D spend.
Strategic moves accelerate consolidation. AMD acquired ZT Systems for USD 4.9 billion to integrate server design with Instinct GPU roadmaps. NVIDIA reportedly weighs Lepton AI to extend into workload orchestration. White-space remains at the network edge, where low-power accelerators and domain-specific kernels cater to drone fleets, retail kiosks, and autonomous warehouses. Collectively, these dynamics keep the GPU database market in flux while reinforcing barriers for late entrants.
GPU Database Industry Leaders
Heavy.AI (OmniSci)
Kinetica DB Inc.
SQream Technologies
NVIDIA
Brytlyt Ltd.
- *Disclaimer: Major Players sorted in no particular order

Recent Industry Developments
- June 2025: AMD acquired Brium to enhance AI software ecosystem and challenge NVIDIA’s CUDA dominance, marking AMD’s fourth acquisition in two years as part of a strategy to improve inference throughput.
- May 2025: Oracle announced USD 40 billion investment in NVIDIA chips for OpenAI’s Texas data center, underscoring record demand for large-scale GPU clusters.
- May 2025: AMD introduced the Radeon AI PRO R9700 with 32 GB GDDR6 and 1,531 AI TOPS, shipping July 2025 for professional acceleration workloads.
- March 2025: AMD completed a USD 4.9 billion acquisition of ZT Systems to bolster AI infrastructure offerings for GPU database deployments.


Research Methodology Framework and Report Scope
Market Definitions and Key Coverage
Our study defines the GPU database market as licensed software and related managed services that run database workloads mainly on Graphics Processing Units, delivering massively parallel real-time analytics on structured, semi-structured, and vector data in any deployment.
Bare-metal GPU servers, CPU-bound databases, and accelerators used solely for graphics rendering are not covered.
Segmentation Overview
- By Component
- Solution
- GPU SQL Engines
- GPU Vector Databases
- GPU Graph Databases
- Others
- Services
- Solution
- By Deployment Model
- Cloud
- On-Premises
- By End-user Industry
- BFSI
- IT and Telecom
- Retail and E-commerce
- Healthcare and Life-Sciences
- Government and Defense
- Other Industries
- By Application
- Real-time Analytics and BI
- Fraud Detection and Risk Analytics
- Geospatial and IoT Analytics
- Recommendation and Personalization
- Infrastructure Monitoring and Log Analytics
- By Data Model
- Column-Store
- Document / Vector
- Graph
- Multi-model
- By Geography
- North America
- United States
- Canada
- Mexico
- South America
- Brazil
- Argentina
- Rest of South America
- Europe
- United Kingdom
- Germany
- France
- Italy
- Spain
- Nordics
- Rest of Europe
- Middle East and Africa
- Middle East
- Saudi Arabia
- United Arab Emirates
- Turkey
- Rest of Middle East
- Africa
- South Africa
- Egypt
- Nigeria
- Rest of Africa
- Middle East
- Asia-Pacific
- China
- India
- Japan
- South Korea
- ASEAN
- Australia
- New Zealand
- Rest of Asia-Pacific
- North America
Detailed Research Methodology and Data Validation
Primary Research
Mordor analysts talk with cloud architects, data engineers in BFSI and retail, and system integrators across North America, Europe, and Asia-Pacific. Their insights confirm live licence prices, deployment scale, and pain points that textbooks miss.
Desk Research
We sift through public datasets like UN Comtrade trade logs, OECD Digital Economy Outlook, Eurostat cloud surveys, and US Energy Information Administration data-center statistics to anchor global GPU supply and usage. Patent snapshots from Questel, plus peer-reviewed articles, map emerging acceleration techniques, while company 10-Ks and investor decks reveal revenue splits between software and services. Further open records and paid feeds complete our evidence stack.
Market-Sizing & Forecasting
We begin top-down, multiplying quarterly GPU shipments by attach rates and the observed share devoted to database workloads. Sampled vendor revenues and cloud billing give bottom-up checks. Driver variables include GPU price trends, active vector-search instances, real-time analytics query growth, cloud GPU hours, and enterprise AI adoption. A multivariate regression projects each driver to 2030, with interview feedback guiding scenario weights. Where supplier roll-ups miss open-source installs, calibrated factors close the gap.
Data Validation & Update Cycle
Models pass variance screens, peer review, and senior sign-off. We refresh numbers each year, releasing tweaks when GPU shipments swing beyond five percent or landmark launches reset pricing.
Why Mordor's GPU Database Baseline Earns Trust
Published figures diverge because publishers pick unlike scopes, currencies, or refresh speeds.
By rooting totals in verified shipment data and cross-examining licence ratios with current users, we at Mordor Intelligence balance breadth with reality.
Benchmark comparison
| Market Size | Anonymized source | Primary gap driver |
|---|---|---|
| USD 0.78 Bn (2025) | Mordor Intelligence | - |
| USD 0.55 Bn (2024) | Global Consultancy A | Omits service revenue and cloud subscriptions |
| USD 0.46 Bn (2023) | Trade Journal B | Older base year, on-premise only |
| USD 0.51 Bn (2023) | Industry Association C | Vendor survey without audit |
These contrasts show how Mordor's disciplined scoping, fresher data, and multi-step checks deliver the balanced, transparent baseline that decision makers need.


Key Questions Answered in the Report
What is the current valuation of the GPU database market?
The GPU database market stands at USD 870.64 million in 2026 and is projected to reach USD 1.51 billion by 2031.
Which deployment model dominates GPU database adoption?
Cloud deployment leads with 77.60% revenue share in 2025, thanks to hyperscaler GPU availability and pay-per-use pricing.
Why are vector databases growing so quickly?
LLM inference and semantic search require high-dimensional similarity queries that GPUs handle efficiently, pushing vector / document databases to a 38.9% CAGR.
Which end-user industry is expanding the fastest?
Healthcare and Life Sciences shows the highest growth at 28.4% CAGR because of GPU-accelerated diagnostic imaging and genomics workloads.
What are the main barriers to adoption?
High hardware costs and a shortage of skilled CUDA practitioners slow roll-outs, especially in emerging markets.
How does HTAP influence GPU database demand?
By merging transactional and analytical processing in one engine, HTAP removes ETL delays and positions GPUs as the core platform for real-time decisioning.
Page last updated on:


