Graphics Tablet Market Size and Share
Market Overview
| Study Period | 2020 - 2031 |
|---|---|
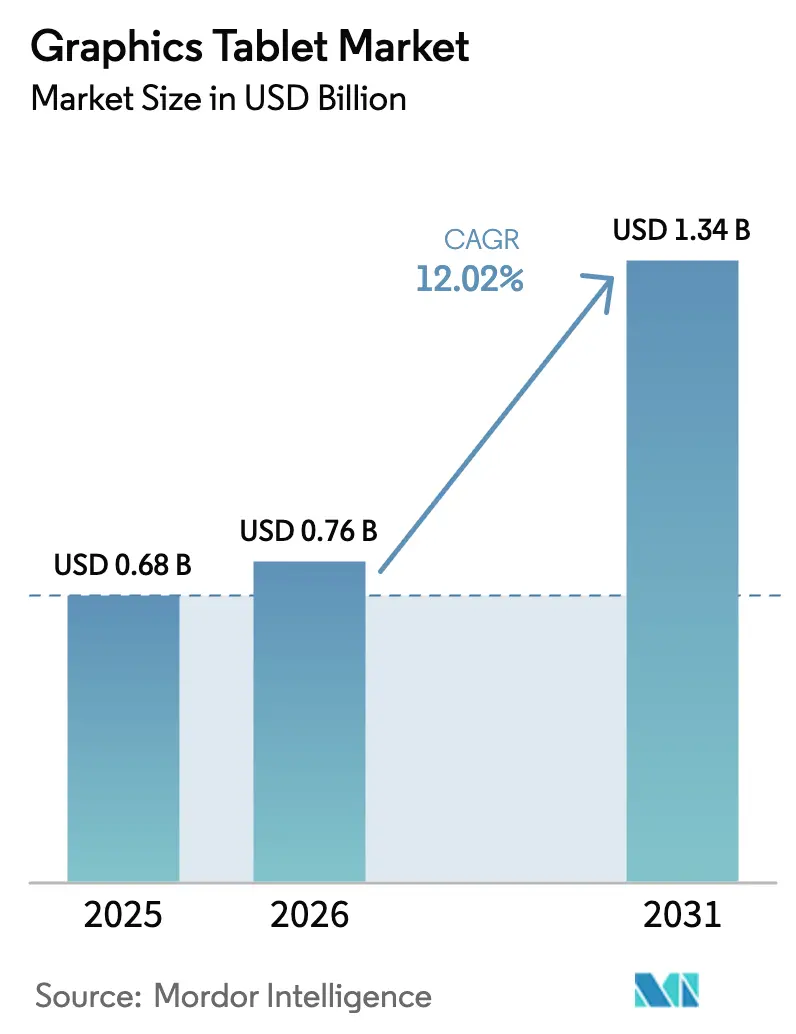
| Market Size (2026) | USD 0.76 Billion |
| Market Size (2031) | USD 1.34 Billion |
| Growth Rate (2026 - 2031) | 12.02% CAGR |
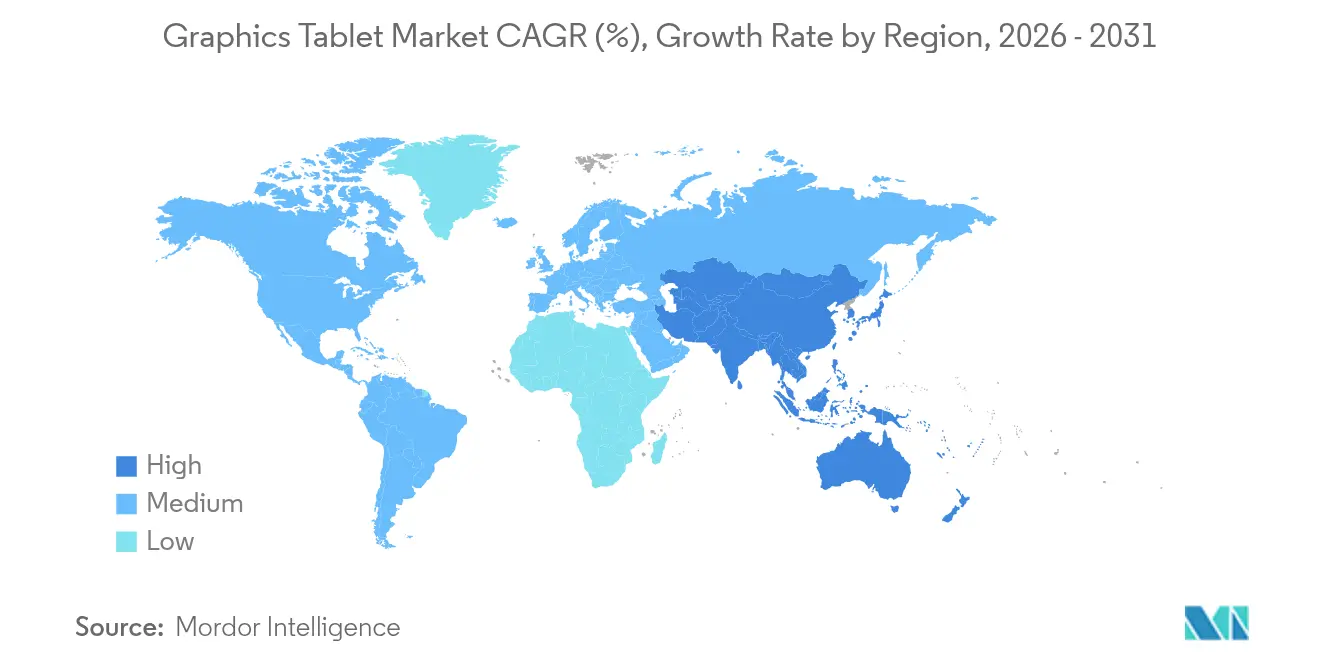
| Fastest Growing Market | Asia Pacific |
| Largest Market | North America |
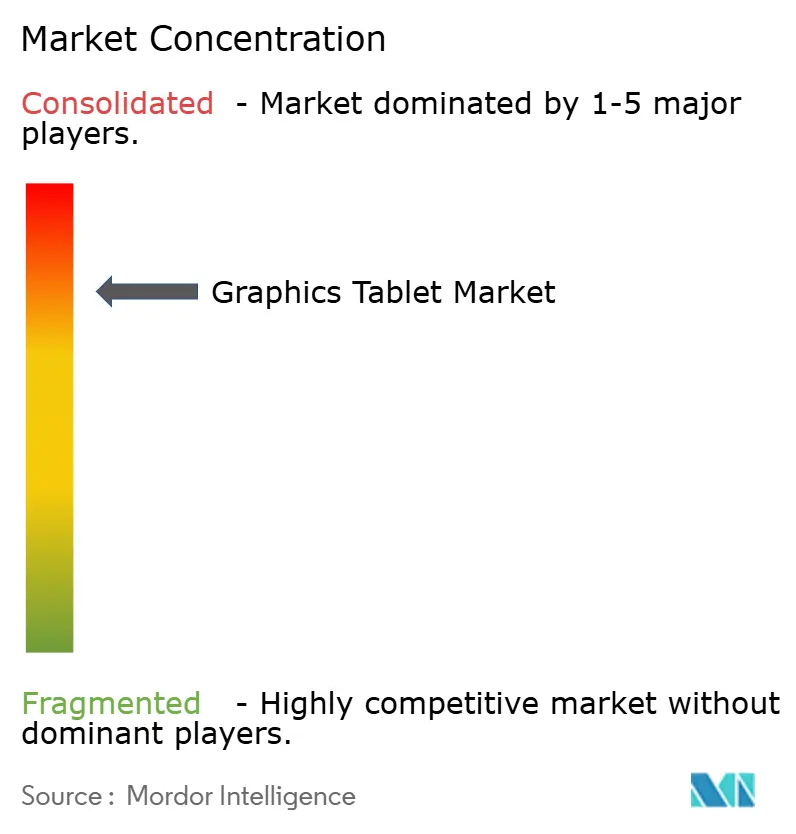
| Market Concentration | High |
Major Players *Disclaimer: Major Players sorted in no particular order Image © Mordor Intelligence. Reuse requires attribution under CC BY 4.0. | |
Graphics Tablet Market Analysis by Mordor Intelligence
The graphics tablet market size was valued at USD 0.68 billion in 2025 and estimated to grow from USD 0.76 billion in 2026 to reach USD 1.34 billion by 2031, at a CAGR of 12.02% during the forecast period (2026-2031). Robust growth stems from the mainstreaming of digital-first content workflows, the expansion of remote learning, and continuous improvements in stylus technology that narrow the gap between analog and digital creation. Falling average selling prices (ASPs) for entry-level devices continue to broaden the user base, while premium pen displays enjoy steady demand from professional and enterprise buyers seeking high-precision input. Rapid gains in wireless connectivity and AI-enabled feature sets signal a shift toward integrated, standalone solutions that boost productivity across creative and industrial contexts. Competitive pressure is intensifying as Chinese vendors leverage cost advantages and feature parity to challenge long-standing incumbents, prompting all vendors to emphasize software-hardware ecosystems that lock in users and capture recurring revenue.
Key Report Takeaways
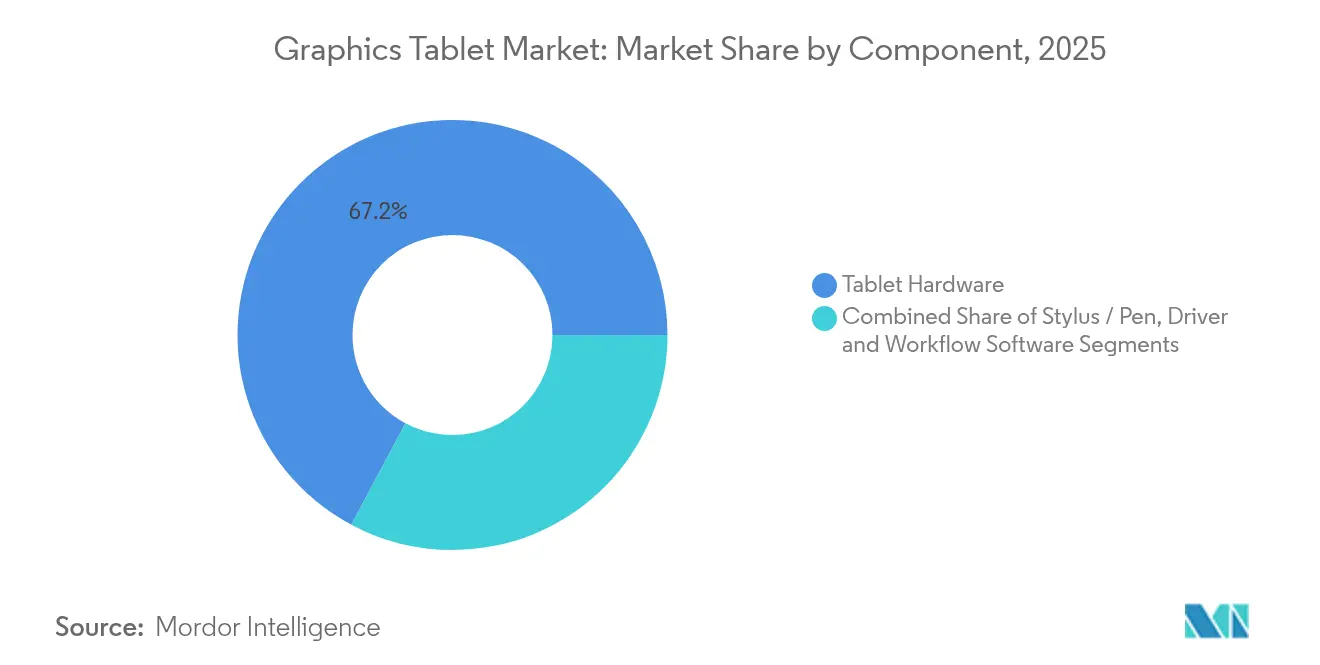
- By component, tablet hardware commanded 67.20% of the graphics tablet market share in 2025, while driver and workflow software are set to post the highest 12.99% CAGR by 2031.
- By connectivity, wired USB retained a 64.10% share of the graphics tablet market size in 2025, yet wireless solutions are poised to grow at 15.24% CAGR.
- By price band, Professional (≥ USD 500) retained a 45.30% share of the graphics tablet market size in 2025, and Professional (≥ USD 500) is poised to grow at 14.52% CAGR.
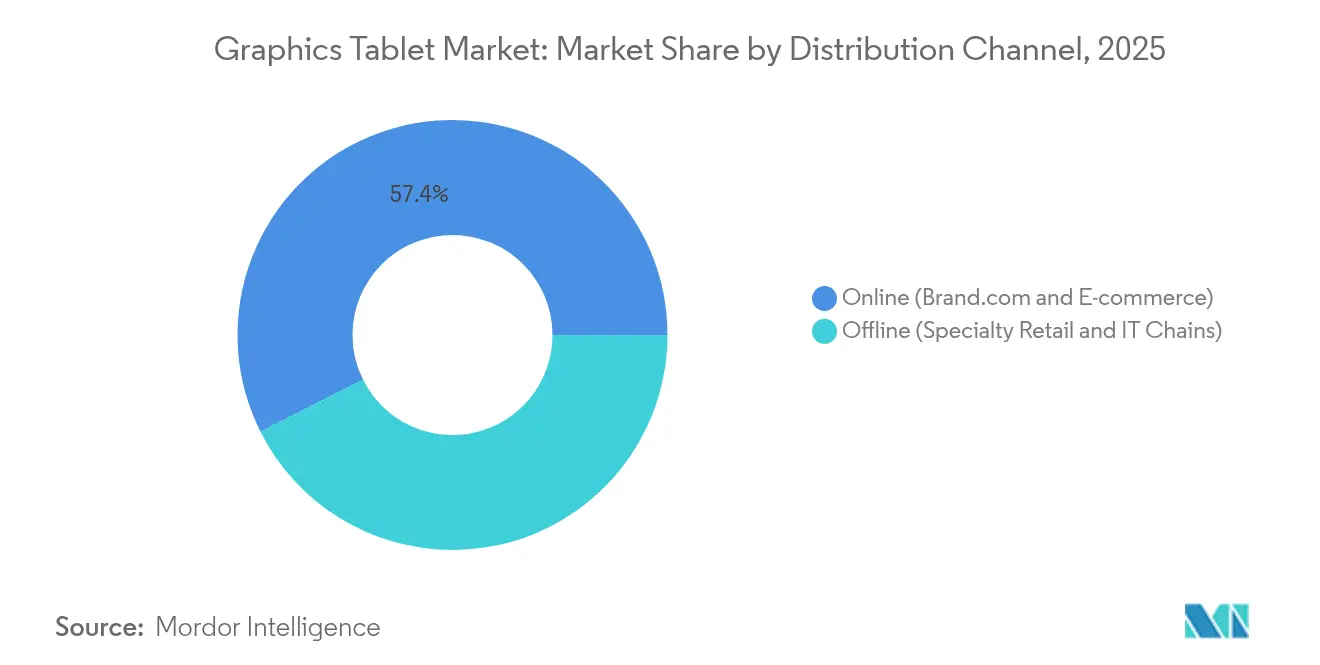
- By distribution channel, online retained a 57.40% share of the graphics tablet market size in 2025, yet online is poised to grow at 15.31% CAGR.
- By end user, professional artists and illustrators held 34.60% revenue share of the graphics tablet market in 2025; enterprise and industrial designers are projected to expand at a 13.44% CAGR through 2031.
- By geography, North America led with 42.50% revenue share in 2025; Asia-Pacific is forecast to rise at a 15.92% CAGR through 2031.
Note: Market size and forecast figures in this report are generated using Mordor Intelligence’s proprietary estimation framework, updated with the latest available data and insights as of 2026.
Global Graphics Tablet Market Trends and Insights
Drivers Impact Analysis*
| Driver | (≈) % Impact on CAGR Forecast | Geographic Relevance | Impact Timeline |
|---|---|---|---|
| Rise in digital-content creation across industries | +3.2% | Global | Medium term (2-4 years) |
| Expansion of e-learning and remote classrooms | +2.8% | Global; strong in Asia-Pacific and North America | Short term (≤ 2 years) |
| Falling ASPs of entry-level pen tablets | +2.1% | Global; emerging markets | Short term (≤ 2 years) |
| Bundling of tablets with creative-software subscriptions | +1.9% | North America and EU | Medium term (2-4 years) |
| Pen-enabled industrial-design workflows in Industry 4.0 | +1.6% | Asia-Pacific core, spill-over to North America and EU | Long term (≥ 4 years) |
| On-device AI features boosting stylus productivity | +1.4% | Global; early adoption in North America | Long term (≥ 4 years) |
| Source: Mordor Intelligence | |||
Rise in digital-content creation across industries
Explosive adoption of AI-assisted design and generative image tools is reshaping creative pipelines, with Adobe’s Firefly platform alone generating more than 7 billion images since launch.[1]Adobe Communications Team, “Adobe Firefly Image 3 Powers 7 Billion Generations,” adobe.com Graphics tablets now serve as precision front ends for these workflows, shortening iteration cycles and raising design quality in sectors ranging from entertainment to automotive prototyping. Enterprises increasingly treat pen tablets as productivity equipment rather than discretionary accessories, driving procurement of professional-grade models that integrate seamlessly with CAD and 3-D visualization tools. Vendors have responded by adding advanced EMR pens that support tilt, rotation, and 8,000-plus pressure levels, enhancing fidelity for industrial users. As personalized visual content becomes standard in marketing and product development, demand for accurate, pressure-sensitive input continues to escalate.
Expansion of e-learning and remote classrooms
Hybrid learning formats have normalized real-time digital annotation and diagramming, turning graphics tablets into staple teaching aids. Wacom’s education program, active for nearly four decades, now targets school districts that are outfitting science and math staff with pen tablets for interactive problem-solving.[2]Wacom Education Division, “Empowering Hybrid Classrooms,” wacom.com Asia-Pacific governments are accelerating uptake through public tenders that place tablets in primary and secondary classrooms. XP-Pen has bundled cloud-whiteboard software with entry-level devices to allow teachers to create hand-drawn lesson content on any video-conferencing platform. Because education hardware refresh cycles typically span three to five years, recurring demand is expected as initial pandemic-era deployments come due for replacement.
Falling ASPs of entry-level pen tablets
Scale manufacturing and component cost declines have pushed sub-USD 100 devices into mass-market territory. Huion’s Kamvas Slate 11 launches at USD 299, while its Star series drops below USD 30, extending graphics-tablet ownership to hobbyists and first-time creators. Lower entry barriers widen the installed base, which in turn attracts software developers building pen-optimized applications, reinforcing market momentum. However, razor-thin margins force vendors to seek differentiation via firmware, driver optimization, and bundled creative tools that encourage step-up purchases. Sustaining aggressive pricing while funding RandD will remain a balancing act over the forecast horizon.
Bundling of tablets with creative-software subscriptions
Hardware makers are shifting from one-off sales to ecosystem monetization by packaging tablets with multi-year software licenses. Wacom’s offering of up-to-six-month trials of leading illustration suites has helped convert trial users into paid subscribers. Celsys, publisher of CLIP STUDIO PAINT, reported record April 2025 revenue of JPY 800 million (USD 5.3 million) after expanding its bundle partnerships with pen-tablet vendors. The model secures recurring revenue while giving end users an integrated out-of-box workflow, strengthening brand allegiance and raising switching costs.
Restraints Impact Analysis*
| Restraint | (~) % Impact on CAGR Forecast | Geographic Relevance | Impact Timeline |
|---|---|---|---|
| High upfront cost of professional pen displays | −2.4% | Global; price-sensitive emerging markets | Medium term (2-4 years) |
| Competition from capacitive-touch tablets and 2-in-1 PCs | −1.8% | Global; strongest in consumer segments | Short term (≤ 2 years) |
| Supply crunch of EMR controller ICs | −1.2% | Global; manufacturing concentrated in Asia | Short term (≤ 2 years) |
| E-waste and sustainability concerns | −0.8% | EU and North America | Long term (≥ 4 years) |
| Source: Mordor Intelligence | |||
High upfront cost of professional pen displays
Flagship 4-K pen displays such as Wacom’s Cintiq Pro retail near USD 3,500, a sum that limits adoption to studios and enterprises with clear ROI cases. Although Chinese brands have narrowed the gap with USD 1,300 24-inch alternatives, many freelance artists and SMB design teams still hesitate to commit capital. Financing programs, subscription hardware, and trade-in options are beginning to soften the barrier, yet the premium tier will remain price-elastic until manufacturing yields lower cost per panel.
Competition from capacitive-touch tablets and 2-in-1 PCs
Multi-purpose devices such as Microsoft’s Surface Pro and Apple’s iPad Pro now ship with stylus options that rival entry-level pen tablets in pressure sensitivity and tilt detection.[3]Microsoft Corporation, “Microsoft 365- for Business,” microsoft.com For casual creators and students, the appeal of an all-in-one device can outweigh the marginal precision gains of a dedicated tablet. Graphics-tablet vendors are countering by emphasizing battery-free EMR pens, superior latency, and workflow shortcuts tailored to professional software. The ongoing feature race underscores the need for clear differentiation in ergonomics, driver stability, and industrial-design compatibility.
*Our forecasts treat driver/restraint impacts as directional, not additive. The impact forecasts reflect baseline growth, mix effects, and variable interactions.
Segment Analysis
By Component: Hardware Dominance Amid Software Growth
Tablet hardware retained 67.20% of the graphics tablet market share in 2025, affirming the enduring centrality of physical input devices in creative workflows. Vendors continue to refine EMR digitizers, laminated panels, and customizable shortcut keys that raise user efficiency. The parallel surge in driver and workflow platforms, posting a 12.99% CAGR, underscores how monetization is migrating toward integrated ecosystems. Wacom’s Pro Pen 3 and XP-Pen’s 16-K-level stylus illustrate hardware advances that rely on sophisticated firmware for tilt calibration and pressure-curve mapping.
The software boom signals a transition to subscription revenue, as illustrated by CLIP STUDIO PAINT surpassing 48 million cumulative shipments and posting USD 5.3 million monthly sales in April 2025. Driver suites that shave latency to sub-8 ms and enable cross-platform compatibility have become decisive purchase criteria, turning software quality into a tangible value driver. As a result, the graphics tablet market size for software is projected to erode hardware’s contribution to overall growth by the end of the decade.


By Connectivity: Wireless Transformation Accelerates
Wired USB links still anchored 64.10% of the graphics tablet market size in 2025, favored for zero-lag performance and assured power delivery. Yet the 15.24% CAGR recorded by wireless models reflects rising demand for clutter-free desks and mobile workflows. Bluetooth 5-plus chipsets now achieve latency below 8 ms, while proprietary RF links in premium devices hit sub-4 ms, meeting the strict tolerances of professional animators.
Standalone tablets such as XP-Pen’s Magic Drawing Pad run full Android stacks and connect wirelessly to cloud storage, allowing creators to sketch on location and sync files later. Expect future products to adopt dual-mode designs that revert to USB-C for power-hungry tasks such as color grading on 4-K pen displays. In turn, cable-free convenience will remain a pivotal differentiator in enterprise mobility rollouts.
By Price Band: Professional Segment Drives Premium Growth
Devices priced ≥ USD 500 accounted for 45.30% of 2025 revenue and are forecast to expand 14.52% annually, reinforcing the willingness of professionals to pay for color-accurate, low-parallax displays. High-end buyers demand durable chassis, etched-glass surfaces, and advanced express-key layouts that speed repetitive tasks.
Mid-range products between USD 100 and USD 499 provide balanced feature sets for serious hobbyists, feeding future upgrades into the premium tier. Entry devices below USD 100, exemplified by XP-Pen’s Star G640, continue to democratize digital art creation, seeding a broad user community. This pyramid supports a healthy upgrade cadence, as first-time users eventually transition to higher tiers when workload complexity rises.
By Distribution Channel: Online Dominance Accelerates
E-commerce captured 57.40% of 2025 sales and is projected to grow 15.31% per year as creators rely on user reviews, unboxing videos, and spec comparisons before committing to purchase. Direct-to-consumer storefronts afford vendors higher margins and data insights that inform rapid product iterations.
Brick-and-mortar specialty outlets retain relevance for high-value pen displays where customers demand hands-on evaluation of panel quality and pen feel. Click-and-collect and showroom-only models are emerging to bridge online research with in-store validation, reinforcing an omnichannel approach that maximizes reach without diluting brand experience.
By End User: Enterprise Adoption Accelerates
Professional artists and illustrators remained the largest cohort with 34.60% revenue share in 2025, buoyed by ongoing content production for gaming, advertising, and streaming. Meanwhile, enterprise and industrial designers are projected to expand at 13.44% CAGR as Industry 4.0 workflows integrate pen-enabled CAD for rapid prototyping and human-machine interface design.
Design and animation studios continue to specify large-format pen displays for storyboarding and frame-by-frame animation, while education institutions invest in classroom bundles that pair tablets with teaching software. Entry-level hobbyist uptake, driven by low ASPs, enlarges the installed base from which future professional demand will emerge, keeping the graphics tablet market on a sustainable growth path.
Geography Analysis
North America maintained 42.50% revenue share in 2025 owing to mature entertainment, advertising, and technology ecosystems that depend on high-fidelity digital input. Corporate adoption of graphics tablets in remote collaboration setups and K-12 tech initiatives sustains baseline growth. Strategic alliances, such as Wacom’s EMR partnership for Samsung’s S Pen in the Galaxy S24 Ultra, reinforce the region’s innovation credentials.
Asia-Pacific is forecast to post a 15.92% CAGR, the highest worldwide, propelled by rapid digitalization, thriving animation industries, and heavy state investment in e-learning. Local champions Huion, XP-Pen, and Ugee reap supply-chain efficiencies to ship competitively priced models worldwide. Japan’s manga sector, South Korea’s gaming studios, and India’s expanding design curricula collectively generate outsized demand. China’s government drive for digital classrooms further accelerates penetration, cementing APAC’s status as the primary volume engine of the graphics tablet market.

Competitive Landscape
Wacom continues to dominate the graphics tablet market, retaining more than 90% of professional-tier revenue by combining proprietary EMR pen technology with a deep software partner network. Challengers Huion, XP-Pen and Ugee are narrowing the gap by matching high pressure-level pens to competitive price points, forcing incumbents to differentiate through display quality, latency and driver stability. Market entry barriers have therefore shifted from core digitizer patents to ecosystem breadth, giving smaller vendors room to scale in price-sensitive segments while premium buyers remain loyal to long-standing workflows.
Strategic moves over the past 18 months underscore two diverging playbooks. Wacom refreshed its flagship Intuos Pro line in February 2025, adding the modular Pro Pen 3, customizable ExpressKeys and a thinner chassis to reinforce its premium positioning. Huion answered with Kamvas Slate 11 and 13, the company’s first 90 Hz Android pen tablets that run creative apps without a PC, signaling a push into fully mobile workflows. XP-Pen broadened its reach by introducing the Magic Note Pad, a 3-in-1 color E-ink device that blends note-taking, drawing and e-reader functions, thereby tapping the education and knowledge-worker segments. These rollouts collectively highlight a pivot toward feature-rich standalone form factors that promise new recurring revenue from app stores and cloud subscriptions.
Graphics Tablet Industry Leaders
Wacom Co., Ltd.
XP-Pen Technology Co., Ltd.
Shenzhen Ugee Technology Co., Ltd.
Shenzhen Huion Animation Technology Co., Ltd.
Artisul
- *Disclaimer: Major Players sorted in no particular order

Recent Industry Developments
- June 2025: Wacom unveiled new Cintiq tablets featuring slimmer designs and improved displays, enhancing user experience with advanced pen technology and better color accuracy
- April 2025: Huion launched the Kamvas Slate 11 and 13 Android tablets priced at USD 299 and USD 459 respectively, expanding their standalone drawing tablet portfolio with 90Hz refresh rates and 8GB RAM configurations.
- March 2025: XP-Pen introduced the Magic Note Pad, the world's first 3-in-1 color note pad priced at USD 439.99, featuring Android 14 operation and 16,384 pressure levels.
- February 2025: Wacom redesigned its flagship Intuos Pro pen tablet with Pro Pen 3 technology, customizable controls, and improved ergonomics, priced from USD 249.95 to USD 499.95.


Global Graphics Tablet Market Report Scope
A graphics tablet is a computer input device that enables a user to hand draw or paint images, animations and graphics, with a special pen-like stylus, similar to the way a person draws pictures.
The graphics tablet market is segmented by component (tablet, stylus, software), by distribution channel (online, offline), by end-user (professional artists, design studios, educational institutions, other end-users), by geography (North America, Europe, Asia-Pacific, Latin America, Middle East and Africa). The market sizes and forecasts are provided in terms of value (USD) for all the above segments.
| Tablet Hardware |
| Stylus / Pen |
| Driver and Workflow Software |
| Wired USB |
| Wireless (Bluetooth / RF) |
| Entry (Less than USD 100) |
| Mid-range (USD 100 - 499) |
| Professional (Greater than or Equal to USD 500) |
| Online (Brand.com and E-commerce) |
| Offline (Specialty Retail and IT Chains) |
| Professional Artists and Illustrators |
| Design and Animation Studios |
| Education and E-learning Institutions |
| Enterprise and Industrial Designers |
| Hobbyists and Home Users |
| North America | United States | |
| Canada | ||
| Mexico | ||
| South America | Brazil | |
| Argentina | ||
| Rest of South America | ||
| Europe | United Kingdom | |
| Germany | ||
| France | ||
| Italy | ||
| Spain | ||
| Russia | ||
| Rest of Europe | ||
| Asia-Pacific | China | |
| Japan | ||
| India | ||
| South Korea | ||
| Australia and New Zealand | ||
| Rest of Asia-Pacific | ||
| Middle East and Africa | Middle East | Saudi Arabia |
| UAE | ||
| Turkey | ||
| Rest of Middle East | ||
| Africa | South Africa | |
| Nigeria | ||
| Kenya | ||
| Rest of Africa | ||
| By Component | Tablet Hardware | ||
| Stylus / Pen | |||
| Driver and Workflow Software | |||
| By Connectivity | Wired USB | ||
| Wireless (Bluetooth / RF) | |||
| By Price Band | Entry (Less than USD 100) | ||
| Mid-range (USD 100 - 499) | |||
| Professional (Greater than or Equal to USD 500) | |||
| By Distribution Channel | Online (Brand.com and E-commerce) | ||
| Offline (Specialty Retail and IT Chains) | |||
| By End-user | Professional Artists and Illustrators | ||
| Design and Animation Studios | |||
| Education and E-learning Institutions | |||
| Enterprise and Industrial Designers | |||
| Hobbyists and Home Users | |||
| By Geography | North America | United States | |
| Canada | |||
| Mexico | |||
| South America | Brazil | ||
| Argentina | |||
| Rest of South America | |||
| Europe | United Kingdom | ||
| Germany | |||
| France | |||
| Italy | |||
| Spain | |||
| Russia | |||
| Rest of Europe | |||
| Asia-Pacific | China | ||
| Japan | |||
| India | |||
| South Korea | |||
| Australia and New Zealand | |||
| Rest of Asia-Pacific | |||
| Middle East and Africa | Middle East | Saudi Arabia | |
| UAE | |||
| Turkey | |||
| Rest of Middle East | |||
| Africa | South Africa | ||
| Nigeria | |||
| Kenya | |||
| Rest of Africa | |||


Key Questions Answered in the Report
How big is the graphics tablet market in 2026?
The graphics tablet market is worth USD 0.76 billion in 2026 and is projected to reach USD 1.34 billion by 2031.
Which company holds the largest share of professional-grade graphics tablets?
Wacom maintains more than 90% share of the professional segment due to its proprietary EMR technology and extensive software partnerships.
What is the fastest-growing regional market for graphics tablets?
Asia-Pacific leads growth with a forecast 15.92% CAGR through 2031, driven by expanding digital education programs and local manufacturing advantages.
Why are wireless graphics tablets gaining traction?
Wireless models offer cable-free mobility, quick device switching and desktop decluttering, and are forecast to grow at a 15.24% CAGR.
Page last updated on:


