Coconut Derivatives Market Size and Share
Market Overview
| Study Period | 2021 - 2031 |
|---|---|
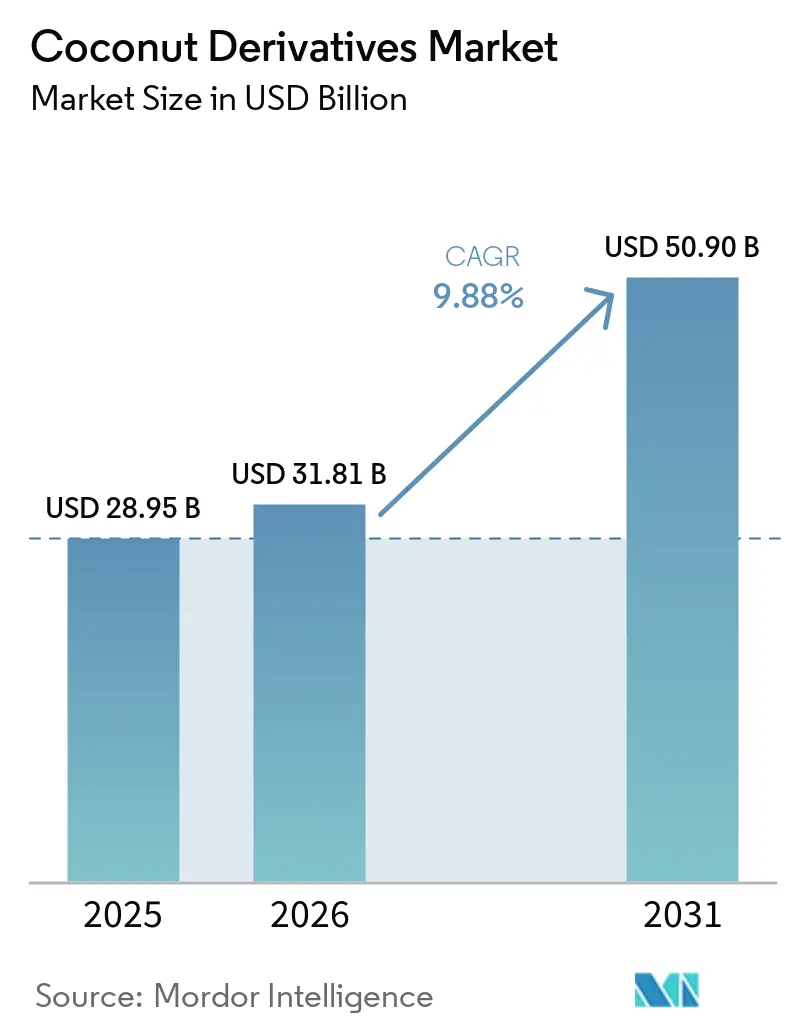
| Market Size (2026) | USD 31.81 Billion |
| Market Size (2031) | USD 50.90 Billion |
| Growth Rate (2026 - 2031) | 9.88% CAGR |
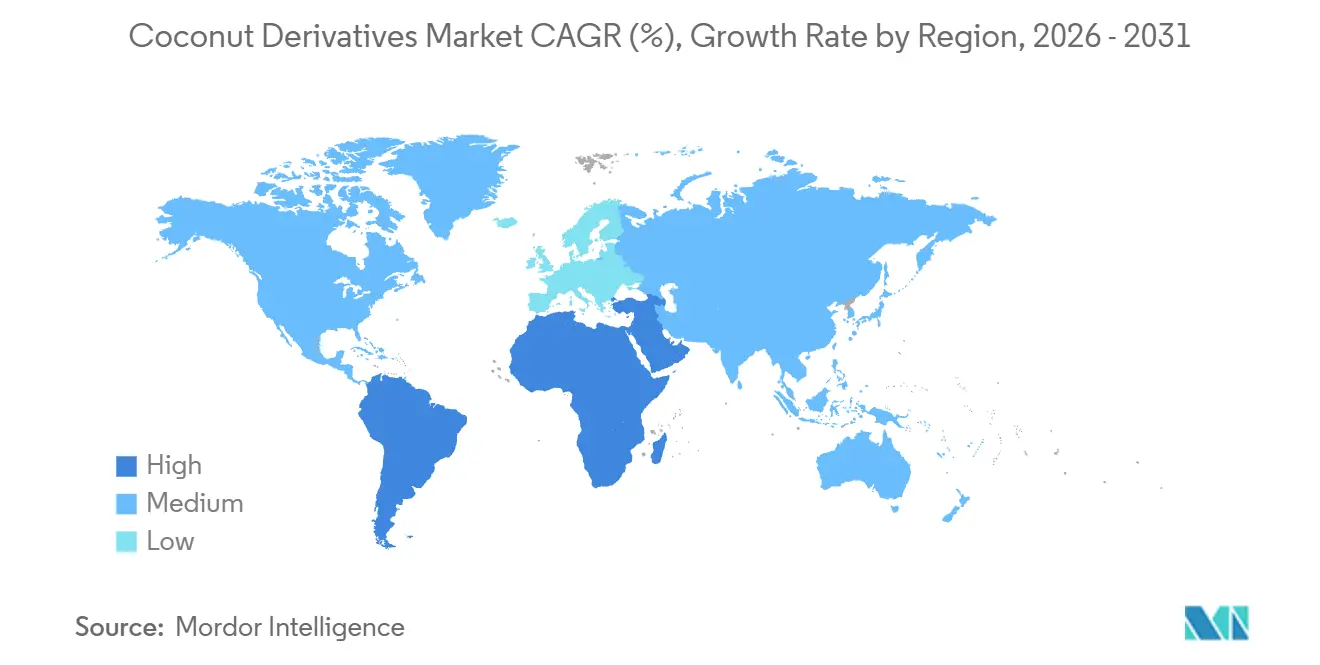
| Fastest Growing Market | Middle East and Africa |
| Largest Market | Asia-Pacific |
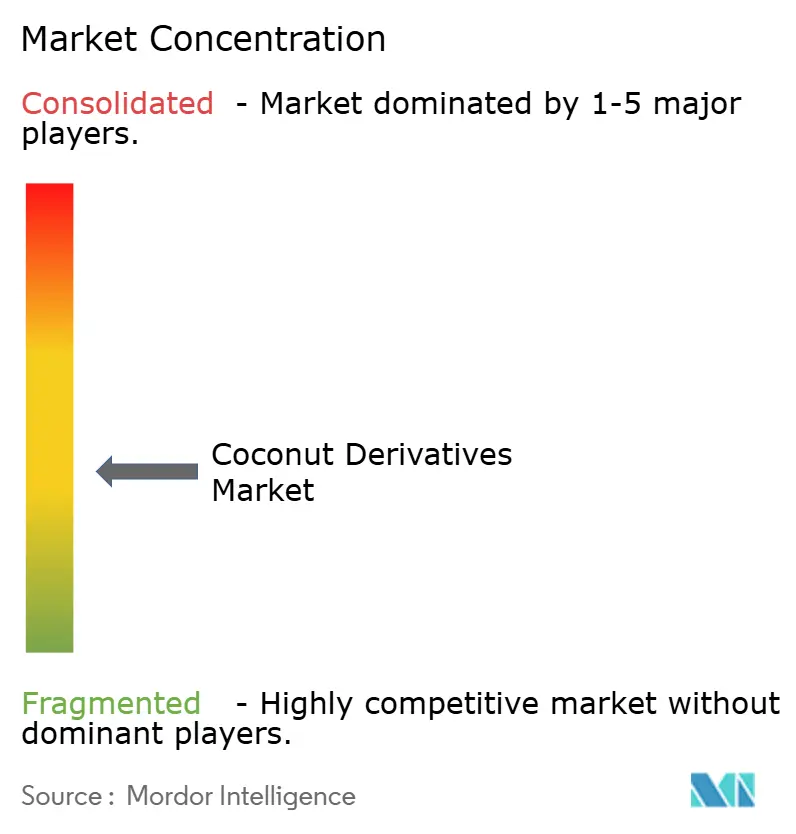
| Market Concentration | Medium |
Major Players
*Disclaimer: Major Players sorted in no particular order Image © Mordor Intelligence. Reuse requires attribution under CC BY 4.0. |
|
Coconut Derivatives Market Analysis by Mordor Intelligence
The coconut derivatives market is projected to grow from USD 28.95 billion in 2025 to USD 31.81 billion in 2026 and reach USD 50.90 billion by 2031, with a CAGR of 9.88% from 2026 to 2031. Rising demand for plant-based nutrition, functional hydration, and traceable raw materials is driving growth in food, beverage, cosmetics, and oleochemicals. Industrial buyers prefer lauric-acid-rich feedstocks for surfactants and emulsifiers, while retailers promote coconut water, milk, and sugar as clean-label alternatives to synthetic or dairy products. Innovations like high-pressure processing (HPP) and aseptic cartons are extending shelf life, cutting cold-chain costs, and improving rural market access. Asia-Pacific, led by Indonesia, the Philippines, and Thailand, supplies over 70% of copra and fresh nuts. The Middle East and Africa are the fastest-growing markets due to packaged beverage imports and halal cosmetics. Despite moderate fragmentation, brands like The Vita Coco Company and Marico dominate premium shelves through integrated sourcing and product innovation.
Key Report Takeaways
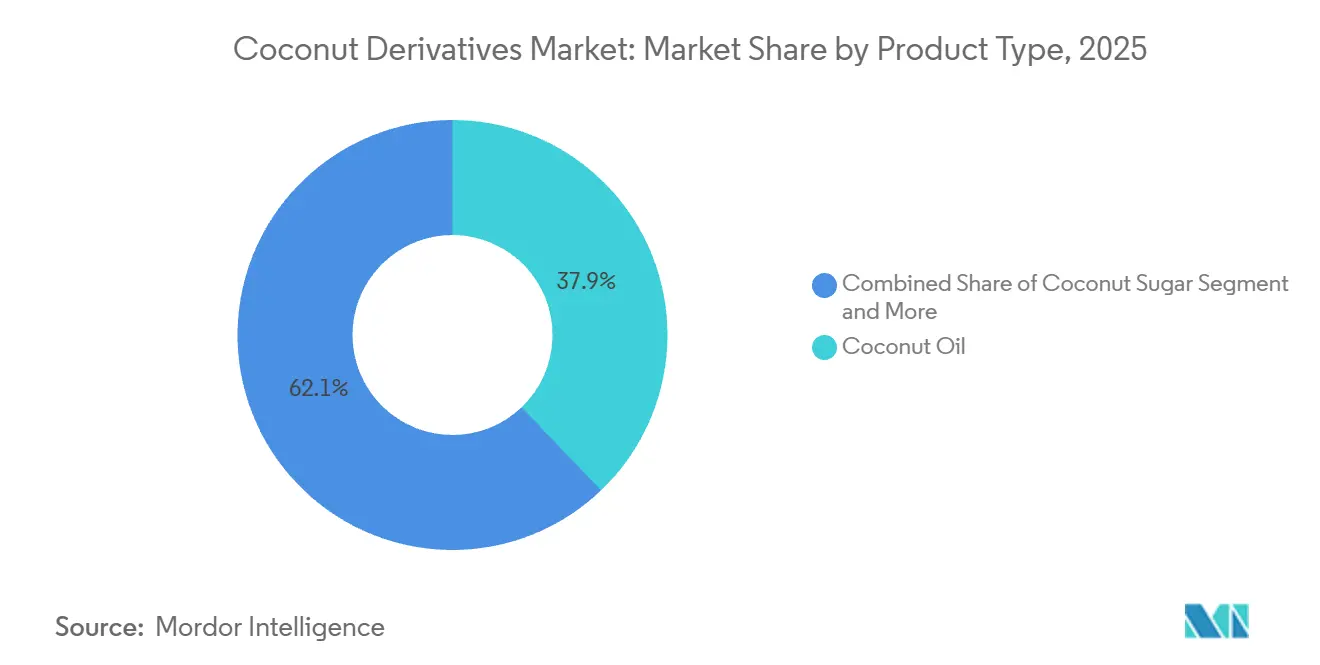
- By product type, coconut oil led with 37.86% revenue share in 2025; coconut sugar is forecast to expand at a 10.56% CAGR to 2031.
- By packaging, bottles retained 27.63% of the coconut derivatives market share in 2025, while pouches and Tetrapack formats are advancing at an 11.28% CAGR through 2031.
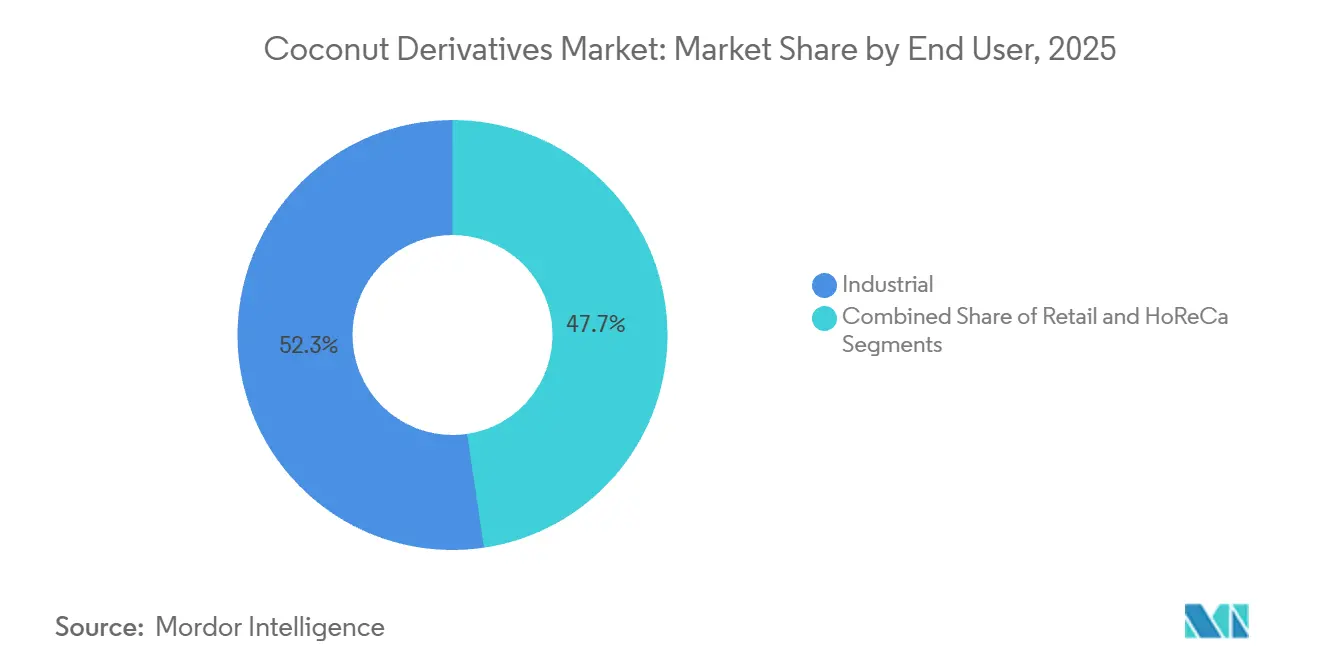
- By end user, the industrial segment held 52.34% share of the coconut derivatives market size in 2025, and retail channels are progressing at a 12.32% CAGR to 2031.
- By geography, Asia-Pacific commanded 47.63% share in 2025; the Middle East and Africa recorded the highest projected CAGR at 10.56% through 2031.
Note: Market size and forecast figures in this report are generated using Mordor Intelligence’s proprietary estimation framework, updated with the latest available data and insights as of January 2026.
Global Coconut Derivatives Market Trends and Insights
Drivers Impact Analysis*
| Driver | (~) % Impact on CAGR Forecast | Geographic Relevance | Impact Timeline |
|---|---|---|---|
| Focus on plant-based fats like MCTs in coconut oil for energy and metabolism support | +2.1% | Global, with concentration in North America and Europe | Medium term (2-4 years) |
| Vegan diets drive demand for coconut milk, water, and flour as dairy alternatives | +1.8% | Global, strongest in North America, Europe, and urban Asia-Pacific | Short term (≤ 2 years) |
| Advancements in processing technologies improve shelf life and product formats | +1.5% | Global, with early adoption in Asia-Pacific and North America | Medium term (2-4 years) |
| Functional beverages grow due to coconut water's electrolytes, potassium, and hydration benefits | +1.9% | Global, particularly North America, Europe, and Middle East | Short term (≤ 2 years) |
| Sustainable sourcing attracts eco-conscious consumers through traceability and circular economy practices | +1.2% | Europe, North America, and premium segments in Asia-Pacific | Long term (≥ 4 years) |
| Coconut derivatives gain popularity in pharmaceuticals and nutraceuticals for medicinal uses | +1.3% | Global, with concentration in North America, Europe, and Japan | Long term (≥ 4 years) |
| Source: Mordor Intelligence | |||
Focus on Plant-Based Fats Like MCTs in Coconut Oil for Energy and Metabolism Support
Sports-nutrition brands and ketogenic diet followers are leveraging the benefits of medium-chain triglycerides (MCTs) in coconut oil. MCTs bypass regular digestion, quickly entering the liver and converting to ketone bodies within 30 minutes. A 2025 clinical trial showed that consuming 15 grams of MCT oil daily raised serum beta-hydroxybutyrate by 0.4-0.6 millimolar in non-fasted adults, improving endurance by 8-12% during 90-minute cycling. Lauric acid, which makes up 45-50% of coconut oil's fatty acids, also fights microbes like Staphylococcus aureus and Candida albicans, making it popular in immunity-boosting supplements. Food manufacturers are adding MCT-enriched coconut oil to protein bars, meal-replacement shakes, and infant formula, with North America and Europe driving 60% of demand. In 2024, the FDA's "Generally Recognized as Safe" approval for MCT oils removed regulatory hurdles, boosting their use in bakery, confectionery, and beverages[1]Source: U.S. Food and Drug Administration, “GRAS Notice for MCT Oils”, fda.gov.
Vegan Diets Drive Demand for Coconut Milk, Water, and Flour as Dairy Alternatives
By late 2025, plant-based milk alternatives made up 15% of U.S. fluid-milk sales, with coconut milk ranking third after almond and oat, according to retail scanner data. Coconut flour, with 38-40 grams of fiber per 100 grams and a gluten-free profile, is widely used in vegan baking, replacing wheat and soy flours in bakeries and industrial bread production. Coconut water, known for its electrolyte balance similar to human plasma, was a key feature in Coca-Cola's Zico and PepsiCo's O.N.E. relaunches in 2024-2025, targeting post-workout hydration. E-commerce drove growth, with coconut-based dairy alternatives growing 22% year-over-year in 2025, 9 percentage points faster than physical stores. Flexitarian consumers, who reduce but don’t eliminate animal products, account for 40% of coconut milk purchases, expanding the market beyond vegans and lactose-intolerant buyers.
Advancements in Processing Technologies Improve Shelf Life and Product Formats
High-pressure processing at 400-600 megapascals kills spoilage microorganisms while preserving vitamins and polyphenols that thermal pasteurization destroys. Premium coconut-water brands use this to charge 25-30% more than conventional options. Membrane filtration methods, like ultrafiltration and nanofiltration, remove microbes and solids without changing flavor, extending fresh coconut milk's shelf life from 7-10 days to 45-60 days. Pulsed electric field technology uses high-voltage bursts to destroy microbial cells, reducing Escherichia coli and Listeria monocytogenes by 5 logs while keeping coconut water's sweetness and minerals intact. Tetra Pak's aseptic carton lines, planned for Thailand and Indonesia in 2024-2025, will produce ambient-stable coconut milk with a 12-month shelf life, cutting cold-chain costs and expanding distribution. Spray-drying innovations reduce coconut-milk powder moisture to under 3%, preventing lipid oxidation and extending shelf life to 24 months, a format increasingly favored by instant beverage and ready-to-eat meal producers.
Functional Beverages Grow Due to Coconut Water's Electrolytes, Potassium, and Hydration Benefits
Coconut water contains 250-300 milligrams of potassium per 100 milliliters, about five times more than leading sports drinks, making it a natural rehydration option for athletes and heat-exposed workers. The Vita Coco Company reported an 18% growth in its coconut-water portfolio in fiscal 2025, driven by wider availability in convenience stores and gyms across North America and Europe. With 25 milligrams of magnesium and 20 milligrams of calcium per 100 milliliters, coconut water supports muscle recovery and bone health, benefits often highlighted on labels to stand out from sugary drinks. New products, like coconut-water-based protein shakes, combine whey or pea protein with coconut water to provide 15-20 grams of protein and electrolytes, appealing to CrossFit and marathon enthusiasts. Retail data from 2025 showed coconut water gaining space in mainstream supermarkets, replacing carbonated soft drinks in refrigerated sections, signaling its growth beyond niche health-food stores.
Restraints Impact Analysis*
| Restraint | (~) % Impact on CAGR Forecast | Geographic Relevance | Impact Timeline |
|---|---|---|---|
| Volatile raw-nut prices & climate-induced supply shocks | -2.3% | Global, with acute impact in Philippines, Indonesia, Sri Lanka | Short term (≤ 2 years) |
| Aging plantations & low farmer productivity | -1.6% | Asia-Pacific primary production regions, spreading to other coconut-growing areas | Long term (≥ 4 years) |
| High logistics cost for bulky water-based products | -1.1% | Global shipping routes, particularly Asia-Pacific to North America & EU | Medium term (2-4 years) |
| Scrutiny over child labour in Philippine value chain | -0.8% | Philippines primary, with spillover to global supply chain compliance | Medium term (2-4 years) |
| Source: Mordor Intelligence | |||
Volatile Raw-Nut Prices and Climate-Induced Supply Shocks
Copra prices rose from USD 800 per tonne in early 2024 to USD 1,120 per tonne by mid-2025, a 40% increase caused by El Niño-induced droughts that cut coconut yields by 15-20% in the Philippines and Indonesia. Between 2024 and 2025, six major typhoons in the Western Pacific damaged 250,000 hectares of coconut plantations in Luzon and Visayas, delaying harvests and tightening supply. Spot-market volatility has discouraged long-term procurement contracts, forcing food manufacturers to either absorb costs or pass them to consumers, reducing competitiveness against palm and soybean oils. Coconut product futures markets remain underdeveloped, limiting hedging options for processors and exporters. Climate models predict a 10-15% decline in suitable coconut-growing areas by 2040 due to changing rainfall and rising temperatures, threatening production in regions like southern India and coastal Vietnam[2]Source: International Coconut Community, "Thailand Seeks Solutions for Low-Yielding Aromatic Coconut Plantations with International Expert Consultation in Collaboration with ICC", coconutcommunity.org.
Aging Plantations and Low Farmer Productivity
In the Philippines, around 60% of coconut palms are over 60 years old, yielding only 30-40 nuts annually. In contrast, prime-age palms produce 80-120 nuts. This productivity gap tightens supply elasticity, even as demand surges[3]Source: Philippine Coconut Authority, “Plantation Age Analysis”, pca.gov.ph. New palms, planted under replanting programs, take 7-10 years to mature commercially. This extended investment timeline poses challenges for smallholders, who own 90% of the coconut land and often rely on subsidized credit. In Indonesia, coconut plantations average 45 years in age. While 1.2 million hectares are occupied by aging palms, replanting rates are a mere 3-4% annually. This slow rate is largely due to land-use competition from oil palm and rubber. Hybrid varieties, like Malayan Yellow Dwarf and West Coast Tall, promise 30-40% higher yields and better disease resistance. However, fragmented seed distribution networks hinder their adoption, especially in remote farming communities.
*Our forecasts treat driver/restraint impacts as directional, not additive. The impact forecasts reflect baseline growth, mix effects, and variable interactions.
Segment Analysis
By Product Type: Oil Dominance Meets Sugar Innovation
In 2025, coconut oil accounted for 37.86% of the market share, driven by its high lauric acid content (45-50%), essential for making surfactants, emulsifiers, and antimicrobial agents used in detergents, cosmetics, and pharmaceuticals. Refined, bleached, and deodorized coconut oil is widely used in bakery shortenings and confectionery coatings due to its 24°C melting point, which enhances texture. Virgin coconut oil, extracted through cold-pressing or fermentation, retains nutrients like polyphenols and medium-chain triglycerides, appealing to health-conscious consumers and commanding a 20-25% price premium over RBD grades. In 2025, Malaysia and Indonesia processed 320,000 tonnes of coconut oil into biodiesel methyl esters, benefiting from its high cetane number and low-temperature flow properties. However, growth is limited to 6-7% annually due to competition from palm kernel oil and synthetic lauric acid in cost-sensitive industries.
Coconut sugar is the fastest-growing segment, with a 10.56% CAGR projected through 2031. Its low glycemic index (35-54) compared to cane sugar (60-70) makes it a preferred choice for diabetic and pre-diabetic consumers. Retailers promote it as a natural, unrefined sweetener, aligning with clean-label trends that avoid artificial additives. Indonesia and the Philippines lead production, using sustainable methods to extract and dehydrate coconut-palm sap into granulated or block forms, preserving minerals like iron, zinc, and potassium. In 2024-2025, premium bakeries and coffee chains adopted coconut sugar to differentiate their offerings, while e-commerce platforms enabled direct sales, bypassing traditional grocery channels. USDA Organic and Fair Trade certifications have boosted exports to North America and Europe, where consumers pay USD 8-12 per kilogram, compared to USD 1-2 for cane sugar.


By Packaging: Aseptic Cartons Outpace Bottles
In 2025, bottles held 27.63% of the packaging market, favored for coconut water and ready-to-drink coconut milk due to their transparency and recyclability. Polyethylene terephthalate bottles dominate single-serve formats with their lightweight and resealable features, while glass bottles cater to premium segments, highlighting artisanal production and zero plastic. Harmless Harvest's refillable bottle systems, tested in select U.S. markets in 2025, cut packaging waste by 60% and reduce costs after 5-6 refills, though reverse logistics limit expansion to urban areas. In the Asia-Pacific region, recycling infrastructure lags behind Europe and North America, with collection rates below 40% in Indonesia and the Philippines, posing sustainability challenges.
Pouches and Tetrapack formats are growing at an 11.28% CAGR through 2031, driven by aseptic processing that extends shelf life to 12 months without refrigeration. Tetra Pak's cartons, made of polyethylene, aluminum foil, and paperboard, preserve coconut milk's flavor and nutrients without preservatives, meeting the needs of food-service operators and institutional buyers. Between 2024 and 2025, resealable stand-up pouches gained popularity for desiccated coconut and coconut flour, offering portion control and moisture protection. Flexible packaging reduces transportation weight by 40-50%, cutting freight costs and emissions on exports from Southeast Asia to Europe and North America. Bio-based laminate films, using polylactic acid from corn or sugarcane, address disposal concerns while maintaining performance.
By End User: Retail Channels Gain Share
In 2025, industrial end-users, including food processors, cosmetics manufacturers, and pharmaceutical formulators, held 52.34% of the market share. These buyers purchased coconut derivatives in bulk formats like 200-liter drums and 20-tonne flexitanks. Food processors used coconut oil for frying, coconut milk powder for soups and sauces, and desiccated coconut for bakery items and snacks, focusing on moisture, microbial limits, and fatty-acid content. Cosmetics brands like L'Oréal and Unilever sourced 80,000-100,000 tonnes annually for products such as conditioners, lotions, and lip balms, leveraging coconut oil's natural appeal. Oleochemical plants converted coconut oil into fatty alcohols and glycerin for detergents and personal care, accounting for 25-30% of industrial demand. Contract manufacturing for private-label brands further boosted industrial purchasing power with volume discounts unavailable to retail buyers.
Retail channels are expected to grow at a 12.32% CAGR through 2031, driven by e-commerce, health stores, and supermarkets. In 2025, platforms like Amazon and Thrive Market saw a 28% rise in coconut-product sales, aided by subscription models that ensured recurring revenue. Supermarkets moved coconut water to refrigerated sections near soft drinks, boosting impulse buys and trials. Specialty stores offered organic and fair-trade coconut products with 30-40% premiums, appealing to urban consumers focused on ethical sourcing. In 2024-2025, convenience stores in Asia-Pacific and Latin America stocked single-serve coconut water and milk, targeting commuters and students seeking healthier drink options. This retail growth reflects rising awareness of coconut's health benefits and the convenience of branded products over bulk purchases.
Geography Analysis
In 2025, Asia-Pacific held 47.63% of the market share, driven by the Philippines producing 16-17 billion coconuts, Indonesia leading as the top copra exporter, and Thailand's government procuring 2.29 million aromatic coconuts for processing. The Philippines exported USD 849 million worth of coconut products in Q1 2026, with coconut oil exports forecasted at 1.19 million tonnes in 2026/27 due to strong demand from North America and Europe. Indonesia's coconut-processing sector benefits from supply chains linking small farmers to refineries, though aging plantations limit yield growth. Thailand's 2025 Geographic Indication approval for aromatic coconuts enabled premium pricing, while subsidies aim to rejuvenate 50,000 hectares by 2028. India’s 2.2 million hectares of coconut cultivation, mainly in Kerala, Tamil Nadu, and Karnataka, focus on domestic consumption, which absorbs 90% of output, restricting exports. Vietnam and Sri Lanka target niche markets with organic and fair-trade products, using certifications to access European specialty retailers.
The Middle East and Africa are projected to grow at a 10.15% CAGR through 2031, driven by urbanization, rising incomes, and health-conscious consumers favoring coconut water and cosmetics. In 2025, packaged coconut water made up over 45% of imports in the UAE, Qatar, and Saudi Arabia, offering a cheaper hydration option than fresh juice. Coconut oil-based cosmetics grew 12% annually, supported by halal certifications. Processed coconut products like desiccated coconut and coconut milk grew 15% annually, with demand from expatriates and locals incorporating coconut into traditional and fusion cuisines. Supermarkets in South Africa and Nigeria, such as Shoprite and Spar, expanded coconut product offerings, while Egypt and Morocco are seeing growing use in bakery and confectionery. Investments in cold-chain logistics and ports during 2024-2025 reduced spoilage and improved product quality, enhancing competitiveness.
North America and Europe accounted for 30-35% of global demand in 2025, with coconut products widely available in retail and food-service channels. The U.S. led coconut water imports, with coastal urban centers consuming over 2 liters per capita annually. Canada’s plant-based food sector uses coconut milk and flour in dairy-free and gluten-free products. Europe focuses on organic and fair-trade certifications, with Germany, the U.K., and France leading imports of sustainable coconut oil for cosmetics and food. The EU’s 2025 Deforestation Regulation requires traceability for coconut imports, pushing suppliers to adopt blockchain systems. Latin America showed moderate growth, with Brazil and Mexico using coconut in traditional and health-food dishes, though Brazil’s domestic production reduces import needs.

Competitive Landscape
The coconut derivatives market is moderately fragmented. Key players include The Vita Coco Company, Inc., Marico Limited, Thai Coconut Public Co., Ltd., The Sambu Group, and PepsiCo, Inc. Vita Coco leads the U.S. coconut water sales, thanks to a diversified sourcing network that spans six countries and operates 14 factories, mitigating climatic risks. The company bolsters its resilience with a five-year offtake contract with Century Pacific, securing 90 million litres of water. This is further supported by a USD 40 million investment in plant upgrades, ensuring compliance with aseptic filling standards.
Thai World Group employs a vertical integration strategy, owning plantations and processing facilities for UHT and frozen products. This approach not only captures margins throughout the supply chain but also guarantees consistent quality for buyers in Europe and America. Marico, leveraging its brand strength, passes on raw nut cost increases to consumers without losing market share. The company also uses digital tools to monitor copra procurement, enhancing farmer traceability and ESG reporting.
Disruptors are intensifying the competition: IFBH’s IPO in Hong Kong has fueled its marketing and cold-chain expansion efforts in mainland China. This push has grown its coconut water portfolio from a single SKU to commanding a 34% share of the domestic category in just three years. Meanwhile, startups are carving out niches with offerings like collagen-boosted coconut creamers and adaptogenic elixirs infused with ashwagandha. In a bid to outpace incumbents, packaging innovation firms are partnering with ingredient suppliers to co-market fully renewable pouch-plus-product solutions, a leap from the traditional mixed-material laminates still favored by many established players.
Coconut Derivatives Industry Leaders
-
The Vita Coco Company, Inc.
-
Marico Limited
-
Thai Coconut Public Co., Ltd.
-
The Sambu Group
-
PepsiCo, Inc.
- *Disclaimer: Major Players sorted in no particular order

Recent Industry Developments
- April 2026: Julpan Coconut Indonesia launched a new range of organic cold-pressed virgin coconut oils in retail-ready glass bottles, targeting wellness-focused consumers in Europe and North America.
- March 2026: Marico Limited announced a USD 45 million investment to expand its coconut-oil refining capacity in Tamil Nadu, India, by 30%, targeting export markets in the Middle East and North Africa.
- January 2026: Danone S.A. partnered with the Sustainable Coconut Partnership to source 100% of its coconut ingredients from blockchain-verified farms by 2027, ensuring fair wages and zero-deforestation practices. The initiative covers 120,000 hectares in the Philippines and Indonesia, affecting approximately 80,000 smallholder farmers.
- September 2025: Kerala introduced a certified “Kerala Brand” coconut oil initiative to strengthen premium positioning and export competitiveness


Global Coconut Derivatives Market Report Scope
| Coconut Oil |
| Coconut Milk |
| Coconut Water |
| Desiccated Coconut |
| Coconut Sugar |
| Coconut Flour and Fibre Derivatives |
| Others |
| Bottles |
| Tubs/Jars |
| Cans |
| Pouches (Tetrapack) |
| Others |
| Industrial | |
| HoReCa | |
| Retail | Supermarkets/Hypermarkets |
| Convenience/Grocery Stores | |
| Specialty/Gourmet Stores | |
| Online Retail Stores | |
| Others |
| North America | United States |
| Canada | |
| Mexico | |
| Rest of North America | |
| Europe | Germany |
| United Kingdom | |
| Italy | |
| France | |
| Spain | |
| Netherlands | |
| Poland | |
| Belgium | |
| Sweden | |
| Rest of Europe | |
| Asia-Pacific | China |
| India | |
| Japan | |
| Australia | |
| Indonesia | |
| South Korea | |
| Thailand | |
| Singapore | |
| Rest of Asia-Pacific | |
| South America | Brazil |
| Argentina | |
| Colombia | |
| Chile | |
| Peru | |
| Rest of South America | |
| Middle East and Africa | South Africa |
| Saudi Arabia | |
| United Arab Emirates | |
| Nigeria | |
| Egypt | |
| Morocco | |
| Turkey | |
| Rest of Middle East and Africa |
| By Product Type | Coconut Oil | |
| Coconut Milk | ||
| Coconut Water | ||
| Desiccated Coconut | ||
| Coconut Sugar | ||
| Coconut Flour and Fibre Derivatives | ||
| Others | ||
| By Packaging | Bottles | |
| Tubs/Jars | ||
| Cans | ||
| Pouches (Tetrapack) | ||
| Others | ||
| By End User | Industrial | |
| HoReCa | ||
| Retail | Supermarkets/Hypermarkets | |
| Convenience/Grocery Stores | ||
| Specialty/Gourmet Stores | ||
| Online Retail Stores | ||
| Others | ||
| By Geography | North America | United States |
| Canada | ||
| Mexico | ||
| Rest of North America | ||
| Europe | Germany | |
| United Kingdom | ||
| Italy | ||
| France | ||
| Spain | ||
| Netherlands | ||
| Poland | ||
| Belgium | ||
| Sweden | ||
| Rest of Europe | ||
| Asia-Pacific | China | |
| India | ||
| Japan | ||
| Australia | ||
| Indonesia | ||
| South Korea | ||
| Thailand | ||
| Singapore | ||
| Rest of Asia-Pacific | ||
| South America | Brazil | |
| Argentina | ||
| Colombia | ||
| Chile | ||
| Peru | ||
| Rest of South America | ||
| Middle East and Africa | South Africa | |
| Saudi Arabia | ||
| United Arab Emirates | ||
| Nigeria | ||
| Egypt | ||
| Morocco | ||
| Turkey | ||
| Rest of Middle East and Africa | ||


Key Questions Answered in the Report
What is the projected value of the coconut derivatives market by 2031?
The coconut derivatives market size is forecast to reach USD 50.90 billion by 2031, expanding at a 9.88% CAGR from 2026 to 2031.
Which product type currently leads revenue?
Coconut oil dominated with 37.86% revenue share in 2025, anchored by lauric acid demand.
Which geography is growing the fastest?
The Middle East and Africa is poised for the highest CAGR, about 10.56% through 2031, driven by packaged beverage imports and halal cosmetics.
Which packaging format is advancing most rapidly?
Pouches and Tetrapack formats are growing at an 11.28% CAGR due to lightweight, ambient-stable properties that cut freight expenses.
Page last updated on:


