Dairy Desserts Market Size and Share
Market Overview
| Study Period | 2021 - 2031 |
|---|---|
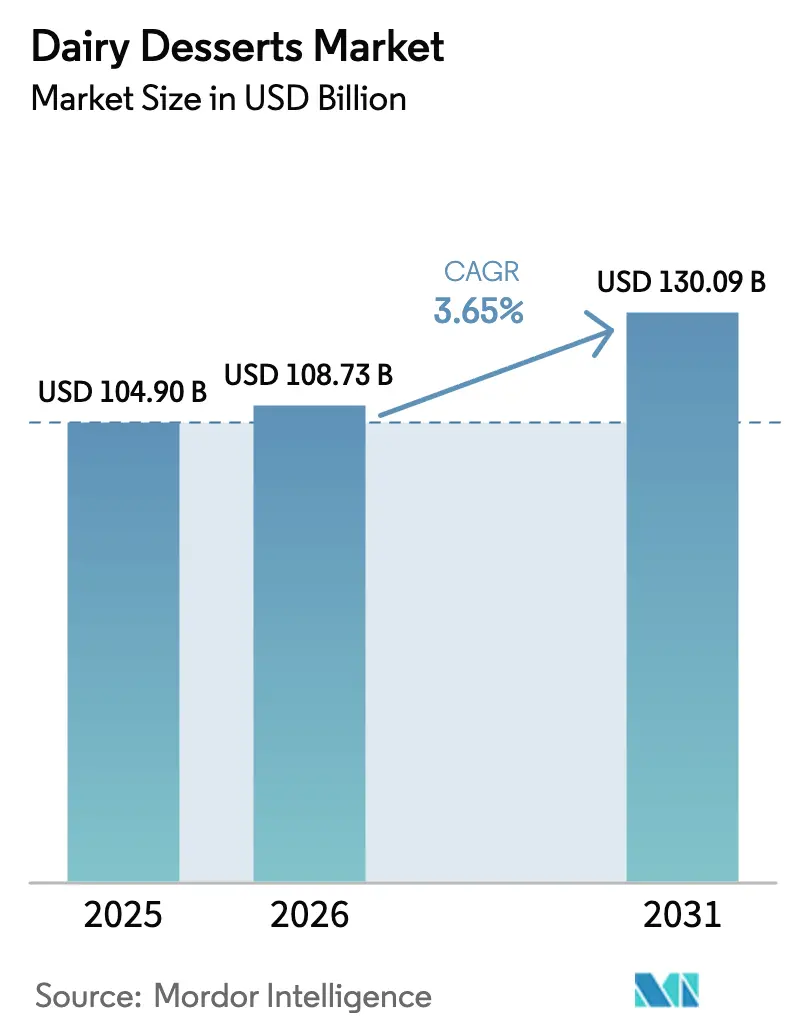
| Market Size (2026) | USD 108.73 Billion |
| Market Size (2031) | USD 130.09 Billion |
| Growth Rate (2026 - 2031) | 3.65% CAGR |
| Fastest Growing Market | Asia Pacific |
| Largest Market | Asia Pacific |
| Market Concentration | Medium |
Major Players
*Disclaimer: Major Players sorted in no particular order Image © Mordor Intelligence. Reuse requires attribution under CC BY 4.0. |
|
Dairy Desserts Market Analysis by Mordor Intelligence
The dairy desserts market size is expected to grow from USD 104.90 billion in 2025 to USD 108.73 billion in 2026 and is forecast to reach USD 130.09 billion by 2031 at 3.65% CAGR over 2026-2031. Market expansion is primarily attributed to manufacturers introducing premium product lines, developing innovative flavor combinations, and implementing advanced preservation technologies to extend product shelf life, even as the industry faces growing competition from plant-based alternatives. The Asia-Pacific region maintains its position as the dominant market, supported by increasing disposable incomes in urban areas and the rapid expansion of modern retail infrastructure. Meanwhile, North American and European consumers increasingly gravitate toward products with clean-label declarations and health-conscious positioning. While established multinational corporations leverage their operational scale to optimize costs, regional manufacturers are successfully carving out market share by offering locally-inspired flavors and traditional artisanal products. The industry's resilience is further reinforced through strategic investments in advanced manufacturing processes, environmentally conscious packaging solutions, and the development of direct-to-consumer sales channels.
Key Report Takeaways
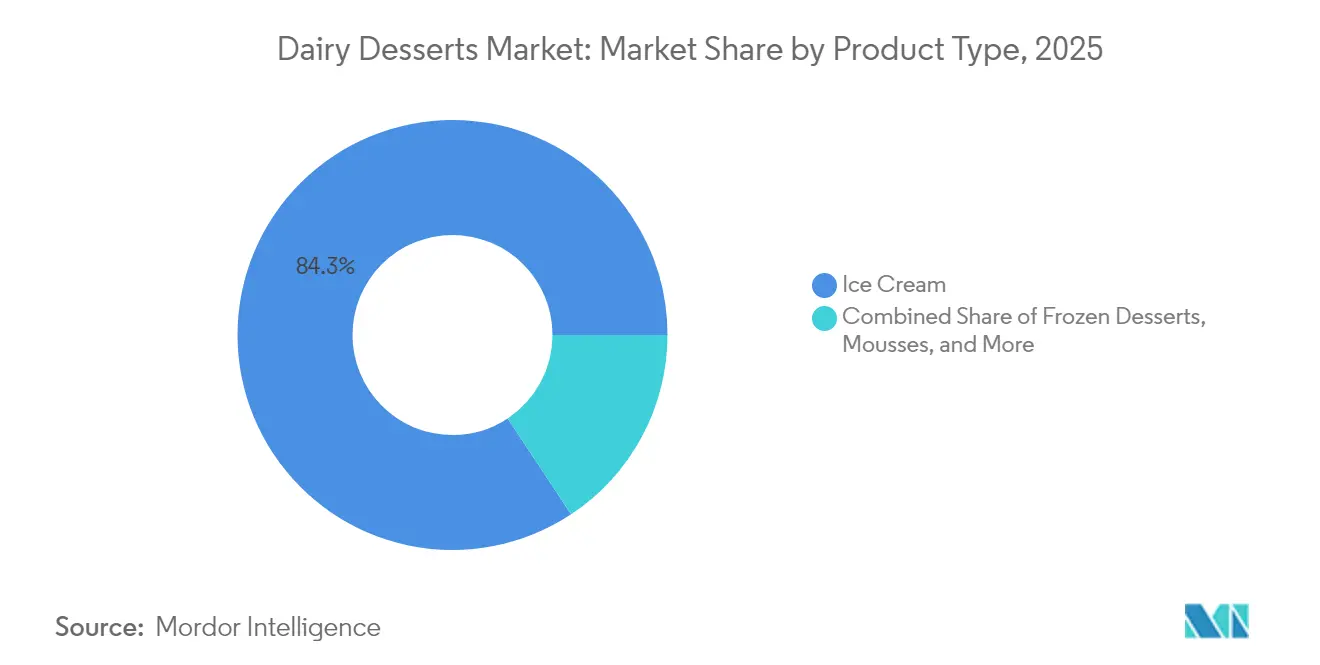
- By product type, ice cream commanded 84.30% of the dairy desserts market share in 2025, whereas cheesecakes posted the fastest 4.87% CAGR to 2031.
- By packaging, cups and tubs accounted for 42.60% of the dairy desserts market size in 2025 and are expanding at 5.12% CAGR through 2031.
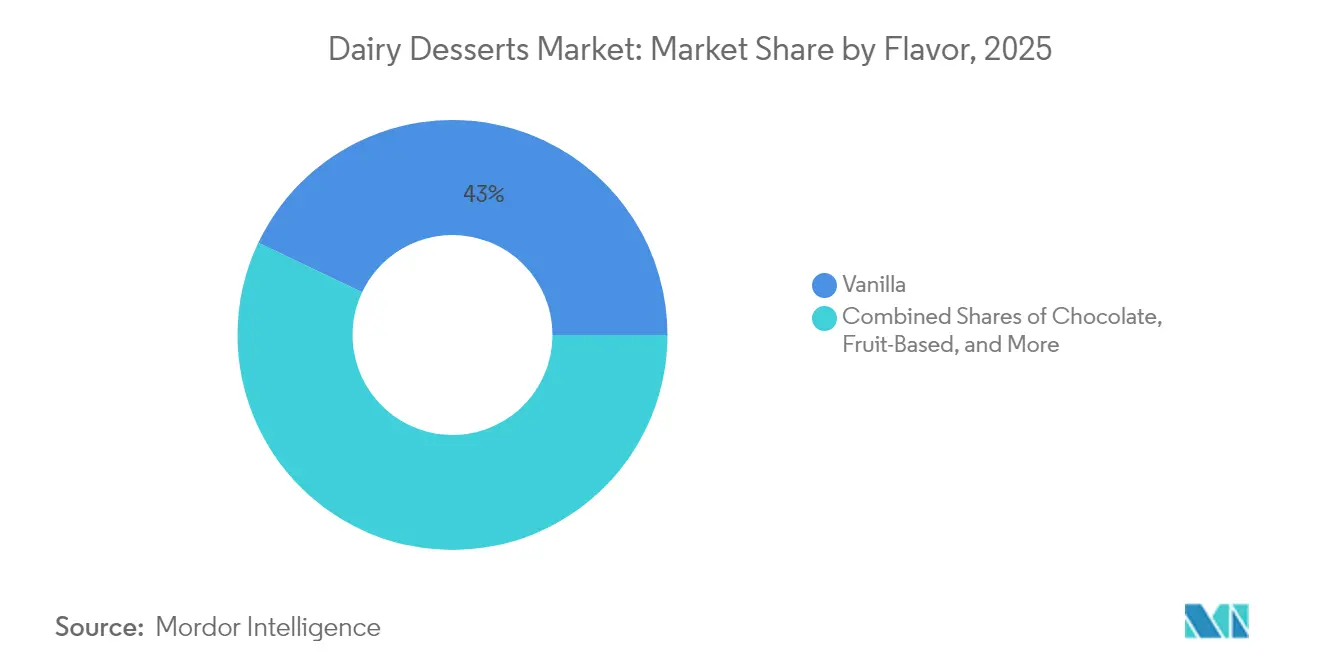
- By flavor, vanilla led with 42.95% revenue share in 2025, while nuts and caramel variants are advancing at 4.71% CAGR to 2031.
- By distribution channel, off-trade held 79.90% share of the dairy desserts market size in 2025; on-trade is growing at 4.88% CAGR to 2031.
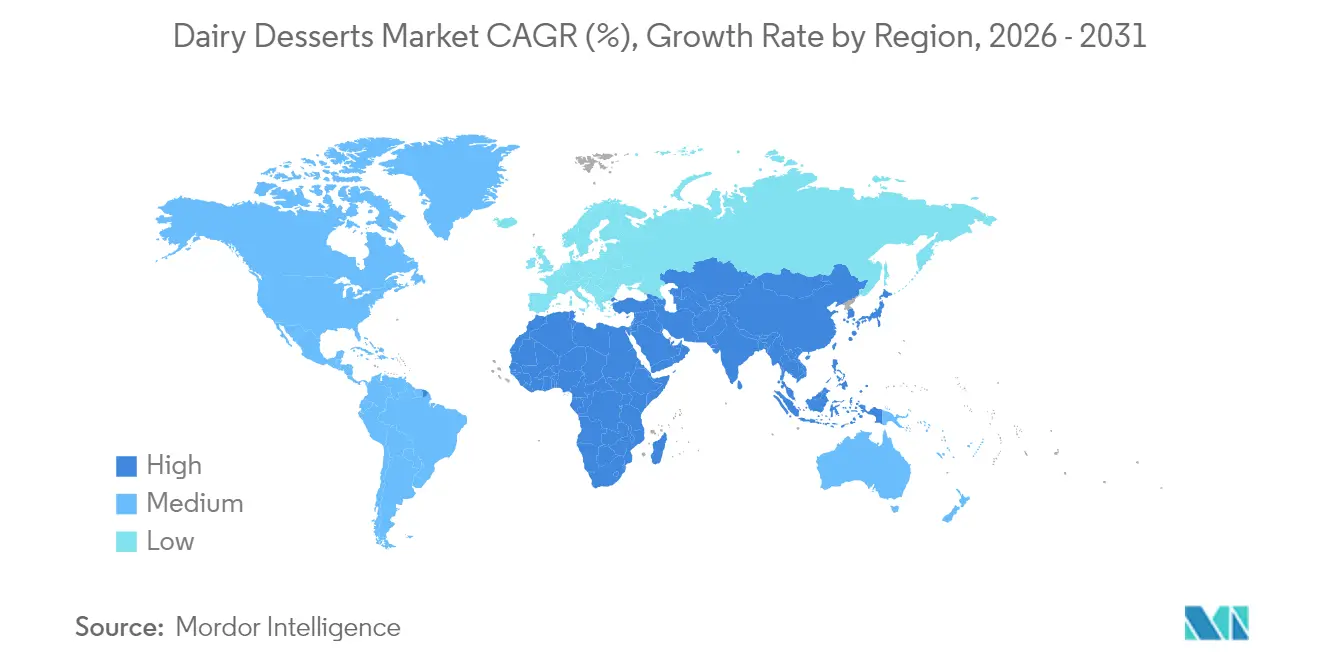
- By geography, Asia-Pacific captured 34.20% of the dairy desserts market share in 2025 and is progressing at a 4.48% CAGR through 2031.
Note: Market size and forecast figures in this report are generated using Mordor Intelligence’s proprietary estimation framework, updated with the latest available data and insights as of 2026.
Global Dairy Desserts Market Trends and Insights
Drivers Impact Analysis*
| Driver | (~) % Impact on CAGR Forecast | Geographic Relevance | Impact Timeline |
|---|---|---|---|
| Growing demand for premium and artisanal dessert options | +0.8% | Global, with strongest impact in North America & Europe | Medium term (2-4 years) |
| Influence of global cuisines and cross-cultural flavor trends | +0.6% | Asia-Pacific core, spill-over to North America & Europe | Long term (≥ 4 years) |
| Increased shelf-life in ambient/chilled formats with new technology | +0.5% | Global, with early gains in emerging markets | Short term (≤ 2 years) |
| Rising preference for convenient, ready-to-eat and single-serve desserts | +0.7% | Global, led by urban centers | Medium term (2-4 years) |
| Expansion of health-conscious dessert offerings | +0.4% | North America & Europe, expanding to Asia-Pacific | Long term (≥ 4 years) |
| Clean-label and natural ingredients trends | +0.3% | North America & Europe primarily | Medium term (2-4 years) |
| Source: Mordor Intelligence | |||


Growing Demand for Premium and Artisanal Dessert Options
Premium products continue to drive substantial growth in the dairy dessert market as consumers demonstrate an increasing preference for high-quality offerings over standard alternatives. Barry-Callebaut's comprehensive market research reveals strong consumer interest in exploring innovative and unique ice cream varieties, with consumers actively pursuing seasonal flavors and limited-edition products throughout the year. This notable shift toward premium offerings extends across the entire dairy dessert category, encompassing artisanal cheesecakes crafted with premium ingredients, gourmet mousses developed by expert confectioners, and specialty frozen desserts created through innovative production methods. These premium products consistently achieve higher price points in the market compared to conventional options. The transformation in consumer behavior reflects broader societal changes, particularly evident among millennial and Gen Z demographics, who increasingly view their dessert purchases as opportunities for accessible luxury experiences and a meaningful way to express their personal preferences and lifestyle choices in their daily consumption patterns.
Influence of Global Cuisines and Cross-Cultural Flavor Trends
The Asian market demonstrates remarkable innovation in dessert-based cheese products by skillfully incorporating regional flavors that resonate with local consumers. Vietnam's introduction of the Milkana Milky Ice Cream Flavored Creamy Lollipop represents a creative fusion of dairy and confectionery, while Japan's launch of the Meiji x St Môret Caramel Flavour Cream Cheese Dessert showcases successful international collaboration by incorporating premium French cream cheese. In China, Anchor has responded to consumer preferences by developing specialized sliced cheese varieties that feature distinctive regional flavors, including crayfish and traditional spice blends. Thailand's Dairygold Ka Pao cheddar exemplifies successful market adaptation by incorporating beloved Thai flavors such as Ka Prao, Tom Yum, and green curry into conventional dairy products. This strategic integration of local flavors with dairy products enables manufacturers to build stronger connections with consumers while maintaining their position in the competitive dairy dessert segment. The ongoing globalization of food trade has created unprecedented opportunities for consumers to explore diverse international cuisines, facilitating a rich exchange of flavors and ingredients across markets [1]Source: Cato Institute"Food Globalization Puts the World on Your Plate," cato.org.
Increased Shelf-Life in Ambient/Chilled Formats with New Technology
Ultra-high temperature (UHT) processing and advanced packaging technologies are fundamentally changing how dairy desserts reach consumers worldwide, offering practical solutions for ambient storage and extended product life. Fonterra's strategic NZD150 million investment in a new UHT cream plant at Edendale, with completion targeted for August 2026, reflects the company's response to growing Asian foodservice market opportunities. The facility's initial processing capacity of 50 million litres, with plans to scale beyond 100 million litres by 2030, positions the company to meet increasing regional demand effectively. This technological evolution brings substantial operational benefits by minimizing cold-chain dependencies and reducing distribution expenses. Most importantly, it creates opportunities to serve emerging markets where traditional dairy dessert distribution has been constrained by limited refrigeration infrastructure, enabling broader consumer access to dairy products.
Rising Preference for Convenient, Ready-to-Eat and Single-Serve Desserts
Single-serve formats have experienced substantial growth in the market as modern consumers increasingly value portion control and convenience in their purchasing decisions. In Australia, comprehensive yogurt packaging analysis demonstrates a notable shift, with single-serve containers (≤1 serve) showing a significant increase from 36% in 2013 to 53% in 2023, while multi-serve formats experienced a proportional decline. This consumer preference has influenced product development across the dairy dessert category, with manufacturers introducing individually portioned cheesecakes, mousse cups, and frozen dessert bars to accommodate busy lifestyles and health-conscious portion management. However, this market evolution presents environmental challenges, as smaller formats inherently increase packaging-to-food ratios and typically result in reduced container emptiability, compelling manufacturers to carefully evaluate the balance between meeting consumer convenience demands and addressing environmental impact concerns.
Restraints Impact Analysis*
| Restraint | (~) % Impact on CAGR Forecast | Geographic Relevance | Impact Timeline |
|---|---|---|---|
| Rising competition from plant-based dessert alternatives | -0.9% | Global, strongest in North America & Europe | Short term (≤ 2 years) |
| Growing consumer avoidance of lactose and dairy allergens | -0.6% | Global, with higher impact in Asia-Pacific | Medium term (2-4 years) |
| Price volatility in raw dairy materials | -0.4% | Global, with regional variations | Short term (≤ 2 years) |
| Inconsistent quality across international markets/production facilities | -0.3% | Emerging markets primarily | Long term (≥ 4 years) |
| Source: Mordor Intelligence | |||
Rising Competition from Plant-Based Dessert Alternatives
Plant-based dairy alternatives have gained market share by offering health benefits and environmental sustainability advantages to consumers. Life cycle assessments show that soy milk production generates lower emissions at 0.51-0.52 kg CO2-eq/L, compared to conventional cow milk at 0.99-1.08 kg CO2-eq/L. The plant-based dairy market recorded high single-digit CAGR growth during 2020-2023, driven by increased consumer health awareness and demand for environmentally sustainable alternatives made from almond, soy, oat, and coconut. Despite this growth and environmental benefits, traditional dairy products maintain their market position through higher nutritional content and established taste profiles, especially in premium desserts where plant-based alternatives face challenges in replicating specific functional properties. According to the Good Food Institute, the plant-based desserts market is expected to grow at more than 10% in the forecast period [2]Source: Good Food Institute, “U.S. retail market insights for the plant-based industry,” gfi.org.
Growing Consumer Avoidance of Lactose and Dairy Allergens
Lactose intolerance significantly impacts consumer behavior across global markets, with notably higher prevalence rates among populations of South American, Asian, and African descent. This demographic distribution creates distinct regional patterns in market demand for lactose-free alternatives. Clinical research and meta-analysis studies indicate that incorporating probiotics effectively reduces lactose intolerance symptoms in adult consumers, opening market opportunities for manufacturers to develop probiotic-enhanced dairy desserts. These products address digestive sensitivity concerns while preserving the traditional dairy product positioning in the market [3]Source: Dairy Council of California analysts, “Trends 2024,” Dairy Council of California, dairycouncilofca.org. The growing consumer demand for lactose-free options has prompted manufacturers to focus their research and development efforts on lactose-free formulations and enzyme-treated product variants. However, these specialized products typically command higher retail prices to compensate for the increased manufacturing costs and the complexities of maintaining dedicated supply chain operations.
*Our forecasts treat driver/restraint impacts as directional, not additive. The impact forecasts reflect baseline growth, mix effects, and variable interactions.
Segment Analysis
By Product Type: Ice Cream Dominance Faces Premium Disruption
Ice cream dominates the market with an 84.30% share in 2025, backed by widespread consumer acceptance and well-established distribution channels across global markets. The frozen dessert segment beyond ice cream continues to expand through innovative product offerings and health-conscious formulations, while mousses attract consumers looking to recreate restaurant-quality experiences in their homes.
Cheesecakes demonstrate the strongest growth potential with a 4.87% CAGR through 2031, as consumers embrace premium offerings and foodservice establishments increase their menu presence. The "others" category encompasses emerging products like dairy-based protein desserts and hybrid varieties. Barry-Callebaut's research reveals that consumers consistently prefer ice cream products with multiple textures, driving manufacturers to develop products with mix-ins, chunks, and layers that command higher prices in the market.


By Packaging Type: Cups and Tubs Lead Convenience Revolution
The packaging market for cups and tubs maintains a commanding 42.60% share in 2025, growing at a robust 5.12% CAGR. This growth reflects consumers' increasing demand for packaging that offers resealability and portion control, meeting both individual and family consumption needs. In the impulse purchase segment, sticks and bars continue to perform well, despite facing challenges from rising raw material costs. The market has also witnessed the rise of alternative packaging formats, which are gaining attention through their environmental benefits and improved functionality in preserving product quality.
An analysis of Australian packaging trends reveals a significant shift from tubs to pouches between 2013-2023, though this transition raises concerns about product waste, particularly with sticky dairy items. The industry is rapidly adapting to incorporate sustainable packaging materials, with manufacturers implementing biobased polymers, recyclable multi-materials, and active packaging features. These adaptations serve dual purposes: differentiating products in the market while meeting environmental standards. The European Union's Packaging and Packaging Waste Regulation (PPWR) draft, with its requirement for 70% recyclability thresholds, continues to push the industry toward mono-material solutions and better end-of-life management practices.
By Flavor: Vanilla Mainstream Meets Premium Innovation
Vanilla dominates the market with a 42.95% share in 2025, demonstrating its universal appeal across different consumer groups and cultures. The versatile flavor serves both as a standalone option and as a foundation for premium products. Nuts and caramel variations continue their upward trajectory with a 4.71% CAGR, as consumers increasingly seek more sophisticated taste experiences and textural elements.
In established markets, chocolate flavors maintain their strong position, while fruit-based options attract health-conscious consumers looking for natural alternatives and added nutritional benefits. The "others" category encompasses innovative flavor combinations that cater to regional preferences and seasonal demands. Asian markets continue to influence global trends by integrating traditional ingredients like matcha, black sesame, and tropical fruits into modern dessert applications.
By Distribution Channel: Off-Trade Dominance Meets On-Trade Growth
Off-trade channels maintain their market leadership with an 79.90% share in 2025, reflecting the significant consumer preference for retail purchases. These distribution channels, encompassing supermarkets, hypermarkets, convenience stores, and online retail platforms, have established themselves as primary purchasing points by offering extensive product selections, convenient shopping experiences, and price-competitive options across various consumer segments.
The on-trade segment exhibits robust growth at a 4.88% CAGR, as restaurants, cafes, and foodservice operators invest in premium dessert programs to enhance their menu offerings and increase customer satisfaction. In the off-trade landscape, convenience stores continue to strengthen their market position by implementing targeted product placement strategies and optimizing impulse-purchase opportunities, while the rise of online retail platforms enables direct-to-consumer brands to overcome traditional distribution limitations and reach customers more effectively.
Geography Analysis
The Asia-Pacific region demonstrates market leadership with a substantial 34.20% share in 2025. This commanding position results from the region's robust economic fundamentals, established manufacturing capabilities, and extensive distribution networks. China, India, and Japan serve as primary growth engines, with China's market particularly notable for its successful integration of Western dessert formats while preserving traditional flavor preferences and maintaining lower sweetness profiles compared to Western markets.
The region's projected growth rate of 4.48% CAGR through 2031 positions it as the fastest-growing market globally. This acceleration is primarily attributed to rapid urbanization patterns, sustained increases in consumer disposable income, and significant investments in cold-chain infrastructure development. India's market exemplifies this growth trajectory, benefiting from the systematic expansion of organized retail channels and evolving consumer preferences, particularly among younger demographics who increasingly favor branded, packaged desserts over traditional alternatives.
North America and Europe represent established markets characterized by stable consumption patterns and ongoing premiumization initiatives. Latin American markets, led by Brazil and Argentina, show emerging opportunities through gradual economic recovery and expanding middle-class segments. The Middle East and Africa region, while facing infrastructure challenges, demonstrates potential in urban centers through demand for premium international brands and locally adapted product offerings. European regulatory standards, particularly in sustainability and labeling requirements, continue to shape global product development and market strategies.

Competitive Landscape
The global dairy desserts market demonstrates moderate concentration, where well-established multinational companies effectively leverage their advantages in procurement, distribution networks, and marketing capabilities. Regional companies have successfully carved out their market positions by focusing on localized product innovation and adapting to specific cultural preferences. Industry giants such as Unilever, Nestlé, and Danone maintain their market dominance through extensive product portfolios and substantial global presence. However, these companies increasingly face strong competition from the rising popularity of plant-based alternatives and premium artisanal brands that challenge traditional market positioning.
Technology adoption has emerged as a crucial differentiator in the competitive landscape. Companies are making substantial investments in advanced processing equipment, implementing sustainable packaging solutions, and developing direct-to-consumer digital platforms to overcome traditional retail limitations. The market presents significant opportunities in dairy-plant hybrid formulations, functional dessert applications, and expansion into emerging markets where improvements in cold-chain infrastructure enable companies to introduce new product lines.
Kerry Group's recent introduction of dairy-oat blends in the UK market across milk, cheese, and butter categories exemplifies successful hybrid product positioning. These innovative products achieve a notable 40% reduction in saturated fats and 54% lower CO2 emissions per kilogram compared to conventional dairy products while maintaining familiar taste profiles. New market entrants are gaining traction by emphasizing clean-label products, implementing subscription-based distribution models, and executing social media marketing strategies that effectively connect with younger consumers who prioritize brand authenticity and supply chain transparency.
Dairy Desserts Industry Leaders
-
Unilever Plc
-
Nestlé SA
-
Danone SA
-
Groupe Lactalis
-
Inner Mongolia Yili Industrial Group Co. Ltd.
- *Disclaimer: Major Players sorted in no particular order

Recent Industry Developments
- April 2025: Chobani announced a USD 1.2 billion investment to build a 1.4 million square foot dairy processing plant in Rome, New York, with capacity exceeding 1 billion pounds of dairy products annually and expected to create over 1,000 full-time jobs while processing approximately 12 million pounds of milk per day. This represents the largest single dairy processing investment in recent years and significantly expands yogurt-based dessert production capacity.
- November 2024: Lactalis committed R$250 million (approximately USD 45 million) in investments across dairy plants in Minas Gerais, Brazil, between 2024-2025, including new dulce de leche cup production lines and expanded fermented milk capacity at multiple facilities. This expansion targets increased Brazilian market share from 11.2% to 15% by 2028.
- March 2024: Walmart unveiled a USD 350 million expansion for a state-of-the-art dairy facility near Waco, Texas, scheduled to open in 2026 and serve approximately 750 Walmart stores and Sam's Clubs across five states while creating nearly 400 new jobs. The facility will process various milk types under Walmart's private label brands, strengthening vertical integration in dairy supply chains.


Global Dairy Desserts Market Report Scope
| Cheesecakes |
| Frozen Desserts |
| Ice Cream |
| Mousses |
| Others |
| Cups and Tubs |
| Sticks and Bars |
| Others |
| Vanilla |
| Chocolate |
| Fruit-Based |
| Nuts and Caramel |
| Others |
| Off-Trade | Convenience Stores |
| Online Retail | |
| Specialist Retailers | |
| Supermarkets and Hypermarkets | |
| Others | |
| On-Trade |
| North America | United States |
| Canada | |
| Mexico | |
| Rest of North America | |
| Europe | Germany |
| United Kingdom | |
| Italy | |
| France | |
| Spain | |
| Netherlands | |
| Poland | |
| Belgium | |
| Sweden | |
| Rest of Europe | |
| Asia-Pacific | China |
| India | |
| Japan | |
| Australia | |
| Indonesia | |
| South Korea | |
| Thailand | |
| Singapore | |
| Rest of Asia-Pacific | |
| South America | Brazil |
| Argentina | |
| Colombia | |
| Chile | |
| Peru | |
| Rest of South America | |
| Middle East and Africa | South Africa |
| Saudi Arabia | |
| United Arab Emirates | |
| Nigeria | |
| Egypt | |
| Morocco | |
| Turkey | |
| Rest of Middle East and Africa |
| By Product Type | Cheesecakes | |
| Frozen Desserts | ||
| Ice Cream | ||
| Mousses | ||
| Others | ||
| By Packaging Type | Cups and Tubs | |
| Sticks and Bars | ||
| Others | ||
| By Flavor | Vanilla | |
| Chocolate | ||
| Fruit-Based | ||
| Nuts and Caramel | ||
| Others | ||
| By Distribution Channel | Off-Trade | Convenience Stores |
| Online Retail | ||
| Specialist Retailers | ||
| Supermarkets and Hypermarkets | ||
| Others | ||
| On-Trade | ||
| By Geography | North America | United States |
| Canada | ||
| Mexico | ||
| Rest of North America | ||
| Europe | Germany | |
| United Kingdom | ||
| Italy | ||
| France | ||
| Spain | ||
| Netherlands | ||
| Poland | ||
| Belgium | ||
| Sweden | ||
| Rest of Europe | ||
| Asia-Pacific | China | |
| India | ||
| Japan | ||
| Australia | ||
| Indonesia | ||
| South Korea | ||
| Thailand | ||
| Singapore | ||
| Rest of Asia-Pacific | ||
| South America | Brazil | |
| Argentina | ||
| Colombia | ||
| Chile | ||
| Peru | ||
| Rest of South America | ||
| Middle East and Africa | South Africa | |
| Saudi Arabia | ||
| United Arab Emirates | ||
| Nigeria | ||
| Egypt | ||
| Morocco | ||
| Turkey | ||
| Rest of Middle East and Africa | ||


Market Definition
- Butter - Butter is a yellow-to-white solid emulsion of fat globules, water, and inorganic salts produced by churning the cream from cows’ milk
- Dairy - Dairy product include milk and any of the foods made from milk, including butter, cheese, ice cream, yogurt, and condensed and dried milk.
- Frozen Desserts - Frozen dairy dessert means and includes products containing milk or cream and other ingredients which are frozen or semi-frozen prior to consumption, such as ice milk or sherbet, including frozen dairy desserts for special dietary purposes, and sorbet
- Sour Milk Drinks - Sour milk is thick, curdled milk, with a sour taste, obtained from the fermentation of milk. Sour milk drinks such as kefir, laban, buttermilk have been considered in the study
| Keyword | Definition |
|---|---|
| Cultured Butter | Cultured butter is prepared by having the raw butter go through chemical processing and has been added with certain emulsifiers and foreign ingredients. |
| Uncultured Butter | This type of butter is one which has not been processed in any way |
| Natural Cheese | The type of cheese in its most natural form. It is made from natural and simple products and ingredients, including fresh and natural salts, natural colors, enzymes, and high-quality milk. |
| Processed Cheese | Processed cheese undergoes the same processes as natural cheese; however, it requires more steps and many different forms of ingredients. Making processed cheese involves melting natural cheese, emulsifying it, and adding preservatives and other artificial ingredients or colorings. |
| Single Cream | Single cream contains around 18% fat. It’s a single layer of cream that appears over boiled milk. |
| Double Cream | Double cream contains 48% fat, more than double the amount of fat of single cream. It’s heavier and thicker than single cream |
| Whipping Cream | This has a much higher fat percentage than single cream (36%). Used to top cakes, pies, and puddings and as a thickener for sauces, soups, and fillings. |
| Frozen Desserts | Desserts that are meant to be eaten in frozen condition. E.g., sherbets, sorbets, frozen yogurts |
| UHT Milk (Ultra-high temperature milk) | Milk heated at a very high temperature. Ultra-high-temperature processing (UHT) of milk involves heating for 1–8 sec at 135–154°C. which kills the spore-forming pathogenic microorganism, resulting in a product with a shelf-life of several months. |
| Non-dairy butter/Plant-based butter | Butter made from plant-derived oil such as coconut, palm, etc. |
| Non-dairy Yogurt | Yogurt made from typically made from nuts, like almonds, cashews, coconuts, and even other foods like soybeans, plantains, oats, and peas |
| On-trade | It refers to restaurants, QSRs, and bars. |
| Off-trade | It refers to supermarkets, hypermarkets, on-line channels, etc. |
| Neufchatel cheese | One of the oldest kinds of cheese in France. It is a soft, slightly crumbly, mold-ripened, bloomy-rind cheese made in the Neufchâtel-en-Bray region of Normandy. |
| Flexitarian | It refers to a consumer preferring a semi-vegetarian diet, that is centered on plant foods with limited or occasional inclusion of meat. |
| Lactose Intolerance | Lactose intolerance is a reaction in digestive system to lactose, the sugar in milk. It causes uncomfortable symptoms in response to the consumption of dairy products. |
| Cream Cheese | Cream cheese is a soft and creamy fresh cheese with a tangy taste made from milk and cream. |
| Sorbets | Sorbet is a frozen dessert made using ice combined with fruit juice, fruit purée, or other ingredients, such as wine, liqueur, or honey. |
| Sherbet | Sherbet is a sweetened frozen dessert made with fruit and some sort of dairy product such as milk or cream. |
| Shelf stable | Foods that can be safely stored at room temperature, or "on the shelf," for at least one year and do not have to be cooked or refrigerated to eat safely. |
| DSD | Direct Store Delivery is the process in supply chain management wherein the product is delivered from manufacturing plant directly to the retailer. |
| OU Kosher | Orthodox Union Kosher is a kosher certification agency based in New York City. |
| Gelato | Gelato is a frozen creamy dessert made with milk, heavy cream and sugar. |
| Grass-fed Cows | Grass-fed cows are allowed to graze in pastures, where they eat a variety of grasses and clover. |


Research Methodology
Mordor Intelligence follows a four-step methodology in all our reports.
- Step-1: Identify Key Variables: In order to build a robust forecasting methodology, the variables and factors identified in Step 1 are tested against available historical market numbers. Through an iterative process, the variables required for market forecast are set, and the model is built on the basis of these variables.
- Step-2: Build a Market Model: Market-size estimations for the forecast years are in nominal terms. Inflation is not a part of the pricing, and the average selling price (ASP) is kept constant throughout the forecast period for each country.
- Step-3: Validate and Finalize: In this important step, all market numbers, variables, and analyst calls are validated through an extensive network of primary research experts from the market studied. The respondents are selected across levels and functions to generate a holistic picture of the market studied.
- Step-4: Research Outputs: Syndicated Reports, Custom Consulting Assignments, Databases & Subscription Platforms


