
Coconut Cream Market Size and Share
Market Overview
| Study Period | 2021 - 2031 |
|---|---|
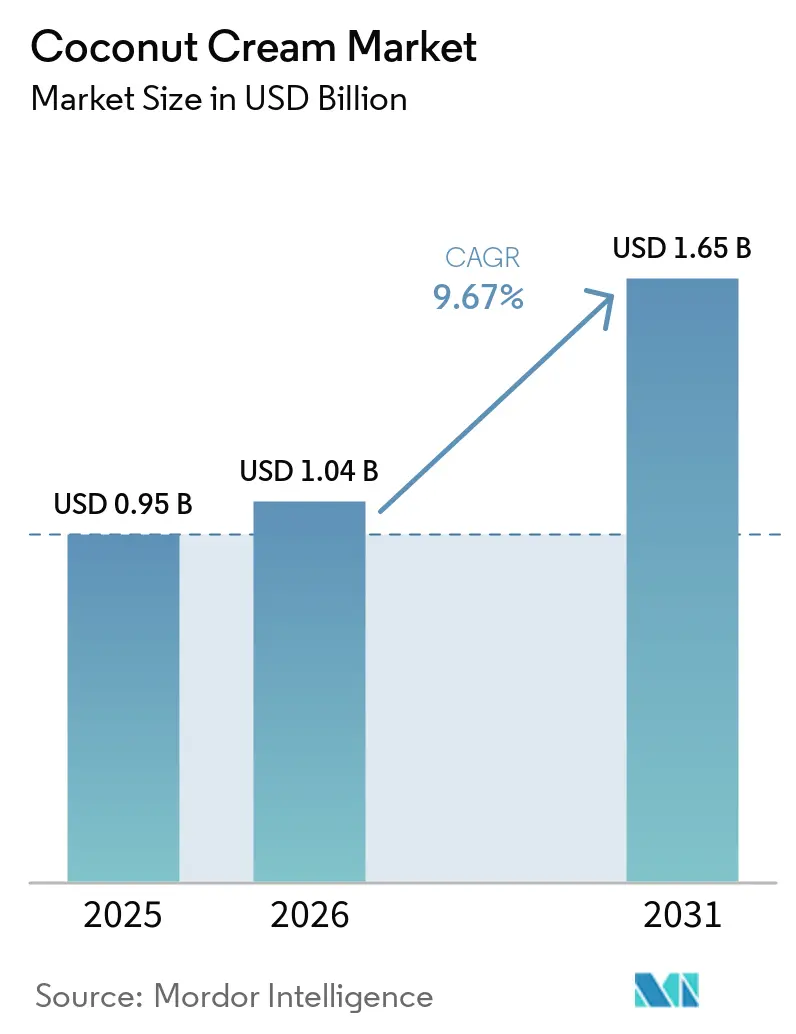
| Market Size (2026) | USD 1.04 Billion |
| Market Size (2031) | USD 1.65 Billion |
| Growth Rate (2026 - 2031) | 9.67 % |
| Fastest Growing Market | Asia-Pacific |
| Largest Market | North America |
| Market Concentration | Medium |
Major Players *Disclaimer: Major Players sorted in no particular order Image © Mordor Intelligence. Reuse requires attribution under CC BY 4.0. | |
Coconut Cream Market Analysis by Mordor Intelligence
The coconut cream market was valued at USD 0.95 billion in 2025 and is expected to reach USD 1.04 billion in 2026, projected to grow to USD 1.65 billion by 2031 at a CAGR of 9.67% from 2026 to 2031. Three structural forces drive this growth: increasing demand for plant-based and dairy-free alternatives in retail and foodservice, the growing popularity of Asian and tropical cuisines in North America and Europe, and consumer preference for minimally processed, clean-label ingredients. As dietary shifts accelerate across developed markets, coconut cream has moved beyond its traditional role as a niche ethnic ingredient to become a mainstream cooking and food manufacturing input. Its adoption spans retail packaged goods, restaurant menus, and industrial food processing, reflecting broad-based demand rather than a single-channel trend. Coconut cream is distinguished from other plant-based alternatives by its functional properties, fat content, heat stability, and emulsification behavior that dairy-free creams have not consistently replicated. These properties make it particularly suitable for applications such as soups, curries, sauces, desserts, and beverages, where texture and stability are critical. This functional advantage supports premium pricing even with higher input costs and positions coconut cream as a durable category in the plant-based ingredients market.
Key Report Takeaways
- By fat content, standard coconut cream held a 58.68% share in 2025, while coconut cream concentrate is forecast to grow at a 10.79% CAGR through 2031.
- By sweetening, unsweetened coconut cream held a 53.34% share in 2025, while sweetened coconut cream is forecast to grow at a 10.88% CAGR through 2031.
- By nature, conventional coconut cream held a 72.89% share in 2025, while organic coconut cream is forecast to grow at an 11.91% CAGR through 2031.
- By packaging format, tetra pak held a 58.19% share in 2025, while cans are forecast to grow at a 10.71% CAGR through 2031.
- By packaging size, below 300 ml held a 34.12% share in 2025, while above 500 ml formats are forecast to grow at a 10.92% CAGR through 2031.
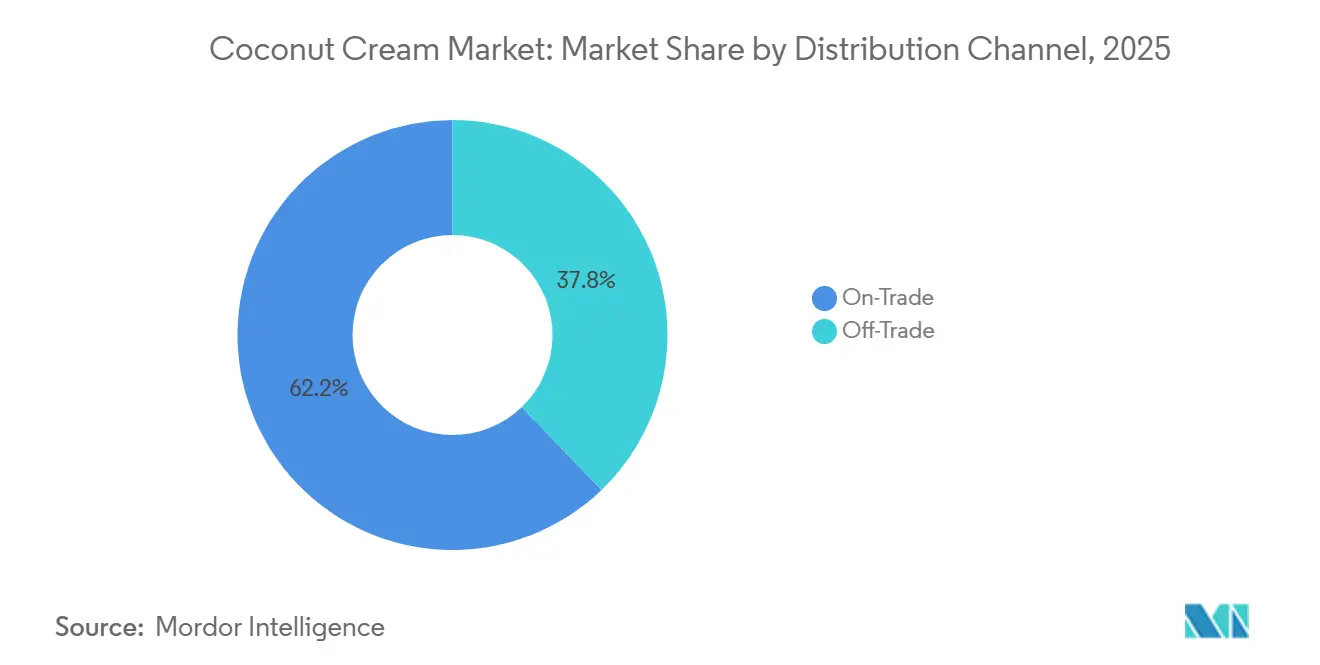
- By distribution channel, on-trade held a 62.18% share in 2025, while off-trade is forecast to grow at an 11.15% CAGR through 2031.
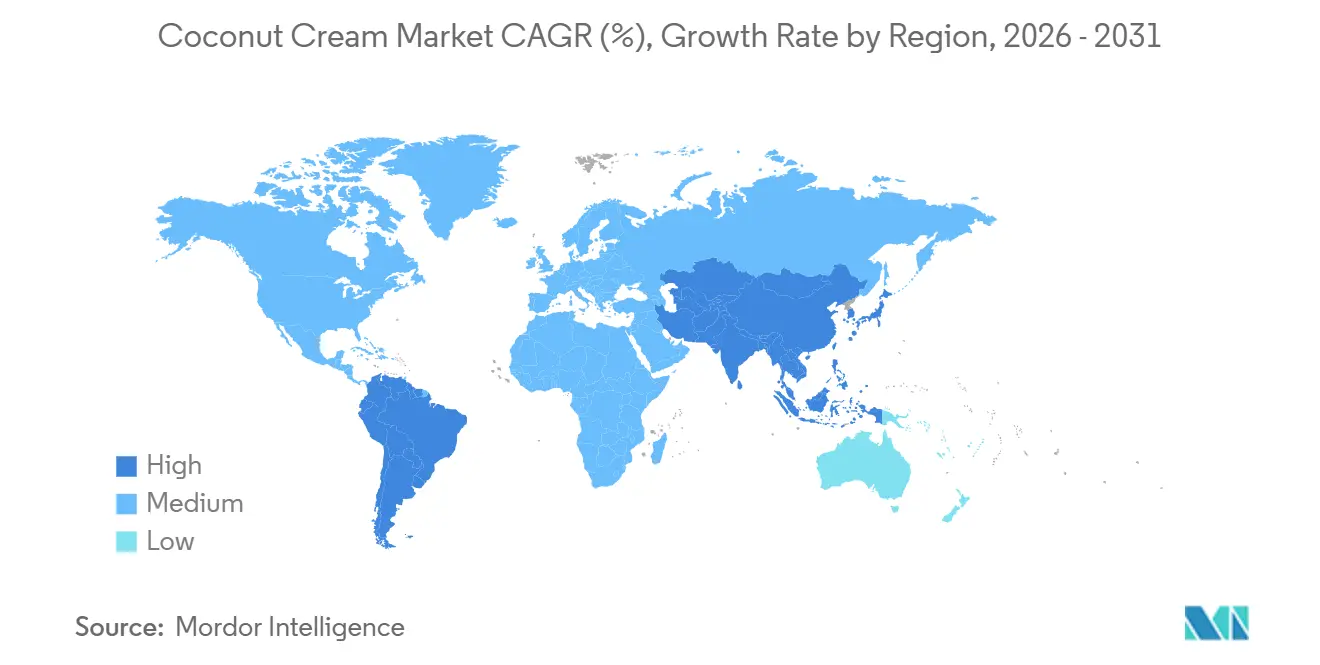
- By geography, North America held 35.22% share in 2025, while Asia-Pacific is forecast to grow at an 11.34% CAGR through 2031.
Note: Market size and forecast figures in this report are generated using Mordor Intelligence’s proprietary estimation framework, updated with the latest available data and insights as of January 2026.
Global Coconut Cream Market Trends and Insights
Drivers Impact Analysis*
| Driver | (~) % Impact on CAGR Forecast | Geographic Relevance | Impact Timeline |
|---|---|---|---|
| Growth in plant-based and dairy-free formulations | +3.2% | Global | Short term (≤ 2 years) |
| Expansion of Asian, Southeast Asian, and Tropical cuisines globally | +1.9% | North America and Europe, spill-over to Middle East and Africa | Medium term (2–4 years) |
| Rising demand for clean-label and naturally derived ingredients | +1.5% | North America and Europe, Asia-Pacific premium tier | Medium term (2–4 years) |
| Premiumization through organic and high-fat formulations | +1.0% | North America and Europe | Long term (≥ 4 years) |
| Aseptic packaging extending shelf life Without cold chain | +0.7% | Global (Asia-Pacific, Middle East and Africa supply origins; North America, European Union import markets) | Short term (≤ 2 years) |
| Coconut cream standardization for foodservice reformulation | +0.5% | North America, Asia-Pacific core | Medium term (2–4 years) |
| Source: Mordor Intelligence | |||
Growth in Plant-Based and Dairy-Free Formulations
The growing adoption of plant-based diets is driving demand for dairy-free ingredients, including coconut cream as a substitute for conventional dairy cream in cooking, baking, desserts, sauces, and beverages. In the United States, the 2025 International Food Information Council (IFIC) Food & Health Survey found that 14% of consumers look for "plant-based" claims when shopping for foods and beverages, indicating that plant-based positioning has become a relevant consideration in packaged-food purchasing[1]. Coconut cream benefits from this shift as it is a naturally plant-derived ingredient that can replace or complement dairy cream while fitting vegan and dairy-free formulations. As manufacturers expand plant-based product ranges, coconut cream is increasingly used as a versatile ingredient for creating creamy textures and rich flavor without relying on conventional dairy ingredients.
Expansion of Asian, Southeast Asian, and Tropical Cuisines Globally
The growing popularity of Asian, Southeast Asian, and tropical cuisines across international foodservice and household cooking is expanding the use of coconut cream as a core culinary ingredient. Coconut cream is widely incorporated into curries, soups, sauces, desserts, beverages, and marinades, particularly across Thai, Indonesian, Malaysian, Indian, and other tropical cuisines. As restaurants, packaged-food manufacturers, and consumers increasingly experiment with global flavors, coconut-based formulations are becoming more common beyond traditional consuming markets. This wider adoption is creating additional applications for coconut cream across ready meals, sauces, desserts, bakery products, and foodservice preparations, supporting demand for the ingredient as global cuisine preferences become more diverse.
Rising Demand for Clean-Label and Naturally Derived Ingredients
Growing consumer preference for recognizable, minimally processed, and naturally derived ingredients is supporting demand for coconut cream across food and beverage applications. Coconut cream aligns with clean-label positioning as it is derived directly from coconut and provides a creamy texture and rich flavor without relying on conventional dairy ingredients. According to Ingredion's 2026 clean-label insights, approximately 49% of consumers actively seek clean-label products, while 65% report increasing their purchases of clean-label products over the past five years[2]. This trend is encouraging food manufacturers to incorporate naturally derived ingredients such as coconut cream into sauces, desserts, bakery products, beverages, and prepared foods, where clean-label credentials and ingredient transparency are increasingly important purchasing considerations.
Premiumization Through Organic and High-Fat Formulations
Rising consumer interest in premium-quality food ingredients is supporting demand for organic and high-fat coconut cream formulations. Consumers and food manufacturers increasingly associate higher-quality coconut cream with richer texture, fuller flavor, and stronger culinary performance, particularly in desserts, sauces, curries, beverages, and bakery applications. Organic formulations further reinforce this positioning by appealing to consumers seeking products aligned with natural and responsible ingredient preferences. This trend is encouraging manufacturers to expand differentiated coconut cream offerings beyond standard formulations, creating opportunities for higher-value products across both retail and foodservice applications.
Restraints Impact Analysis*
| Restraint | (~) % Impact on CAGR Forecast | Geographic Relevance | Impact Timeline |
|---|---|---|---|
| Volatility in coconut availability and raw material prices | -1.8% | Global (Asia-Pacific supply origins; all importing markets) | Short term (≤ 2 years) |
| Availability of dairy and other plant-based substitutes | -0.9% | North America and Europe | Medium term (2–4 years) |
| Inconsistent fat content and sensory performance across origins | -0.7% | Global | Medium term (2–4 years) |
| Higher cost of premium and organic coconut cream | -0.5% | North America and Europe | Long term (≥ 4 years) |
| Source: Mordor Intelligence | |||
Volatility in Coconut Availability and Raw Material Prices
Fluctuations in coconut availability and raw material prices can create cost and supply challenges for coconut cream manufacturers, as production depends heavily on consistent access to mature coconuts. Weather variability, crop diseases, changing farm yields, and seasonal production patterns can affect the availability and quality of coconuts. Shifts in farmer supply, labor costs, transportation expenses, and competing demand can further influence raw material prices. These fluctuations can increase manufacturing costs and complicate procurement planning, particularly for producers operating under fixed-price contracts. Manufacturers may face pressure to either absorb higher input costs or adjust product pricing, which can affect margins and create price uncertainty across the coconut cream supply chain.
Inconsistent Fat Content and Sensory Performance Across Origins
Variations in coconut variety, growing conditions, maturity, processing methods, and geographic origin can result in differences in fat content, creaminess, color, aroma, and flavor of coconut cream. These inconsistencies create challenges for manufacturers seeking consistent product performance, particularly in applications where coconut cream delivers rich texture and distinctive taste, such as sauces, curries, desserts, beverages, and bakery products. This issue is reinforced by broader plant-based food purchasing behavior: the 2024 Plant Based Foods Association data identified taste and flavor as a reason for decreasing plant-based food consumption for 27% of consumers, while 53% cited better taste and texture as a factor that would increase purchase likelihood[3]. Inconsistent sensory performance can therefore reduce repeat purchasing and make it more difficult for coconut cream suppliers and food manufacturers to maintain consistent taste, texture, and formulation outcomes across batches and applications.
*Our forecasts treat driver/restraint impacts as directional, not additive. The impact forecasts reflect baseline growth, mix effects, and variable interactions.
Segment Analysis
By Fat Content: Concentrate Formats Gain Ground in Foodservice
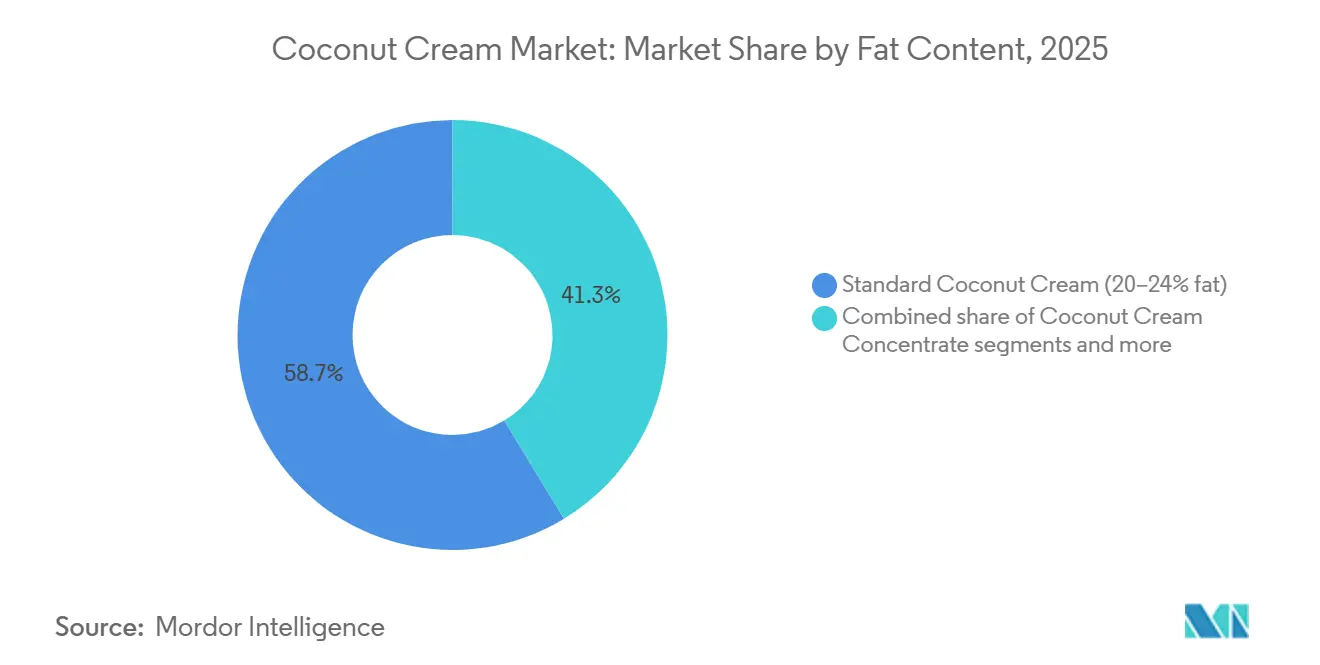
Standard coconut cream (20–24% fat) held a 58.68% value share in 2025, reflecting its broad compatibility with both retail and foodservice applications. This dominance reflects the commercial efficiency of the 20–24% fat range, which balances production yield, packaging compatibility, and culinary performance across a wide range of dish categories. Heavy coconut cream (24–30% fat) captures the premium retail tier, particularly in North America and Europe, where consumers are willing to pay a premium for richer texture in desserts and beverages.
Coconut cream concentrate (>30% fat) is the fastest-growing fat content sub-segment, forecast to expand at a 10.79% CAGR from 2026 to 2031, as foodservice operators seek formats that reduce per-serving handling costs and storage space. A hotel kitchen using concentrate can reconstitute it to the required fat percentages for different dish types, eliminating the need to stock multiple SKUs, a practical advantage that is accelerating institutional adoption. Renuka Agri Foods PLC supplies aseptic coconut cream in fat content ranges from 17% to 30%, with UHT sterilization processing that preserves fat integrity for institutional downstream reconstitution.

By Sweetening: Unsweetened Products Retain Broad Culinary Use
Unsweetened coconut cream accounted for 53.34% of market value in 2025. It is suitable for curries, soups, marinades, and other savory applications where added sugar would limit recipe flexibility. Professional cooks value the control it provides over sweetness and seasoning. The format also suits foodservice procurement, as it can be used across a wide range of menu items. Household buyers use unsweetened options when preparing cuisine-specific dishes at home. This broad functionality has kept unsweetened products ahead in the coconut cream market.
Sweetened coconut cream is forecast to grow at a CAGR of 10.88% from 2026 to 2031. Demand is driven by cocktail mixers, dessert sauces, and ready-to-use tropical drink bases. These products reduce preparation steps in bars and pastry kitchens. Sweetened formats are gaining traction in off-trade and online sales, where convenience is a priority for home users. Naturally sweetened varieties using coconut sugar or fruit-based sweeteners also align with clean-label preferences. This creates a clear split between foodservice demand for ingredient control and retail demand for convenience.
By Nature: Organic Products Grow From a Smaller Base
Conventional coconut cream accounted for 72.89% of market value in 2025. Large foodservice supply chains rely on conventional products for consistent volume, competitive pricing, and standard fat levels. Thai Coconut Public Company reported exports to more than 100 countries, with close to 90% of revenue derived from international business, reflecting the scale of export-oriented supply relationships. These contracts typically depend on standard specifications and repeat procurement. Conventional products remain important for buyers focused on value and reliable supply, and they continue to support the largest volume requirements in the category.
Organic coconut cream is forecast to grow at an 11.91% CAGR from 2026 to 2031. European and North American retailers are allocating more shelf space to products that meet organic and clean-label requirements. Sri Lankan producers, including Renuka Agri Foods, supply aseptic coconut products to international food manufacturers. Organic suppliers require appropriate certification and traceable sourcing to access premium retail channels. Their products generally target buyers willing to pay more for ingredient transparency and origin credentials. This creates a market structure where conventional products serve volume demand while organic products address higher-value demand.
By Packaging Format: Cans Gain in Premium Retail
Tetra Pak held 58.19% of value in 2025. Its position reflects strong use in foodservice, where ambient cartons can reduce restocking frequency for high-volume kitchens. Cartons also support shelf-stable storage and lower dependence on cold-chain handling. These characteristics are valuable for distributors working across long distances. Large foodservice buyers also value standardized carton formats in routine procurement. The format remains closely tied to the operational needs of restaurants, hotels, and catering providers.
Cans are forecast to grow at a 10.71% CAGR from 2026 to 2031. Premium retail brands use BPA-free cans to present organic and single-ingredient products. Cocofina offers an organic coconut cream product in a can that contains 90% coconut. The hermetic seal supports simpler formulations with fewer stabilizers. Cans are also widely recognized by consumers who shop for cooking ingredients. Flexible pouches and sachets support smaller, portable uses, but account for a smaller share of value.
By Packaging Size: Large Formats Benefit From Foodservice Demand
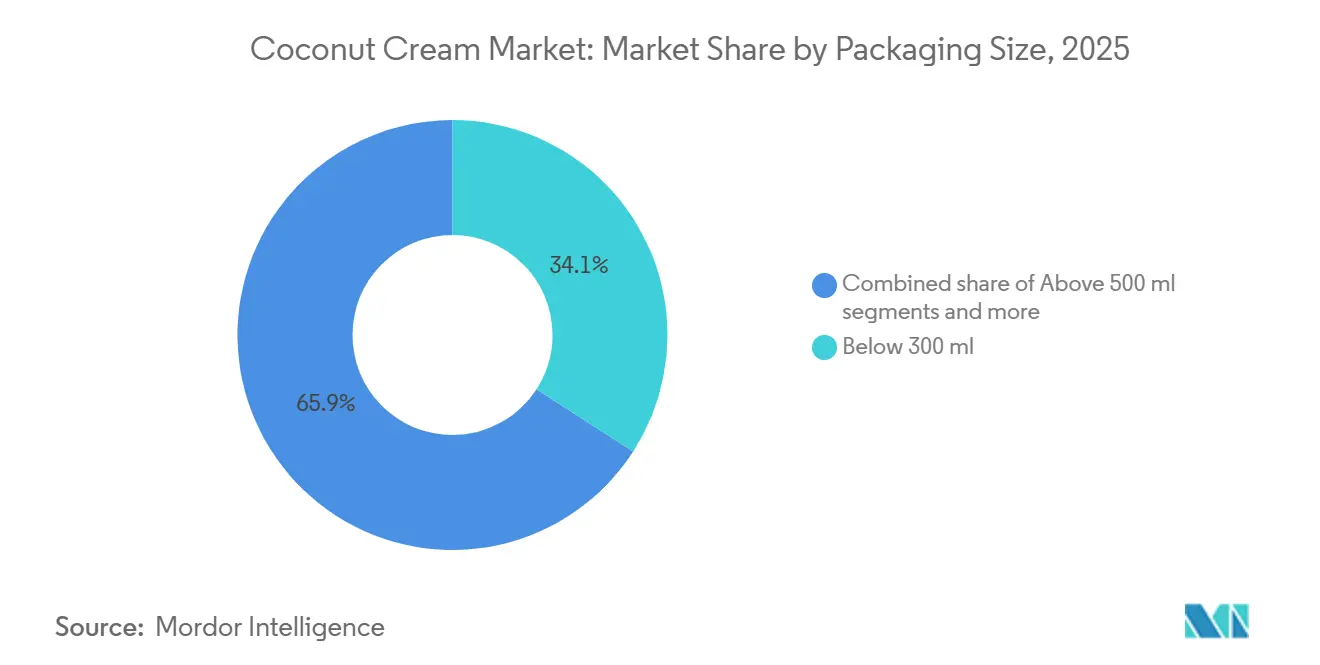
Below 300 ml products held 34.12% of value share in 2025. Smaller formats suit household use, as consumers often purchase coconut cream for specific recipes. They also support trial purchases in North America and Europe. Their practical size helps reduce product waste in households that use coconut cream occasionally. Small cartons and cans maintain visibility in convenience and grocery stores. Premium unit pricing helps this format retain value even when volume growth is slower.
Above 500 ml formats are forecast to expand at a 10.92% CAGR from 2026 to 2031. Restaurants, cafés, hotels, and food manufacturers use larger packs to reduce handling frequency and unit costs. Lucky Coco Asia promotes 1-liter foodservice cartons and larger custom solutions for commercial users. Large formats are also associated with the continued growth of on-trade purchasing. E-commerce supports this trend through multi-pack purchases of 400 ml cans and 1-liter cartons. These patterns give bulk formats a stronger growth trajectory than small household packs.
By Distribution Channel: Off-Trade Channels Expand Through Online Sales
On-trade channels accounted for 62.18% of market value in 2025. Restaurants, hotels, and catering businesses require steady supply, consistent fat content, and bulk pricing, and their purchasing decisions tend to favor established suppliers with reliable logistics. Coconut cream is widely used in professional kitchens for cuisine-specific recipes, desserts, and beverages, giving the foodservice segment an important role in sustaining current category value. On-trade channel market size remains closely tied to the operational requirements of commercial kitchens.
Off-trade channels are forecast to grow at an 11.15% CAGR from 2026 to 2031. Online retail and specialty natural food stores provide smaller premium brands with a route to consumers that does not depend on broad supermarket distribution. The Coconut Collab used Ocado and Amazon for its additive-free coconut cream launch in July 2026. Supermarkets and hypermarkets continue to offer broad reach for mainstream products, while natural food stores and online platforms carry a greater share of premium and organic products. Private-label growth in Europe may expand shelf space but is also likely to increase price pressure on mid-tier brands.
Geography Analysis
North America accounted for 35.22% of value in 2025. The region combines plant-based adoption, premium retail pricing, and established foodservice demand. Thai and Caribbean restaurants, specialty cafés, and meal kit services use coconut cream across varied applications. Organic and clean-label products have a greater influence on category margins in this region than in many others. United States import requirements and labeling rules remain relevant to suppliers serving this market. The U.S. Food and Drug Administration provides guidance on the labeling of plant-based milk and animal food alternatives.
Asia-Pacific is projected to grow at an 11.34% CAGR from 2026 to 2031. The region serves both as a production base and a market with rising local consumption. Thailand's prepared coconut cream exports reached USD 341.1 million in the first 10 months of 2024, with ready-to-use products accounting for 93.13% of export volumes. China, South Korea, and Singapore are increasing their use of santan in cooking and food manufacturing. India and Australia represent additional demand channels through vegetarian food consumption and natural food retail, respectively. The coconut cream market share held by Asia-Pacific producers is also shaped by their export capacity and processing infrastructure.
Europe, South America, the Middle East, and Africa each contribute distinct demand patterns. Europe is a high-value destination for certified organic and clean-label products, with Germany, the United Kingdom, the Netherlands, and France serving as key markets, and Poland and Spain offering additional retail growth. Brazil and Colombia use coconut ingredients in local cooking and benefit from organized retail expansion. The United Arab Emirates and Saudi Arabia support demand through hotel and restaurant imports. Nigeria and South Africa offer volume potential through broad food retail activity.
Competitive Landscape
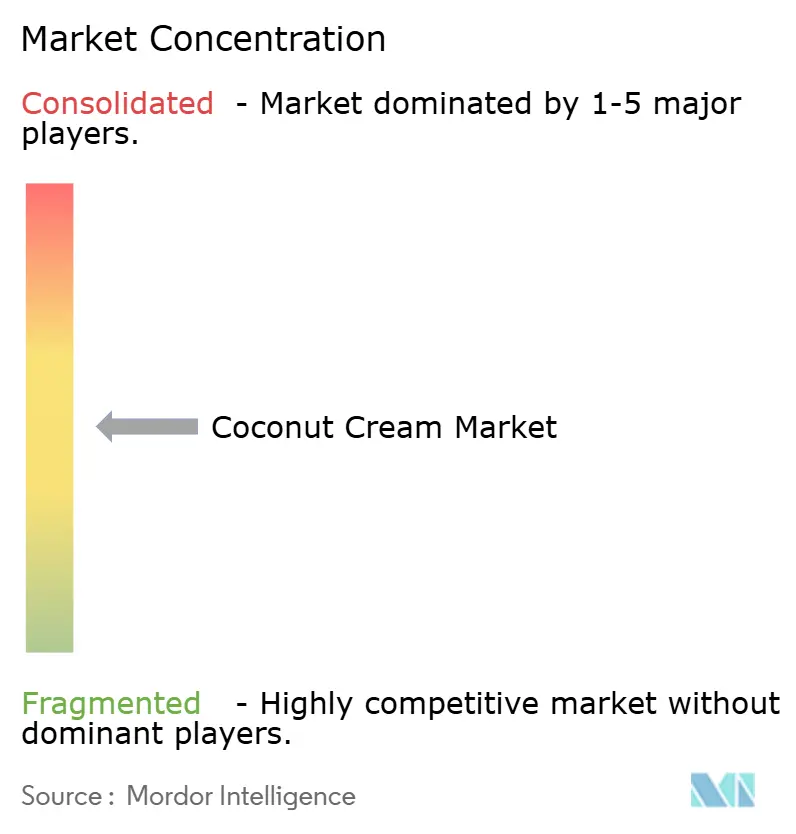
The coconut cream market has a moderately consolidated structure with no disclosed top-player share that would indicate strong market-wide control. Thai Coconut Public Company, Theppadungporn Coconut, Thai Agri Foods, and Sambu Group compete on production volume, processing efficiency, and export access. These players operate primarily across Southeast Asian production hubs, where proximity to raw material supply and established processing infrastructure support their competitive positions. Despite their scale, no single player commands a dominant share across all major export markets, which contributes to the market's fragmented character.
Suppliers increasingly differentiate through aseptic processing, packaging capability, organic certification, and private-label services. Thai Coconut Public Company has invested in aseptic PET capacity to support international distribution of shelf-stable products for export customers. Renuka Holdings, Betrimex, and Kapar Coconut Industries pursue export eligibility through food safety, Halal, Kosher, and quality certifications, which help processors meet requirements in regulated import markets. Branded companies such as GraceKennedy and Pacific Foods of Oregon maintain recognition in their respective regional retail channels, distinguishing their market position from processors focused primarily on private-label or ingredient supply.
The Coconut Company and The Coconut Collab focus on additive-free products targeting clean-label buyers. The Coconut Collab's July 2026 product launch used a 100% coconut formulation distributed through online retail channels. Suppliers also identify growth opportunities in products incorporating MCT oil, plant protein, or vitamins, as well as in barista-grade formats that require stable emulsification under steam. These applications demand consistent product performance beyond clean-label positioning. Consolidation in Philippine processing may strengthen the negotiating position of the largest local processors, potentially enabling greater investment in quality standards and export capacity.
Coconut Cream Industry Leaders
-
Nestle SA
-
Edward & Sons Trading Co.
-
Windmill Organics Limited
-
McCormick & Company, Inc.
-
Greenfield Products, LLC
- *Disclaimer: Major Players sorted in no particular order
Recent Industry Developments
- July 2026: The Coconut Collab launched a 100% coconut, additive-free Coconut Cream containing no emulsifiers, preservatives, or stabilizers. The product is sold through Ocado and Amazon and is sourced from Sri Lanka's Coconut Triangle.
- December 2025: Metro Pacific Coconut Holdings completed its acquisition of Franklin Baker Company of the Philippines. Metro Pacific stated that its combined coconut entities account for 70% of Philippine food-grade coconut exports and process more than 2 million coconuts daily.
- May 2025: Thai Coconut Public Company outlined a global expansion program, identifying the Middle East, the United States, China, Japan, and South Korea as priority markets.
Global Coconut Cream Market Report Scope
Coconut cream is produced by grinding or pressing mature coconut meat and extracting it with water, resulting in an emulsion of coconut fat, water, and naturally occurring coconut solids. It has a higher fat content and thicker consistency than coconut milk, delivering a rich coconut flavor and creamy texture. Coconut cream is widely used in curries, sauces, soups, desserts, bakery products, beverages, and plant-based food formulations, where it functions as both a flavoring ingredient and a dairy-free source of creaminess.
The global coconut cream market is segmented by fat content, sweetening, nature, packaging format, packaging size, distribution channel, and geography. By fat content, the market is segmented into standard coconut cream (20–24% fat), heavy coconut cream (24–30% fat), and coconut cream concentrate (>30% fat). By sweetening, the market is segmented into unsweetened and sweetened coconut cream. By nature, the market is segmented into conventional and organic coconut cream. By packaging format, the market is segmented into cans, Tetra Pak, and other packaging types. By packaging size, the market is segmented into below 300 mL, 300–500 mL, and above 500 mL. By distribution channel, the market is segmented into on-trade and off-trade; the off-trade segment is further segmented into supermarkets/hypermarkets, convenience/grocery stores, online retail stores, and other off-trade channels. By geography, the market is segmented into North America, Asia-Pacific, Europe, and other regions. The report provides market size and forecasts in value (USD) and volume (liters) for all the above segments.
| Standard Coconut Cream (20-24% fat) |
| Heavy Coconut Cream (24-30% fat) |
| Coconut Cream Concentrate (>30% fat) |
| Unsweetened Coconut Cream |
| Sweetened Coconut Cream |
| Conventional |
| Organic |
| Cans |
| Tetra Pack |
| Other Packaging Types |
| Below 300 mL |
| 300-500 mL |
| Above 500 mL |
| On-Trade | |
| Off-Trade | Supermarkets/Hypermarkets |
| Convenience/Grocery Stores | |
| Online Retail Stores | |
| Other off-trade Channels |
| North America | United States |
| Canada | |
| Mexico | |
| Rest of North America | |
| Europe | Germany |
| United Kingdom | |
| Italy | |
| France | |
| Spain | |
| Netherlands | |
| Poland | |
| Belgium | |
| Sweden | |
| Rest of Europe | |
| Asia-Pacific | China |
| India | |
| Japan | |
| Australia | |
| Indonesia | |
| South Korea | |
| Thailand | |
| Singapore | |
| Rest of Asia-Pacific | |
| South America | Brazil |
| Argentina | |
| Colombia | |
| Chile | |
| Peru | |
| Rest of South America | |
| Middle East and Africa | South Africa |
| Saudi Arabia | |
| United Arab Emirates | |
| Nigeria | |
| Egypt | |
| Morocco | |
| Turkey | |
| Rest of Middle East and Africa |
| By Fat Content | Standard Coconut Cream (20-24% fat) | |
| Heavy Coconut Cream (24-30% fat) | ||
| Coconut Cream Concentrate (>30% fat) | ||
| By Sweetening | Unsweetened Coconut Cream | |
| Sweetened Coconut Cream | ||
| By Nature | Conventional | |
| Organic | ||
| By Packaging Format | Cans | |
| Tetra Pack | ||
| Other Packaging Types | ||
| By Packaging Size | Below 300 mL | |
| 300-500 mL | ||
| Above 500 mL | ||
| By Distribution Channel | On-Trade | |
| Off-Trade | Supermarkets/Hypermarkets | |
| Convenience/Grocery Stores | ||
| Online Retail Stores | ||
| Other off-trade Channels | ||
| By Geography | North America | United States |
| Canada | ||
| Mexico | ||
| Rest of North America | ||
| Europe | Germany | |
| United Kingdom | ||
| Italy | ||
| France | ||
| Spain | ||
| Netherlands | ||
| Poland | ||
| Belgium | ||
| Sweden | ||
| Rest of Europe | ||
| Asia-Pacific | China | |
| India | ||
| Japan | ||
| Australia | ||
| Indonesia | ||
| South Korea | ||
| Thailand | ||
| Singapore | ||
| Rest of Asia-Pacific | ||
| South America | Brazil | |
| Argentina | ||
| Colombia | ||
| Chile | ||
| Peru | ||
| Rest of South America | ||
| Middle East and Africa | South Africa | |
| Saudi Arabia | ||
| United Arab Emirates | ||
| Nigeria | ||
| Egypt | ||
| Morocco | ||
| Turkey | ||
| Rest of Middle East and Africa | ||
Key Questions Answered in the Report
What is driving growth in the coconut cream market?
Plant-based formulation demand, wider use of Asian and tropical cuisines, clean-label purchasing, and shelf-stable processing support growth. The category is forecast to grow at a 9.67% CAGR from 2026 to 2031.
What is the forecast value of coconut cream sales by 2031?
The category is projected to reach USD 1.65 billion by 2031, rising from USD 1.04 billion in 2026.
Which coconut cream type has the largest share?
Standard coconut cream held 58.68% of value in 2025 because it is compatible with a wide range of retail and foodservice recipes.
Which nature segment is expanding fastest?
Organic coconut cream is forecast to grow at an 11.91% CAGR through 2031, supported by clean-label and premium retail demand.