
Market Overview
| Study Period | 2021 - 2031 |
|---|---|
| Market Size (2026) | USD 7.97 Billion |
| Market Size (2031) | USD 10.77 Billion |
| Growth Rate (2026 - 2031) | 6.20 % |
| Fastest Growing Market | Asia Pacific |
| Largest Market | North America |
| Market Concentration | Medium |
Major Players
*Disclaimer: Major Players sorted in no particular order Image © Mordor Intelligence. Reuse requires attribution under CC BY 4.0. |
|
Coffee Creamer Market Analysis by Mordor Intelligence
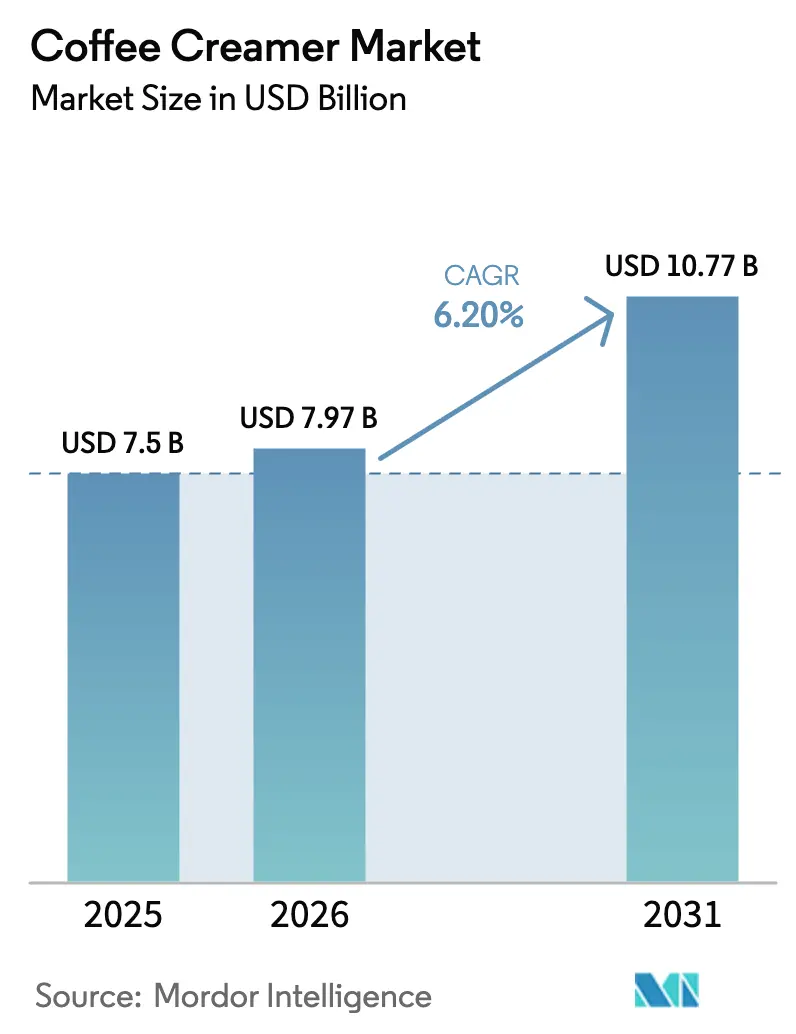
The coffee creamer market size was valued at USD 7.50 billion in 2025 and estimated to grow from USD 7.97 billion in 2026 to reach USD 10.77 billion by 2031, at a CAGR of 6.2% during the forecast period (2026-2031). At-home specialty brewing devices have taken center stage in household coffee routines, and with remote work patterns keeping coffee consumption anchored in the kitchen, demand is surging. These devices offer consumers the ability to replicate café-quality beverages at home, further driving their popularity. Creamers have transitioned from being mere commodities to essential, experience-defining ingredients. This shift, driven by functional fortification, plant-based formats, and premium flavor systems, allows brands to command price premiums that traditional dairy products struggle to match. Functional fortification includes the addition of vitamins, minerals, or other health-focused ingredients, while plant-based formats cater to the growing demand for dairy alternatives. Premium flavor systems enhance the sensory experience, making creamers a key component in crafting personalized beverages. While liquid products dominate sales due to their barista-style mouthfeel, powder formats are gaining traction thanks to innovative spray-drying processes that enhance solubility and reduce clumping. These advancements make powdered creamers more convenient and appealing to consumers. North America stands as the largest revenue contributor, but it's the Asia-Pacific region that's witnessing the fastest growth, fueled by China's double-digit coffee consumption surge and a burgeoning urban middle class. The rapid urbanization and rising disposable incomes in the region are further accelerating the adoption of coffee and related products.
Key Report Takeaways
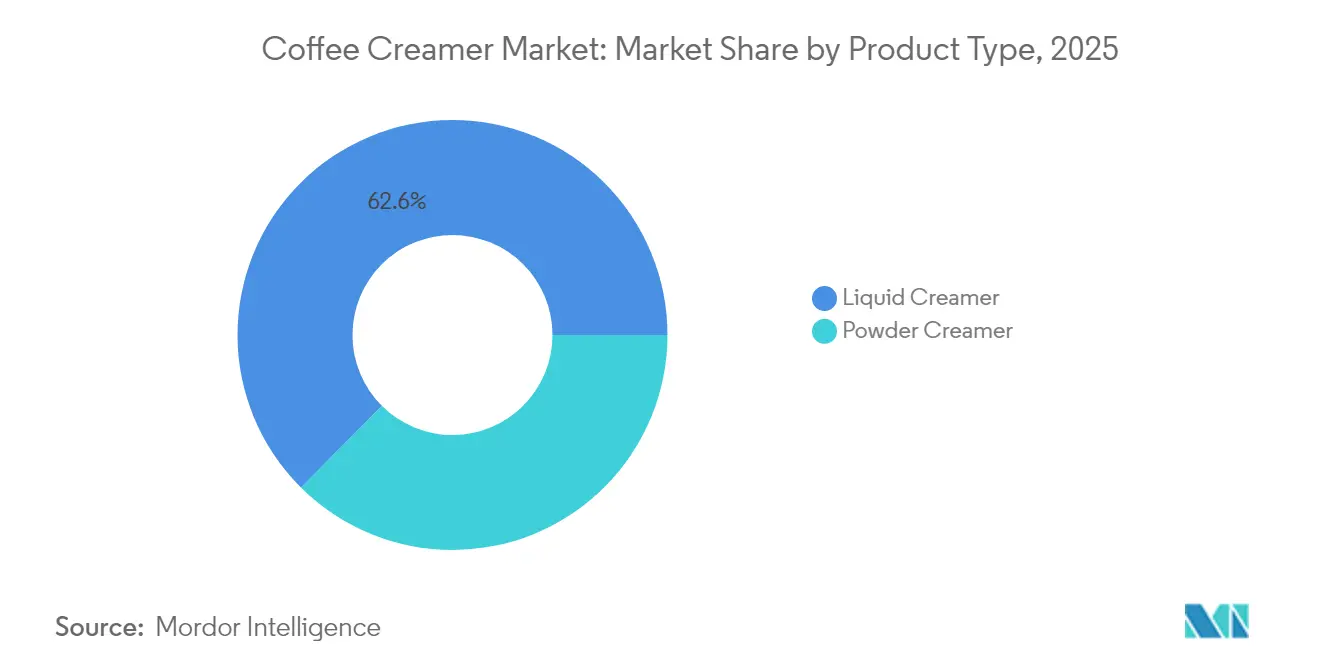
- By type, liquid coffee creamer held 62.55% of the 2025 coffee creamer market share and powder coffee creamer is projected to grow at a 4.92% CAGR through 2031.
- By flavor, flavored variants captured 67.70% of 2025 sales, while unflavored products are expected to expand at a 5.05% CAGR between 2026 and 2031.
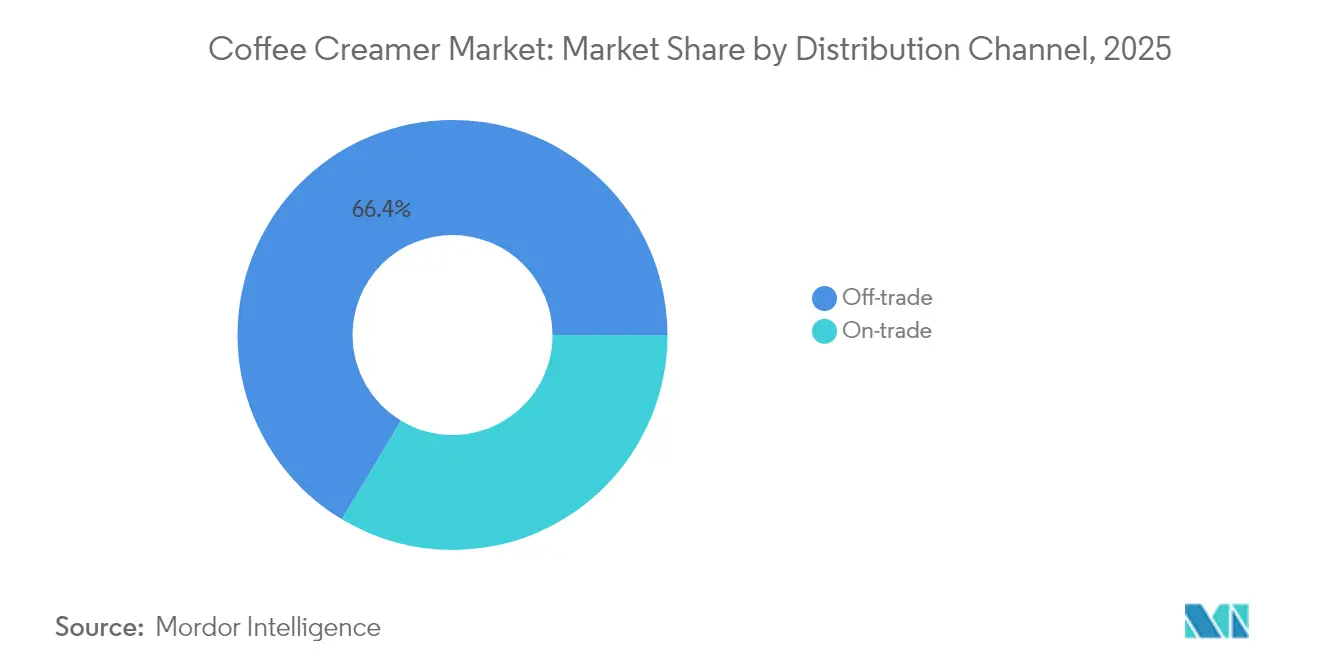
- By distribution channel, off-trade accounted for 66.40% of 2025 revenue; on-trade channels are predicted to increase at a 5.83% CAGR during the forecast period.
- By geography, North America controlled 37.05% of 2025 global value, whereas Asia-Pacific is on track for a 6.98% CAGR to 2031.
Note: Market size and forecast figures in this report are generated using Mordor Intelligence’s proprietary estimation framework, updated with the latest available data and insights as of 2026.
Market Trends and Insights
Drivers Impact Analysis of Coffee Creamer Market*
| Driver | (~) % Impact on CAGR Forecast | Geographic Relevance | Impact Timeline |
|---|---|---|---|
| Growth in at-home specialty-coffee consumption | +1.2% | Global, with North America and Europe leading adoption | Medium term (2-4 years) |
| Rapid expansion of plant-based and lactose-free diets | +1.5% | North America, Europe, and Asia-Pacific urban centers | Long term (≥ 4 years) |
| Premiumisation via novel flavours and functional fortification | +1.0% | Global, premium segments in all regions | Medium term (2-4 years) |
| E-commerce and D2C acceleration in beverage categories | +0.9% | Global, with Asia-Pacific e-commerce infrastructure driving growth | Short term (≤ 2 years) |
| Coffee-shop partnerships boosting brand visibility | +0.7% | North America, Europe, select Asia-Pacific markets | Medium term (2-4 years) |
| RFID-enabled refill stations in offices and cafés | +0.5% | North America, Europe corporate environments | Long term (≥ 4 years) |
| Source: Mordor Intelligence | |||
Growth in at-home specialty-coffee consumption
As remote work reshaped daily routines, 81% of coffee moments shifted from cafés to homes. In 2024, demand for whole beans surged by 46%, driven by consumers investing in grinders and espresso machines to replicate café-quality coffee at home[1]Source: National Coffee Association, "National Coffee Data Trends 2024", ncausa.org. This trend opened doors for premium creamers, which adeptly balance acidity and enhance flavor profiles without requiring barista expertise, catering to the growing preference for high-quality, customizable coffee experiences. Meanwhile, office coffee service providers enjoyed double-digit revenue growth, fueled by hybrid workplaces setting up pantry stations that depend on ambient-stable products to meet the needs of employees splitting time between home and office. While powder variants boast an extended shelf life, refrigerated liquid creamers maintain dominance, offering a texture and taste akin to fresh milk, which appeals to consumers seeking a premium coffee experience. This shift in behavior solidifies the coffee creamer's status as a pantry essential, moving it away from being merely a discretionary buy.
Rapid expansion of plant-based and lactose-free diets
Oat-based formulas, favored for their neutral taste that requires minimal sugar masking, are leading the charge as flexitarian and vegan consumers drive market growth. These formulas cater to the growing demand for healthier and more sustainable alternatives, appealing to a wide range of consumers seeking plant-based options. Non-dairy liquids, specially crafted to foam under steam and branded as "barista-edition," are making waves in both foodservice and retail, bolstering their premium image. These products not only enhance the coffee experience but also bridge the gap between professional baristas and at-home consumers, further expanding their market reach. Regulatory incentives are amplifying this trend; the FDA's recent endorsement of certain low-saturated-fat oils as "healthy" is nudging brands to transition from coconut or palm kernel oils to sunflower and canola[2]Source: Food and Drug Administration, "FDA Finalizes Updated 'Healthy' Nutrient Content Claim", fda.gov. This shift aligns with consumer preferences for cleaner labels and healthier ingredients. However, this reformulation journey isn't without its hurdles; flavor houses are tackling oxidative-stability challenges through innovative microencapsulation techniques, ensuring product quality and shelf stability. Consequently, mainstream grocery chains are witnessing a surge in the availability of plant-based SKUs, making these products more accessible to a broader audience.
Premiumization via novel flavors and functional fortification
Flavor portfolios have expanded from traditional vanilla and hazelnut to bakery-inspired notes like pumpkin spice and cinnamon roll, often commanding a 20-30% price premium. This shift reflects evolving consumer preferences for unique and indulgent flavors. Additionally, ingredients like MCT oil, collagen, and adaptogens are positioning creamers as tools for wellness rather than mere indulgences, catering to the growing demand for functional food products. Laird Superfood exemplifies this trend, offering lion’s-mane-infused powders aimed at boosting cognitive performance and aligning with the health-conscious consumer base. Yet, while functional ingredients enhance benefits, they can disrupt flavor balance, necessitating encapsulation—a process that inflates manufacturing costs. Brands adept at overcoming taste-masking hurdles gain a distinct competitive advantage, as they can deliver both functionality and flavor without compromise.
E-commerce and direct-to-consumer acceleration
In 2024, 18% of all creamer sales occurred online, driven by subscriptions that mitigated stock-out risks and eased shipping challenges for bulky liquids. These subscriptions not only ensured consistent availability but also enhanced customer convenience by automating repeat purchases. Direct-to-consumer (D2C) platforms enabled brands to trial limited-edition flavors every six months, significantly shortening the usual retail iteration timeline and allowing companies to quickly adapt to consumer preferences. The Asia-Pacific region showcases the potential; here, live-stream commerce and same-day delivery have become standard for refrigerated product orders, catering to the growing demand for convenience and immediacy. However, the primary challenge lies in the last-mile cold-chain costs, which can surpass USD 2 per unit unless average basket values are kept elevated. To address this, numerous vendors are bundling multipacks to achieve desired profitability levels, leveraging economies of scale to offset high logistical expenses.
Restraints Impact Analysis of Coffee Creamer Market*
| Restraint | (~) % Impact on CAGR Forecast | Geographic Relevance | Impact Timeline |
|---|---|---|---|
| Raw-material price volatility (dairy and vegetable oils) | -0.8% | Global, with acute impact in dairy-dependent North America and Europe | Short term (≤ 2 years) |
| Regulatory scrutiny on sugar and trans-fat labelling | -0.5% | North America, Europe (FDA, EU regulatory frameworks) | Medium term (2-4 years) |
| Taste-gap versus fresh dairy limiting repeat purchase | -0.6% | Global, particularly in markets with strong dairy traditions | Long term (≥ 4 years) |
| ESG backlash on non-certified palm-oil sourcing | -0.4% | Global, with Europe leading ESG enforcement | Medium term (2-4 years) |
| Source: Mordor Intelligence | |||
Raw-material price volatility
Feed costs and weather fluctuations drive milk prices, squeezing margins as creamers grapple with limited pricing flexibility. These fluctuations are often unpredictable, making it challenging for manufacturers to maintain stable profit margins. Similarly, palm oil contends with shocks from El Niño patterns and export restrictions, which disrupt supply chains and escalate input costs for non-dairy products. While futures hedging and multi-sourcing mitigate some risks, they introduce complexities in formulations that must navigate flavor and regulatory challenges, often requiring additional resources and time. Major multinationals are vertically integrating, moving into dairy cooperatives and oilseed crushing to secure supply chains and reduce dependency on external suppliers. In contrast, smaller brands, lacking the capital for such maneuvers, find themselves at a disadvantage, struggling to compete on both cost and operational efficiency. As a result, managing costs remains pivotal to the category's strategy amidst this volatility, with companies continuously seeking innovative solutions to balance quality, compliance, and profitability.
Regulatory scrutiny on sugar and trans-fat labeling
Products high in saturated fat or added sugar will be flagged by the FDA’s proposed Front-of-Package icons, putting many flavored creamers at a disadvantage[3]Source: Federal Register, "Food Labeling: Front-of-Package Nutrition Information", federalregister.gov. These icons aim to provide consumers with clearer nutritional information, potentially influencing purchasing decisions. The pressure to reformulate intensifies with additional restrictions on the “healthy” claim, pushing for sugar reductions of up to 40%. This creates significant challenges for manufacturers as they must balance taste, cost, and compliance. While hydrogenated oils have mostly been phased out, compliance checks are still triggered by trace amounts found in imported inputs, adding another layer of complexity to the supply chain. Companies already promoting unsweetened or zero-sugar lines are poised to gain increased shelf visibility once the icons are mandated, as these products align more closely with the new guidelines. On the other hand, manufacturers who are slow to reformulate may incur costs from SKU rationalization and risk being delisted from shelves, potentially impacting their market share and profitability.
*Our forecasts treat driver/restraint impacts as directional, not additive. The impact forecasts reflect baseline growth, mix effects, and variable interactions.
Coffee Creamer Market Segment Analysis
By Type:
Liquid Formats Dominate, Powder Gains Through Shelf-Life EconomicsIn 2025, liquid creamers captured a commanding 62.55% share of the coffee creamer market, thanks to their convenience and a sensory profile that closely mimics dairy milk. While dairy-based liquids lead in volume, non-dairy options like oat and almond are on the rise, achieving taste parity and catering to specific dietary needs. Eye-catching cartons in dairy cases spur impulse buys, and bulk bags are favored by foodservice dispensers to reduce dosing errors. Although cold-chain transport adds an extra USD 0.50 per unit, consumers still prioritize the perceived freshness, even with a shorter 60-90 day shelf life. The growing preference for liquid creamers is also driven by their versatility, as they blend seamlessly into both hot and cold beverages, making them a popular choice among consumers seeking convenience without compromising on quality.
Powdered creamers are set to expand at a 4.92% CAGR through 2031, thanks to advancements in spray-drying that boost solubility, bringing them closer to their refrigerated counterparts. Institutions favor dairy powders for their ambient storage, bulk packaging, and an impressive 18-24 month shelf life, which streamlines logistics and reduces shrinkage. Non-dairy powders, with their portability, resonate with vegan travelers. Meanwhile, innovations like Danone’s UHT partnered with Dunkin’ sidestep the need for chilling. In Europe, as sustainability features like recyclability gain momentum, regulatory constraints on labeling “milk” for plant-based liquids are pushing brands towards inventive packaging solutions. Additionally, powdered creamers are increasingly being adopted in regions with limited cold-chain infrastructure, as their long shelf life and ease of transport make them a practical and cost-effective alternative to liquid creamers.



By Flavor:
Flavored Variants Lead, Clean-Label Unflavored AcceleratesIn 2025, flavored creamers dominated the coffee creamer market, accounting for 67.70% of sales. Vanilla, hazelnut, and caramel led in volume shares, reflecting their widespread consumer appeal. Seasonal favorites, like pumpkin spice, not only drive demand spikes but also command 20-30% price premiums, pushing the market towards premiumization by catering to consumers willing to pay more for unique, limited-time offerings. Meanwhile, functional variants, such as collagen-infused vanilla and MCT-rich caramel, merge indulgence with wellness, attracting health-conscious consumers with familiar flavors that offer added benefits. Brands are increasingly tapping into social media platforms, sourcing flavor ideas directly from crowds, and accelerating development cycles to align with the rapidly evolving preferences of digital consumers.
Unflavored creamers are projected to see a 5.05% CAGR growth rate through 2031. This surge is attributed to health-conscious consumers gravitating towards unsweetened, clean-label choices that prioritize simplicity and transparency. In response, retailers are broadening their offerings, catering to a demand for simpler profiles amidst flavor fatigue and limited shelf space. With regulatory scrutiny on added sugars, there's a clear tilt towards low-sugar alternatives, often sweetened with monk fruit or stevia. However, brands face challenges with off-notes, necessitating innovative masking solutions to maintain taste appeal. To mitigate risks associated with slow-moving products, brands are now piloting flavors digitally, leveraging online platforms to assess reorder rates and consumer interest before committing to physical store launches, thereby optimizing product success rates.
By Distribution Channel:
Off-Trade Still Rules, On-Trade Partnerships Create New AvenuesIn 2025, supermarkets, through diverse offerings and regular promotions, accounted for 66.40% of coffee creamer revenue, enticing households to try their products. These promotions and assortments allow supermarkets to cater to a wide range of consumer preferences, making them a dominant channel in the off-trade market. Convenience stores, focusing on immediate needs, offer single-serve creamers that command a premium per ounce, appealing to on-the-go consumers who prioritize convenience over cost. Meanwhile, drug and dollar stores cater to budget-conscious shoppers with private-label products, which are priced lower than branded alternatives, intensifying competition and putting pressure on established brands to innovate or adjust pricing strategies. Online sales in off-trade channels are surging, leveraging subscription bundles to tackle challenges of shipping heavy liquids and lowering unit costs. These bundles not only address logistical hurdles but also encourage customer retention through recurring purchases.
On-trade establishments, such as cafés, quick-service restaurants, and workplace canteens, are set to grow at a 5.83% CAGR. This growth is fueled by co-branded products that bring café flavors to grocery shelves, bridging the gap between on-trade and off-trade channels. Loyalty programs at coffee shops facilitate SKU cross-promotions, allowing customers to replicate signature drinks at home, thereby bolstering brand allegiance and driving repeat purchases. E-commerce trends differ by region: China's live-streaming platform amplifies impulse buys by creating engaging, real-time shopping experiences, while North America's subscribe-and-save model caters to everyday essentials, offering convenience and cost savings for regular buyers. The foodservice industry is evolving, no longer viewing creamers merely as cost centers but as branded specialties that enhance ticket sizes in a competitive landscape. By positioning creamers as value-added products, foodservice providers can differentiate themselves and attract a broader customer base.
Geography Analysis
North America Coffee Creamer Market
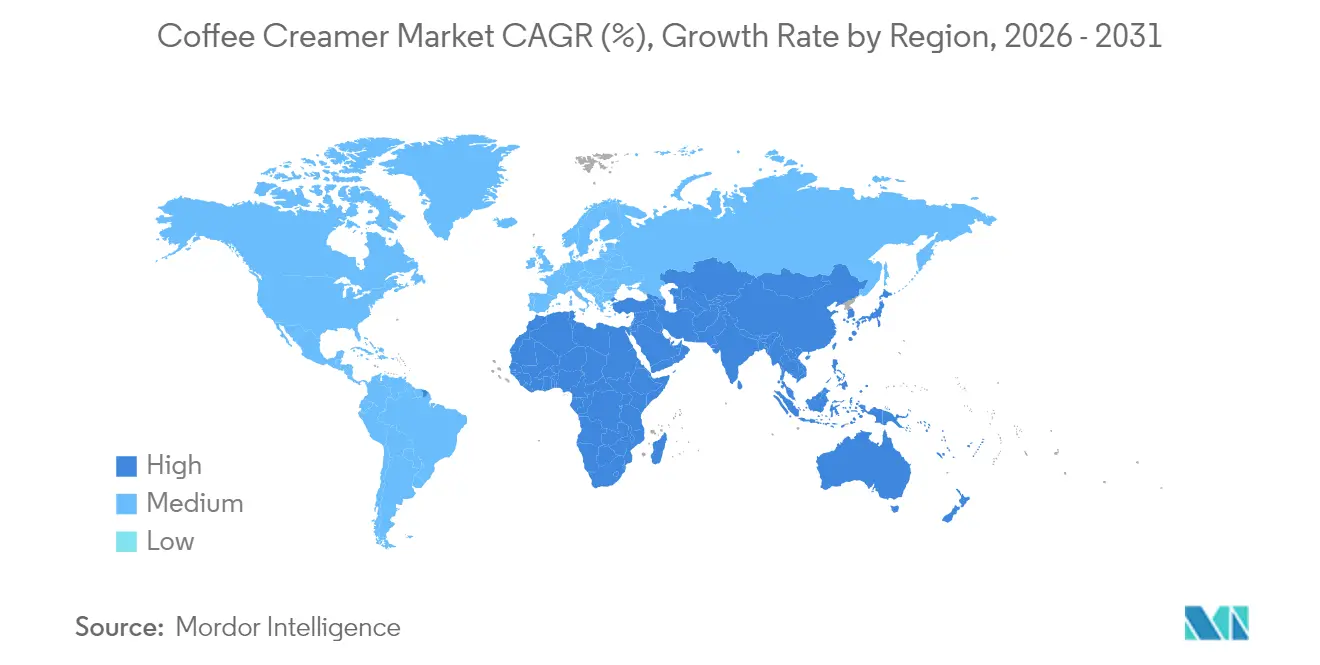
In 2025, North America accounted for 37.05% of global coffee revenue, underscoring its deep-rooted coffee culture and the widespread use of single-serve brewers, which promote the exploration of diverse creamer flavors. Growth in the category leans towards premiumization, rather than mere increases in per-capita consumption. Notably, functional and plant-based liquids command prices 30-50% higher than their conventional dairy counterparts. The FDA's front-of-package initiative and revisions to "healthy" claims, both rolled out between late 2024 and early 2025, compel established brands to either cut down on sugars and saturated fats or risk diminished shelf presence. Brands like Nutpods and Califia Farms, having swiftly adapted to these new thresholds, stand poised for enhanced visibility once the new labeling icons debut. With rising disposable incomes and a burgeoning café culture, both Canada and Mexico present ripe opportunities, especially among younger consumers. Yet, brand loyalty faces challenges as retailers leverage first-party data to discount popular flavors, intensifying the pressure from private labels.
APAC Coffee Creamer Market
Asia-Pacific is on track to lead all regions with a projected 6.98% CAGR through 2031, driven by a surge in coffee adoption across China, India, and Indonesia. China, now guzzling over 1.3 billion cups daily, witnesses a boom in specialty cafés across tier-one and tier-two cities, familiarizing consumers with flavored creamers in iced drinks. The rise of same-day grocery apps has made refrigerated product delivery commonplace, effectively addressing the cold-chain challenges that previously hindered the growth of liquid creamers. In India, while per-capita coffee consumption lags, urban millennials are embracing café lifestyles, leading to a growing interest in plant-based creamers that align with their vegetarian preferences. Japan, though mature, showcases innovation as vending machines and convenience stores increasingly offer single-serve creamer pods, underscoring the competitive edge of advanced packaging technology. Flavor preferences vary regionally: in parts of East Asia, matcha and black-sesame flavors are gaining traction over vanilla, highlighting the need for localized offerings.
EMEA and South America Coffee Creamer Market
Europe, South America, and the Middle East and Africa, while collectively accounting for about a quarter of global sales, exhibit diverse market dynamics. Europe's commitment to sustainability mandates rigorous sourcing audits; for instance, palm oil must be RSPO certified, and non-compliance with the EU Deforestation Regulation can lead to import bans. Northern European markets gravitate towards plant-based creamers, driven by climate-conscious narratives, while Southern Europe, rooted in espresso traditions, continues to favor fresh dairy. In South America, despite a general preference for black coffee or minimal milk limiting creamer consumption urban cafés in Brazil are beginning to experiment with flavored cold brews enhanced by specialty creamers. Meanwhile, the Middle East and Africa predominantly utilize powdered formats, better suited for hot climates and limited refrigeration. However, as incomes rise in Gulf states, there's a burgeoning appetite for premium liquid creamers. The absence of a unified regional standard in labeling and tariff regimes complicates operations, leading to inflated compliance costs for multinationals looking to expand beyond their primary markets.

Regulatory Landscape
Coffee creamers are primarily regulated as packaged foods, with labeling and composition requirements affecting both dairy and non-dairy formulations. In the United States, FDA rules under 21 CFR Part 101 set requirements for Nutrition Facts, ingredient lists in descending order of predominance, and major allergen declarations (notably milk, soy, and tree nuts). Standards of Identity within 21 CFR Parts 131-169 also influence how dairy and cream-related products can be represented. Parallel category-specific guidance extends to non-dairy dry creamer, including USDA Agricultural Marketing Service procurement specifications (A-A-20043D), which can shape B2B and institutional formulations and quality parameters.
Beyond safety and labeling, compliance expectations increasingly tie to nutrition positioning and responsible sourcing. The FDA finalized its updated "healthy" nutrient content claim framework, which affects saturated-fat and ingredient choices across both dairy and plant-based creamers. The National Coffee Association also publishes coffee product labeling guidance used across retail and foodservice. In Europe, sustainability-linked compliance, including due diligence expectations around deforestation-risk commodities, reinforces traceability needs for vegetable oils and pushes suppliers toward auditable sourcing systems as brands balance clean-label reformulation with ESG requirements.
Competitive Landscape
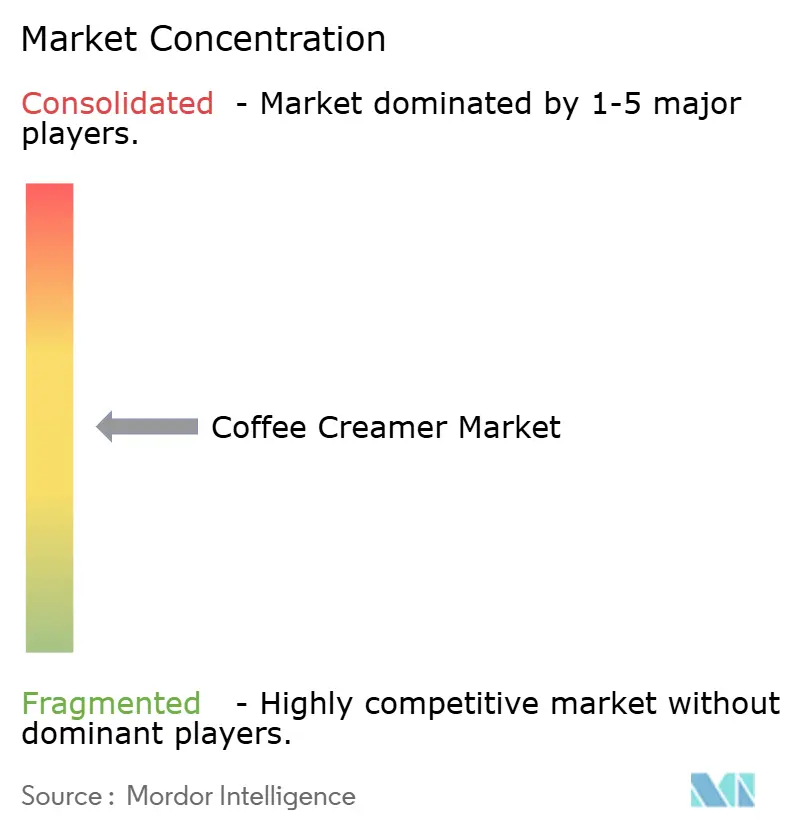
The coffee creamer market is moderately concentrated. Global giants like Nestlé, Danone, Kerry Group, FrieslandCampina, and Unilever leverage extensive procurement networks, substantial research and development budgets, and diverse distribution channels to secure their shelf space. In contrast, nimble challengers such as Califia Farms, nutpods, Oatly, and Laird Superfood command premium prices by emphasizing plant-based purity, functional ingredients, and transparent sourcing. The rise of private-label products intensifies price competition, especially in the off-trade segment. Major U.S. grocery chains and European discounters, capitalizing on their scale, often undercut branded products by 15%-20%.
Strategic clusters unveil unique approaches. To mitigate input volatility, Danone and FrieslandCampina have turned to vertical integration, investing in upstream dairy cooperatives and oilseed processing for stable supplies. Kerry Group adopts a different route, forming innovation partnerships with flavor houses and biotech firms to expedite the development of taste-masking systems, especially for adaptogen-fortified products. Brand-licensing deals, like Nestlé’s collaboration with Starbucks and Danone’s with Dunkin’, boost visibility without compromising brand identity. Direct-to-consumer brands refine their flavors online, using consumer data to eliminate under-performing products before they hit retail, thus minimizing slotting-fee risks.
Technological advancements play a pivotal role in competitive differentiation. FrieslandCampina’s pilot of RFID dispensers in Dutch corporate offices cut single-use packaging by 40%, a move that not only aligns with ESG goals but also reduces costs per cup. Laird Superfood’s microencapsulation of mushroom extracts bridges the gap between functional claims and sensory satisfaction. Nestlé’s Coffee-Mate, by substituting sugar with allulose and monk fruit, preempts potential regulatory challenges, positioning itself advantageously in a market wary of sugar. While market-share fluctuations are evident in the plant-based segment due to shifting consumer loyalties, influencer marketing and social commerce have enabled niche brands to secure national shelf space in just two years. Looking ahead, while established players merging sustainability with sensory appeal may hold their ground, innovative concepts like refill stations, regenerative-agriculture sourcing, and microbiome-friendly probiotics are set to shake up the rankings.
Coffee Creamer Industry Leaders
-
Nestle S.A
-
Danone S.A
-
Leaner Creamer
-
Heartland Food Products Group
-
Calfia Farms
- *Disclaimer: Major Players sorted in no particular order
Coffee Creamer Market Companies Covered in this Report
- Nestlé S.A.
- Danone S.A.
- Kerry Group plc
- FrieslandCampina Kievit B.V.
- Heartland Food Products Group
- Califia Farms LLC
- Laird Superfood Inc.
- nutpods (Pearl Rock)
- Land O'Lakes Inc.
- HP Hood LLC
- Dean Foods Co.
- TreeHouse Foods Inc. / Bay Valley Foods
- PT Santos Premium Krimer
- Custom Food Group
- FrieslandCampina DOMO (foaming)
- Meggle GmbH
- Suzhou Jiahe Foods Industry
- Wenhui Food Industry Co. Ltd.
- Super Group Ltd.
- Oatly AB

Market Opportunities and Future Outlook
Clean-label reformulation and sugar-reduction toolkits create room for both plant-based and dairy players to premiumize while meeting tightening nutrition and labeling scrutiny. That is reflected in recent product moves. Califia Farms expanded its Simple and Organic creamer range in January 2026 with new flavors and updated core recipes, positioning the line around removing gums and oils as an ingredient-minimality differentiator in refrigerated cases and online assortments. On the dairy side, reduced-sugar positioning is already being commercialized, including Danone North America launching Too Good and Co refrigerated creamers in November 2025 with a reduced-sugar message, which supports broader portfolio renovation across flavored creamers as regulators and retailers keep added sugar under focus.
Supply-chain and sustainability programs are also becoming commercial levers, especially for brands selling into retailers and foodservice accounts with ESG scorecards. Danone reported 42% of key ingredients sourced from farms transitioning to regenerative agriculture in 2025, and it expanded farm-level assessment coverage in 2026. Nestle also amplified its regenerative agriculture commitments through dairy-focused program disclosures, signaling tighter procurement standards that can cascade to creamer inputs such as dairy, oils, and sweeteners. These efforts create opportunities for ingredient suppliers and co-manufacturers that can document traceability, lower-impact oils, and verified farm practices. Packaging and manufacturing improvements, including Califia Farms emphasis on circular packaging models and zero-waste manufacturing at its Bakersfield, California facility, further support differentiated positioning in premium plant-based liquid creamers, where cold-chain distribution costs increase the value of these claims.
Recent Industry Developments in Coffee Creamer Market
- May 2026: Heartland Food Products Group entered a definitive agreement to acquire the Americas business of Whole Earth Brands, Inc., including Equal, Whole Earth, Swerve, and Chuker brands. The deal expands Heartland's sweetener and creamer portfolio and adds manufacturing capabilities for sugar-reduction offerings. The acquisition also broadens market reach and supports scale in core categories.
- January 2026: Califia Farms launched new Simple & Organic creamer flavors, Sweet Crème and Salted Caramel, and updated core recipes to remove gums and oils. The refresh reinforces clean-label and premium positioning in plant-based creamers. It also broadens appeal across health-conscious and premium segments.
- December 2025: Danone North America International Delight partnered with Paris Hilton to release a limited-edition coffee creamer and cold foam collection. The collaboration supports premium branding through an influencer-backed line extension. It is aimed at seasonal gifting windows and reinforces lifestyle-oriented product positioning.


Coffee Creamer Market Report Scope and Research Methodology
Market Definition and Coverage
For this study, the market covers retail and foodservice sales of coffee creamer products used to lighten or flavor coffee, counted in value terms at end-customer selling prices across major geographies.
Scope exclusions: We exclude plain dairy milk and non-coffee beverage whiteners that are not marketed or used primarily as coffee creamer.
Segments Covered in This Report
-
By Type
-
Powder Coffee Creamer
- Dairy-based Powder
- Non-dairy Powder
-
Liquid Coffee Creamer
- Dairy-based Powder
- Non-dairy Powder
-
Powder Coffee Creamer
-
By Flavor
- Unflavored
-
Flavored
- Vanilla
- Hazelnut
- Caramel
- Chocolate
- Others
-
By Distribution Channel
- On-trade
-
Off-trade
- Supermarkets/Hypermarkets
- Convenience/Grocery Stores
- Online Retail Stores
- Other Off-trade channels
-
By Geography
-
North America
- United States
- Canada
- Mexico
- Rest of North America
-
Europe
- Germany
- United Kingdom
- France
- Italy
- Spain
- Russia
- Netherlands
- Poland
- Belgium
- Sweden
- Rest of Europe
-
Asia-Pacific
- China
- India
- Japan
- South Korea
- Australia
- Indonesia
- Thailand
- Singapore
- Rest of Asia-Pacific
-
South America
- Brazil
- Argentina
- Colombia
- Chile
- Peru
- Rest of South America
-
Middle East and Africa
- Saudi Arabia
- United Arab Emirates
- Nigeria
- Egypt
- Morocco
- Turkey
- South Africa
- Rest of Middle East and Africa
-
North America
Data Sources, Market Sizing, and Validation
Desk Research
Desk work started with mapping the product forms and where they sell, and then collecting the signals that explain demand and pricing. Public sources, such as USDA and ERS dairy and fat statistics, FAOSTAT supply trends, UN Comtrade trade flows for key dairy and vegetable fat inputs, and FDA labeling guidance, helped us keep assumptions anchored to real-world movements.
We also reviewed company annual reports, earnings call notes, product labeling images, and reputable press to understand how mix shifts happen across formats like powdered and liquid, and across channels like grocery and online. Where it was helpful, we referenced paid subscriptions for company financials and intelligence, news and financials, and shipment-level import and export records to cross-check timing and magnitude of changes. These are illustrative examples, and many other sources were also used for data collection, validation, and clarification during the research.
Primary Interviews and Surveys
Primary work focused on validating what drives creamer volume, pricing, and mix in each region, especially when public data was too broad to isolate creamers from nearby categories. We spoke with a spread of respondents across manufacturing, brand and category roles, ingredient supply, and distribution, and then re-checked assumptions with regional experts across APAC, EMEA, and the Americas.
Distribution of primary research fieldwork respondents
| Company type | Respondent position | Region |
|---|---|---|
| Top tier: 38% | CXOs: 12% | APAC: 46% |
| Mid tier: 48% | Functional/Unit leaders: 37% | EMEA: 35% |
| Smaller Players: 14% | Managers: 51% | Americas: 19% |
Market-Sizing & Forecasting
Sizing used a top-down and bottom-up mix, with the main build starting from region-level consumption pools and then narrowing to coffee creamer based on product presence, channel participation, and observed category penetration. To keep the totals realistic, the model was corroborated with selective bottom-up checks like sampled price per unit by format, retailer shelf and listing scans, and supplier and distributor channel checks, which helped adjust for under-counting in emerging online formats.
Key inputs that shaped the math included household at-home coffee preparation trends, foodservice recovery patterns, dairy fat and vegetable fat cost movements, sugar and sweetener positioning, and format mix shifts between liquid, powder, and newer cold-foam style offerings. Forecasts were built using scenario analysis supported by expert views on how price normalization and premiumization may play out, followed by smoothing of short-term volatility in input costs so the forward curve does not overreact to one season. When bottom-up details were missing in smaller countries, we filled gaps using proxy indicators like modern retail share, coffee consumption direction, and import reliance, and then re-tested the outcome through primary feedback.
Data Validation & Update Cycle
Validation was done through multiple checks, starting with comparing model outputs against independent signals such as ingredient cost direction, packaged food inflation, and channel growth patterns in each geography. Outliers were reviewed by analysts, and if a variance could not be explained by mix, pricing, or a one-time event, assumptions were revisited and targeted re-contacts were triggered.
Before sign-off, a second analyst review was completed so the calculations and scope logic can be followed step by step. The report is refreshed annually, and interim updates are made when material events change demand or pricing expectations. Right before delivery, we perform a final pass to ensure the numbers reflect the most recent data releases and market developments.
Mordor Intelligence's Coffee Creamer Market Estimate Compared With Other Published Estimates
It is normal to see different market sizes for coffee creamer because publishers do not always count the same products, channels, and pricing points. Gaps also show up when one estimate leans more on a demand build-up, while another leans more on company revenue splits or a narrow region set.
In coffee creamer, the biggest differences usually come from whether powdered and liquid formats are both counted fully, how private label and foodservice volumes are treated, and whether value is measured at retail selling price or closer to manufacturer realization. Some estimates also stretch the category to include adjacent whiteners or coffee mix products, and that can lift totals quickly. Keeping the definition tied to end-use in coffee, and then checking the volume and price logic against ingredient cost signals and channel mix, explains why the 2026 value lands where it does, a modeling choice applied by Mordor Intelligence.
Benchmark comparison
| Source | Market Size | Gaps in Research Methodology |
|---|---|---|
| Mordor Intelligence | USD 7.97 B (2026) | |
| Global Consultancy A | USD 8.60 B (2026) | Uses a wider product net that appears to fold in coffee whitener and some instant coffee mix type sales, and it applies higher average prices without clear channel-level checks. |
| Industry Association B | USD 7.10 B (2026) | Leans on reported shipments from a limited set of members, which can miss private label, smaller regional brands, and parts of online, thereby understating value in fast-growing markets. |
The spread across published numbers mainly traces back to scope and pricing logic, not just the forecast curve. When the counted products stay tightly linked to coffee use, and when retail and foodservice are treated with consistent price points by format, the result becomes easier to reconcile with real demand signals. Our approach keeps the steps repeatable, so clients can see which assumptions move the total and why.


Key Questions Answered in the Report
How large is the coffee creamer market in 2026 and how fast will it grow?
The coffee creamer market size is USD 7.97 billion in 2026 and is projected to post a 6.2% CAGR, reaching USD 10.77 billion by 2031.
Which product type dominates global sales?
Liquid formats lead with a 62.55% 2025 share because consumers favor their ready-to-use convenience and café-style texture.
What region is expected to grow quickest through 2031?
Asia-Pacific shows the fastest trajectory with a 6.98% CAGR, supported by rising coffee adoption in China, India, and Southeast Asia.
How are regulations shaping product reformulation?
FDA front-of-package icons and updated “healthy” definitions drive sugar and saturated-fat reductions, favoring plant-based formulas using low-fat oils.
Page last updated on:


 Your data is secure and never sold or shared.


