
Market Overview
| Study Period | 2021 - 2031 |
|---|---|
| Market Size (2026) | USD 5.06 Billion |
| Market Size (2031) | USD 6.70 Billion |
| Growth Rate (2026 - 2031) | 5.76 % |
| Fastest Growing Market | Asia Pacific |
| Largest Market | North America |
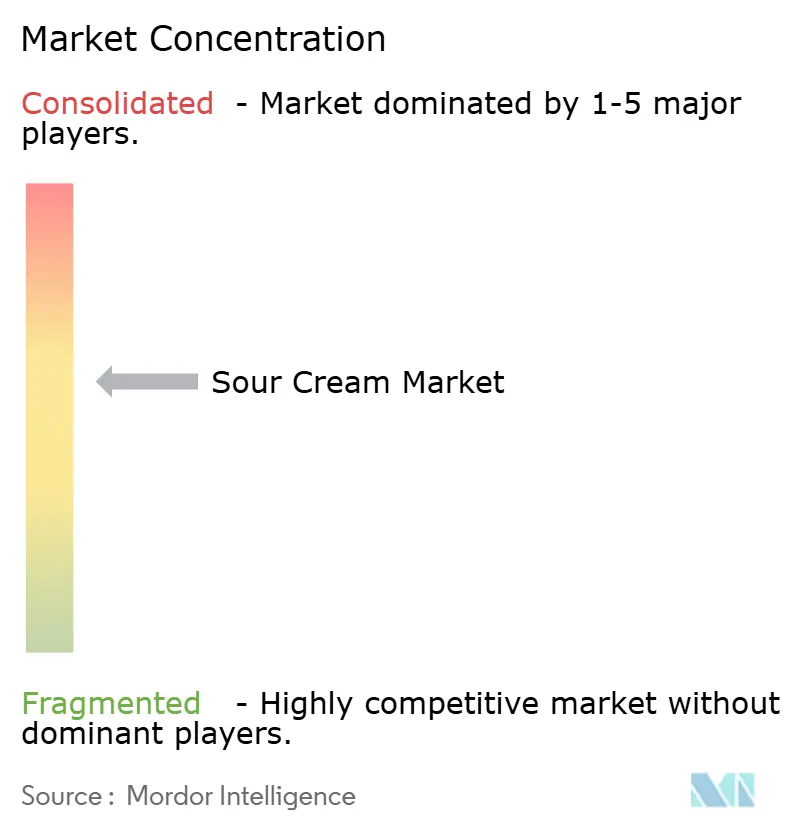
| Market Concentration | Medium |
Major Players *Disclaimer: Major Players sorted in no particular order Image © Mordor Intelligence. Reuse requires attribution under CC BY 4.0. | |
Sour Cream Market Analysis by Mordor Intelligence
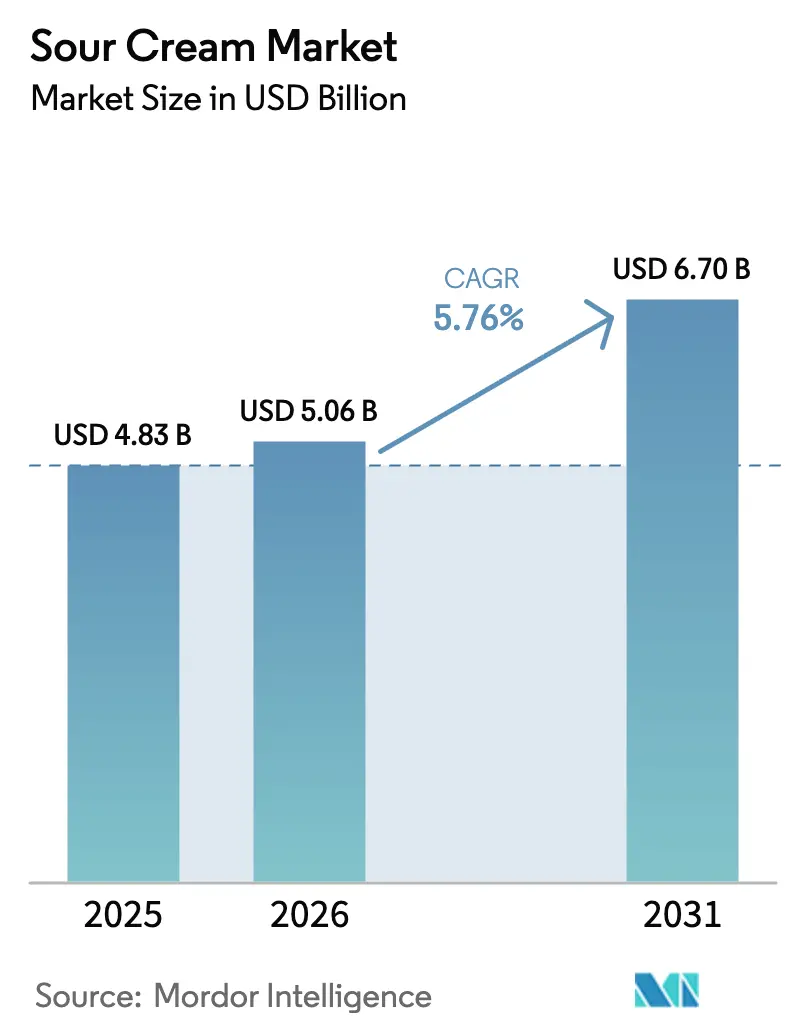
The Sour Cream Market size is projected to expand from USD 4.83 billion in 2025 and USD 5.06 billion in 2026 to USD 6.70 billion by 2031, registering a compound annual growth rate (CAGR) of 5.76% between 2026 to 2031. This growth is driven by increasing demand from food-service operators, the introduction of premium organic products, and the expansion of lactose-free options, which elevate sour cream beyond its traditional role as a commodity dairy product. Innovations in packaging, such as squeezable pouches, flavored varieties, and ambient-stable UHT cream, enhance convenience, while the diversification of applications into dips, toppings, and prepared meals broadens its usage. Competitive strategies emphasize vertical integration and selective consolidation, as demonstrated by Lactalis’ acquisition of Fonterra’s consumer businesses in 2025 and Chobani’s capacity expansion in New York the same year. Additionally, significant investments in Asia-Pacific food-service channels and growing demand for premium organic products in Europe offer substantial opportunities for both dairy and plant-based suppliers.
Key Report Takeaways
- By product type, dairy-based SKUs secured 75.55% of the global sour cream market share in 2025, while non-dairy alternatives are forecast to grow at a 6.63% CAGR through 2031.
- By nature, the organic segment accounted for 29.68% of 2025 revenue and is projected to accelerate at a 6.83% CAGR to 2031.
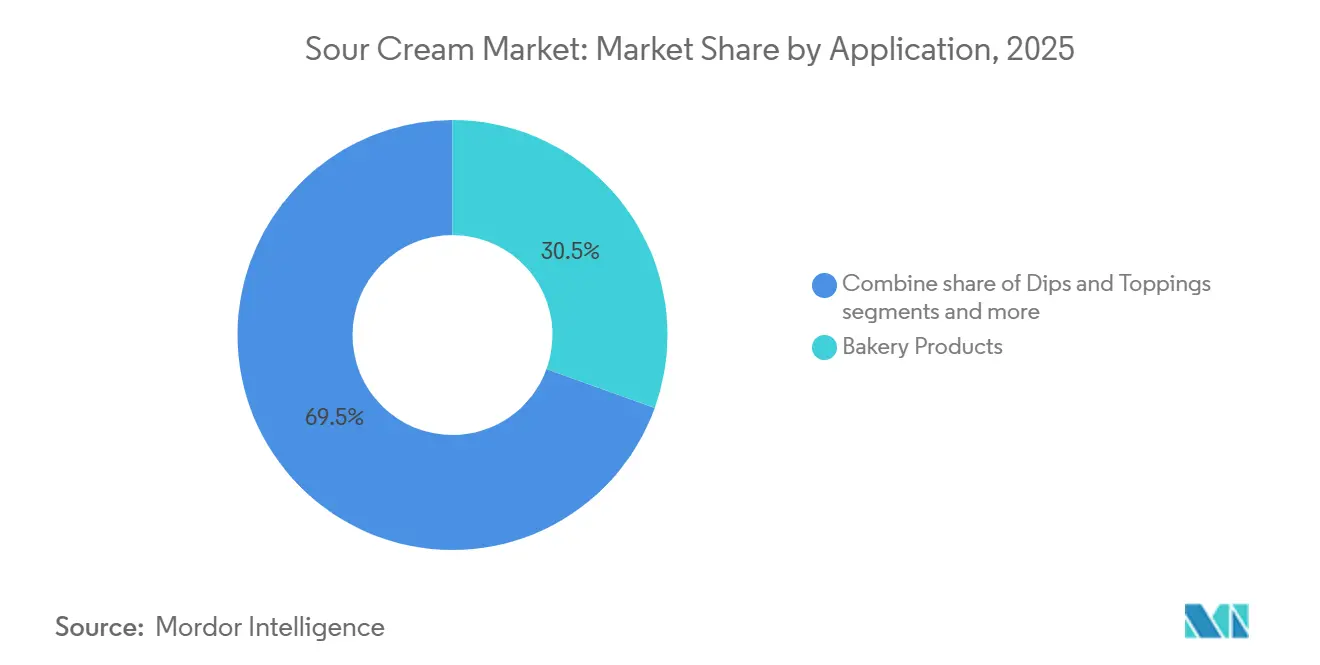
- By application, dips and toppings are expanding at a 6.82% CAGR, overtaking bakery products that held 30.54% value in 2025.
- By distribution channel, food-service recorded the fastest growth at 6.54% annually, despite retail retaining 86.77% of 2025 value.
Note: Market size and forecast figures in this report are generated using Mordor Intelligence’s proprietary estimation framework, updated with the latest available data and insights as of January 2026.
Market Trends and Insights
Drivers Impact Analysis of Sour Cream Market*
| Driver | (~) % Impact on CAGR Forecast | Geographic Relevance | Impact Timeline |
|---|---|---|---|
| Growth of global cuisines that use sour cream | +0.8% | Global, with concentration in North America, Europe, and urban Asia-Pacific | Medium term (2-4 years) |
| Growing demand for organic and clean-label sour cream | +1.2% | North America and Europe, emerging in Asia-Pacific premium segments | Long term (≥ 4 years) |
| Innovation in flavored sour cream | +0.7% | North America and Europe, selective adoption in Asia-Pacific | Short term (≤ 2 years) |
| Development of low-fat and reduced-calorie variants | +0.6% | Global, led by health-conscious markets in North America and Europe | Medium term (2-4 years) |
| Rising consumer preference for convenient dairy products | +0.5% | Global, strongest in North America and urban Asia-Pacific | Short term (≤ 2 years) |
| Emergence of lactose-free sour cream options | +0.9% | Global, particularly North America, Europe, and lactose-intolerant populations in Asia | Medium term (2-4 years) |
| Source: Mordor Intelligence | |||
Growth of global cuisines that use sour cream
Mexican and Eastern European culinary formats are increasingly becoming part of mainstream foodservice, leading to a rise in sour cream consumption across quick-service restaurants, casual dining establishments, and home meal replacement options. In 2024, the United States exported USD 2.4 billion worth of dairy products to Mexico, meeting 75% of Mexico's dairy needs. This demonstrates the strong cross-border supply chain integration that supports popular North American dishes such as tacos, burritos, and enchiladas. In September 2024, Fonterra opened its sixth application center in Wuhan, China, to collaborate on the development of sour cream and cream-based applications for bakery, dining, and beverage channels. This initiative highlights the growing interest of multinational dairy processors in the Asia-Pacific region, which is emerging as a key market for Western condiments. The shift toward dairy-rich recipes is particularly noticeable in urban areas, where rising disposable incomes and greater exposure to global media are driving changes in consumer preferences. Restaurants are also modifying traditional dishes to incorporate sour cream as a flavor enhancer and texture modifier. This adaptation is creating additional demand for sour cream that bypasses traditional retail channels entirely.
Growing demand for organic and clean-label sour cream
Organic dairy sales in the United States have grown by approximately 5% year-over-year, with yogurt and cultured dairy achieving 10.5% growth, the highest among all organic categories [1]Source: Organic Trade Association, “U.S. Organic Sales Reach USD 71.6 Billion in 2024,” ota.com. This positive trend is also influencing the sour cream segment, as consumers increasingly pay attention to ingredient lists and avoid additives such as modified starches, gums, and synthetic stabilizers. In March 2024, Good Culture introduced an organic sour cream, positioning it as a probiotic-rich alternative to conventional options. Vermont Creamery also launched a 22% milkfat premium sour cream with flavors such as Cilantro Lime and Fire Roasted Onion and Chive, aimed at specialty retailers and gourmet foodservice providers. Certification under United States Department of Agriculture (USDA) organic standards and third-party clean-label programs, such as Non-GMO Project Verified, is becoming a critical requirement for securing premium shelf placement, especially in natural-foods chains. This shift is also impacting supply chains, as processors need to source milk from certified organic farms that adhere to pasture-access and antibiotic-free protocols. These requirements often lead to a 30% to 40% price premium compared to conventional milk.
Innovation in flavored sour cream
Flavored sour cream options are evolving beyond traditional varieties like chive and onion to include globally inspired flavors such as chipotle, harissa, and miso, reflecting growing consumer interest in convenience and culinary exploration. Vermont Creamery has introduced a premium flavored sour cream line with a 22% milkfat base, specifically designed for charcuterie boards and upscale entertaining. This innovation positions sour cream as a standalone condiment rather than a traditional cooking ingredient. In 2024, Daisy Brand launched a line of sour cream dips that blend sour cream with vegetable purees and spices, aiming to compete with popular refrigerated dip options like hummus and guacamole. These flavored products are priced 20 to 30% higher than plain sour cream, thereby improving per-unit profit margins for manufacturers and retailers. Furthermore, foodservice operators are increasingly adopting flavored sour cream to simplify kitchen operations, as pre-seasoned products eliminate the need for staff to mix ingredients during busy service hours. This trend is particularly advanced in North America and Europe, where rapid flavor innovation cycles and seasonal limited-edition offerings are supported by retailers dedicating shelf space to these products.
Development of low-fat and reduced-calorie variants
Health-conscious consumers are increasingly driving demand for sour cream with reduced fat and calorie content, prompting manufacturers to reformulate products using protein concentrates, fiber, and fermentation techniques to maintain texture without added fat. In 2024, Cabot Creamery, HP Hood, and FAGE introduced low-fat and light sour cream variants targeting the weight-management and heart-health segments. These products typically contain 40 to 50 percent less fat than full-fat sour cream by replacing milkfat with whey protein isolate or inulin. However, some formulations compromise the tangy flavor profile that is characteristic of traditional sour cream. The United States Food and Drug Administration (FDA) defines "light" dairy products as those requiring at least a 50 percent reduction in fat or calories, establishing a regulatory baseline that limits formulation flexibility. Retail sales data from 2023 indicated that light sour cream accounted for approximately 18 percent of total sour cream volume in the United States, a share that has remained stable as consumers balance health objectives with taste preferences [2]Source: U.S. Department of Agriculture, “Dairy Data,” fda.gov. This segment is also attracting private-label brands, as retailers aim to provide affordable, health-oriented alternatives that compete with branded products on price.
Restraints Impact Analysis of Sour Cream Market*
| Restraint | (~) % Impact on CAGR Forecast | Geographic Relevance | Impact Timeline |
|---|---|---|---|
| Health concerns over saturated fat and calorie content | -0.6% | Global, most pronounced in North America and Europe | Long term (≥ 4 years) |
| Stringent food-safety and labeling regulations | -0.4% | Global, led by North America and Europe with compliance spillover to Asia-Pacific | Medium term (2-4 years) |
| High prevalence of lactose intolerance and dairy allergies | -0.5% | Global, highest impact in Asia-Pacific and among ethnic minorities in North America | Long term (≥ 4 years) |
| Risk of product recalls due to contamination | -0.3% | Global, acute in North America due to heightened regulatory enforcement | Short term (≤ 2 years) |
| Source: Mordor Intelligence | |||
Health concerns over saturated fat and calorie content
Nutritional guidelines from the American Heart Association (AHA) and the World Health Organization (WHO) recommend limiting saturated fat intake to less than 10% of total daily calories. This categorizes full-fat sour cream as a discretionary food, which competes less favorably with lower-fat alternatives such as Greek yogurt and plant-based sour cream. A standard 2-tablespoon serving of full-fat sour cream contains approximately 5 grams of saturated fat and 60 calories. These figures often lead to cautionary labels on nutrition-tracking applications and discourage regular consumption among consumers who are conscious about their weight. Kraft Heinz, in its 2024 10-K filing, reported volume declines in North American dairy categories, including sour cream, partly due to changing consumer preferences toward lower-calorie and plant-based options. The company's second-quarter 2025 results highlighted a decline in volume and mix, which was influenced by pricing actions and competitive pressure from private-label and alternative-dairy brands. Manufacturers are responding to these challenges by introducing reduced-fat variants and fortifying products with protein and probiotics to address negative health perceptions. However, these efforts have not yet succeeded in reversing the category-wide volume decline in mature markets.
Stringent food-safety and labeling regulations
The Rizo Lopez Foods recall in February 2024, which involved sour cream and other dairy products linked to a multi-state Listeria monocytogenes outbreak, resulted in over 20 hospitalizations and increased scrutiny from the United States Food and Drug Administration [3]Source: U.S. Food & Drug Administration, “Major Product Recalls,” fda.gov. This incident highlighted ongoing challenges in managing Listeria within dairy processing environments, as the pathogen can form biofilms on equipment surfaces and resist routine sanitation measures. In the European Union, Regulation 853/2004 requires dairy processors to implement Hazard Analysis and Critical Control Points (HACCP) systems and ensure traceability from farm to retail, while Regulation 852/2004 establishes hygiene standards for food businesses. The European Food Safety Authority's 2024 guidance on Listeria persistence in food-processing facilities is encouraging processors to adopt advanced sanitation technologies, such as ultraviolet light, ozone treatment, and enzyme-based cleaning agents. These measures are expected to increase capital expenditure by an estimated 15 to 20 percent for mid-sized facilities. Compliance costs are particularly challenging for smaller cooperatives and regional processors, which is driving consolidation in the industry. Larger companies are utilizing centralized quality-assurance systems to distribute fixed costs across higher production volumes, providing them with a competitive advantage in meeting regulatory and operational requirements.
*Our forecasts treat driver/restraint impacts as directional, not additive. The impact forecasts reflect baseline growth, mix effects, and variable interactions.
Sour Cream Market Segment Analysis
By Product Type:
Non-Dairy Alternatives Gain TractionDairy-based sour cream accounted for 75.55% of the market share in 2025, highlighting its strong presence in North American and European culinary traditions. However, non-dairy alternatives are growing at a compound annual growth rate (CAGR) of 6.63% through 2031, driven by increasing consumer preferences for lactose-free, allergy-friendly, and plant-based diets. Products such as Elmhurst's cashew-based sour cream, launched in January 2024, and Chobani's Savor line of oat-based sour cream alternatives are targeting flexitarian households aiming to reduce animal-product consumption while maintaining taste and texture.
Dairy sour cream benefits from established supply chains, cost efficiencies in milk procurement, and strong consumer familiarity. However, it faces challenges such as margin pressures from fluctuating milk prices and competition from Greek yogurt, which offers similar culinary applications with lower saturated fat content. Non-dairy sour cream, on the other hand, carries a 30% to 40% price premium over traditional dairy sour cream, which limits its adoption in price-sensitive segments. Despite this, distribution is expanding through natural-foods retailers and online grocery platforms. Fonterra's strategic decision in May 2024 to focus on foodservice ingredients and reduce its emphasis on consumer-packaged dairy products reflects a broader trend among large-scale players. This shift aims to capture higher-margin opportunities in business-to-business channels rather than competing in the increasingly commoditized retail dairy market.



By Nature:
Organic Segment Commands Premium PositioningConventional sour cream accounted for 70.32% of the market share in 2025, driven by its cost competitiveness and widespread availability across mass-market retailers. However, organic sour cream is projected to grow at a Compound Annual Growth Rate (CAGR) of 6.83% through 2031, the fastest growth rate among all segmentation types, as consumers increasingly prioritize clean-label attributes and animal welfare. Organic dairy sales in the United States have experienced significant growth, the highest among all organic categories, highlighting the rising demand for certified organic products. Good Culture's planned launch of organic sour cream in March 2024 aims to offer a probiotic-rich alternative to conventional options, targeting health-conscious consumers willing to pay a 40 to 50% premium for products with United States Department of Agriculture (USDA) organic certification and Non-GMO Project verification.
Conventional sour cream benefits from economies of scale in milk procurement and processing. However, it faces challenges from private-label competition and margin compression as retailers focus on low-price strategies to compete with discount chains. In contrast, organic sour cream commands higher per-unit margins and attracts brand-loyal consumers who associate organic certification with quality and sustainability. This positioning helps insulate manufacturers of organic sour cream from price-based competition.
By Application:
Dips and Toppings Outpace Traditional BakingBakery products accounted for 30.54% of the application volume in 2025, emphasizing sour cream's established role as a moisture and texture enhancer in cakes, muffins, and quick breads. At the same time, dips and toppings are expected to grow at a compound annual growth rate (CAGR) of 6.82% through 2031, driven by the increasing popularity of Mexican and Eastern European cuisines in casual dining and home cooking. A recipe for chocolate doughnut muffins published by The New York Times in March 2024 specifies 220 grams of sour cream per 12 muffins, showcasing its functional role in baked goods by providing acidity to activate leavening agents and fat to tenderize gluten.
Dips and toppings are also benefiting from the growing prevalence of snacking occasions and the widespread acceptance of sour cream as a condiment for tacos, nachos, baked potatoes, and grilled meats. This trend is particularly evident in quick-service restaurants, where portion-controlled packets help reduce labor costs and minimize food waste. In 2024, Daisy Brand introduced sour cream dips that combine sour cream with vegetable purees and spices, aiming to compete with hummus and guacamole in the refrigerated dip aisle. These products are designed to appeal to households that prioritize convenience over preparing dips from scratch.

By Distribution Channel:
Foodservice Gains as Restaurants Expand MenusRetail distribution accounted for 86.77% of the volume in 2025, emphasizing sour cream's importance as a household staple in North America and Europe. Meanwhile, the foodservice segment is expanding at a compound annual growth rate (CAGR) of 6.54% through 2031, driven by quick-service restaurants, casual dining chains, and institutional caterers incorporating sour cream into dips, toppings, and batter formulations. Chobani's USD 1.2 billion investment in a dairy processing plant in Rome, New York, announced in April 2025, aims to produce over 1 billion pounds of dairy products annually. The facility includes capacity for up to 28 production lines designed for diverse packaging formats, reflecting the industry's shift toward greater flexibility in foodservice offerings.
Fonterra's USD 150 million investment to construct a new ultra-high temperature (UHT) cream plant in Edendale, with groundbreaking in December 2024 and production expected to begin in August 2026, specifically targets foodservice growth in China and Southeast Asia. This growth is supported by rising disposable incomes and the increasing adoption of Western culinary practices, which are driving demand for cream-based ingredients. Within the retail segment, supermarkets and hypermarkets continue to dominate, although online retail stores are gaining traction as e-commerce penetration increases and consumers prioritize home delivery for refrigerated products.
Geography Analysis
North America Sour Cream Market
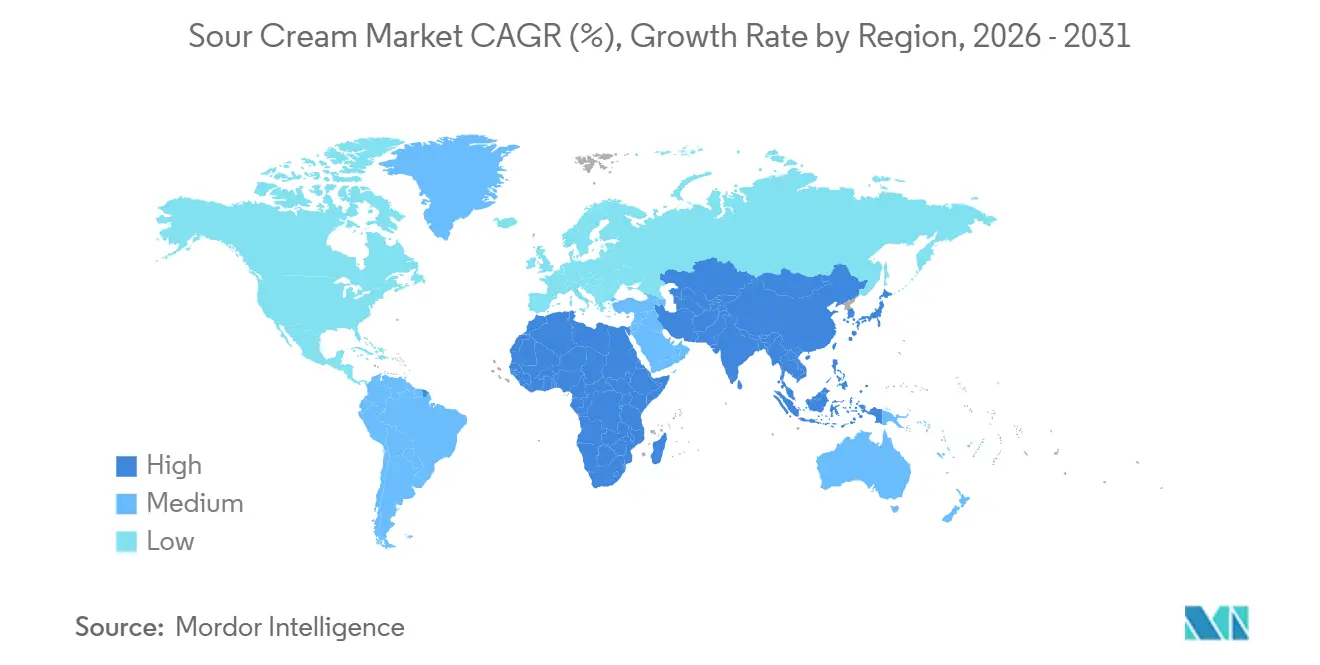
North America held 32.54% of the market share in 2025, with the United States leading the region. Sour cream sales in the United States reached USD 1.7 billion in 2023, marking a 13.6% year-over-year growth. This growth was fueled by strong demand for cultured dairy products and the increasing popularity of Mexican cuisine in quick-service restaurants and home cooking. Daisy Brand captured approximately 60% of the United States market in 2023, reflecting moderate market concentration and the dominance of a single large-scale player that benefits from cost leadership and extensive retail distribution. Canada and Mexico contributed smaller shares, with Mexico's dairy imports reaching USD 2.4 billion in 2024. The United States supplied 75% of this volume, highlighting cross-border supply integration that supports taco, burrito, and enchilada formats in North American food chains.
APAC Sour Cream Market
The Asia-Pacific region is expected to grow at the fastest rate, with a compound annual growth rate (CAGR) of 6.62% projected through 2031. This growth is driven by rising disposable incomes, urbanization, and the increasing adoption of Western culinary formats in foodservice channels. India is forecast to produce 216.5 million metric tons of milk in 2025, making it the world's largest milk producer. However, sour cream penetration in India remains low due to limited cold-chain infrastructure and cultural preferences for fresh milk and paneer. In September 2024, Fonterra opened its sixth application center in Wuhan, China, to co-develop sour cream and cream-based applications for bakery, dining, and beverage channels. This development underscores the strategic importance of China for multinational dairy processors.
Europe Sour Cream Market
Europe is the second-largest region, characterized by stringent food safety regulations and strong demand for organic and clean-label sour cream, particularly in Germany, the United Kingdom, France, and the Netherlands. European Union Regulations 853/2004 and 852/2004 require the implementation of Hazard Analysis and Critical Control Points (HACCP) systems and traceability from farm to retail, increasing compliance costs for processors and driving market consolidation. Valio invested over EUR 60 million (USD 64.8 million) in cheese production at its Lapinlahti plant in Finland, with construction starting in summer 2024 and commissioning expected by spring 2026. This investment reflects the region's focus on expanding production capacity and improving energy efficiency.

Regulatory Landscape
Sour cream formulation and labeling are shaped by standards of identity and dairy labeling rules in major consuming markets. In the United States, FDA standards of identity set minimum compositional requirements for sour cream, including at least 18% milkfat (or at least 14.4% when sweeteners or bulky flavorings are used) and a minimum 0.5% titratable acidity calculated as lactic acid, constraining reformulation for light, flavored, or stabilized SKUs. USDA sour cream specifications also set temperature handling expectations for inspected product, for example holding at 45 degrees F / 7.2 degrees C or less prior to inspection, reinforcing cold-chain discipline for manufacturers supplying regulated channels.
Food safety and traceability obligations continue to tighten for cultured dairy processing and cross-border trade. In the European Union, Regulation (EC) 852/2004 and 853/2004 require hygiene controls and HACCP-based systems, while import conditions for dairy depend on health certification and specified heat treatments (pasteurization, HTST, UHT) tied to exporting-country animal health status, which affects sourcing strategies for multinational suppliers. Canada requires dairy products to declare milk fat percentage (and in specific cases moisture) on the principal display panel using prescribed conventions (for example, M.F.), adding label-content and verification needs across SKUs. For global brands operating in the United States, the FDA uniform compliance date policy for food labeling regulations published from January 1, 2025, through December 31, 2026 sets a common implementation date of January 1, 2028.
Value Chain Analysis
The sour cream value chain begins with raw milk and cream procurement, often via cooperatives or integrated dairy processors, then moves through standardization, pasteurization, culture inoculation, fermentation or incubation, cooling, and packaging into tubs, cups, squeezable pouches, or portion-control formats. Key inputs include cream, lactic acid starter cultures, and stabilizers (where used) such as locust bean gum, with quality control focused on fat, acidity, texture, and microbiological performance. Because sour cream is time and temperature controlled, the chain depends on uninterrupted refrigerated storage and transport from plant to distributor and onward to retail and foodservice, making cold-chain integrity a primary determinant of shelf life and recall risk.
Downstream, retail remains the largest outlet by volume, while foodservice procurement emphasizes pack formats, portion control, and dependable supply continuity for high-throughput kitchens. Scale and automation at processing sites can shift bargaining power toward vertically integrated operators that can secure milk supply, standardize cultures, and run multi-line packaging with consistent QA, aligning with industry moves toward larger flexible plants such as Chobani's announced Rome, New York facility (2025) designed for diverse packaging formats. International trade can supplement local supply where cold-chain and import protocols permit, while processors investing in UHT or aseptic cream capabilities, including Fonterra's Edendale UHT cream plant project, extend the ingredient supply base for foodservice applications that use cultured dairy components.
Competitive Landscape
The global sour cream market exhibits moderate concentration, characterized by a competitive landscape. Leading companies, such as Daisy Brand, accounted for approximately 60% of the United States market in 2023, alongside regional cooperatives, private-label brands, and emerging plant-based competitors. The Lactalis Group's acquisition of Fonterra's consumer businesses for New Zealand Dollar (NZD) 3.845 billion (USD 2.27 billion) in August 2025 underscores ongoing consolidation in Oceania and Asia. Meanwhile, Danone's divestiture of Horizon Organic and Wallaby in April 2024 reflects a strategic shift away from lower-margin retail brands to prioritize foodservice ingredients.
Key strategies in the market include vertical integration, where major players manage milk sourcing, pasteurization, and distribution to capture margins across the value chain. Additionally, manufacturers are driving innovation by introducing products such as squeezable pouches, portion-control packets, and flavored variants to stand out in a commoditized category. Opportunities for growth are evident in lactose-free and plant-based sour cream in the Asia-Pacific region, where lactose intolerance affects over 90% of some populations. Similarly, premium organic sour cream is gaining traction in Europe, driven by clean-label mandates and growing concerns about animal welfare.
Technological advancements are playing a significant role in shaping the market. Fonterra's investment in Ultra-High Temperature (UHT) cream processing and aseptic packaging enables ambient storage and extended shelf life, reducing cold-chain costs for distributors and foodservice operators. In addition, Chobani's USD 1.2 billion investment in a dairy processing plant in Rome, New York, designed to produce over 1 billion pounds of dairy products annually and accommodate up to 28 production lines, reflects the industry's shift toward flexible manufacturing systems capable of handling diverse packaging formats and product formulations.
Sour Cream Industry Leaders
Daisy Brand LLC
Cabot Creamery Cooperative
The Kraft Heinz Company
Danone S.A.
Nestlé S.A.
- *Disclaimer: Major Players sorted in no particular order
Sour Cream Market Companies Covered in this Report
- Daisy Brand LLC
- Cabot Creamery Cooperative
- The Kraft Heinz Company
- Danone S.A.
- Nestlé S.A.
- Fonterra Co-operative Group Ltd
- Dean Foods
- HP Hood LLC
- Lactalis Group
- Saputo Inc.
- Prairie Farms Dairy
- Organic Valley
- Laiterie Chalifoux
- Green Valley Creamery
- Agropur Dairy Cooperative
- Dairy Farmers of America
- Meiji Holdings Co.
- Valio Ltd.
- Redwood Hill Farm & Creamery
- Uelzena Ingredients

Market Opportunities and Future Outlook
Premiumization and differentiation continue to center on organic, clean-label, and functional positioning, where certification and ingredient transparency support price premiums and shelf placement. USDA organic and third-party verification programs such as Non-GMO Project Verified function as commercial gatekeepers in natural and specialty channels, supported by branded activity including Good Culture's organic sour cream introduction (March 2024). Lactose-free and plant-based sour cream also expands addressable demand where dairy intolerance is high, while retaining culinary functionality for dips, toppings, and prepared meals.
Processing and packaging technology create margin opportunities by improving throughput and reducing waste, while also supporting retailer sustainability expectations. On processing efficiency, Arla Foods Ingredients introduced Nutrilac HighYield milk protein concepts in May 2025 to raise yield and remove acid whey separation steps in strained dairy processing, a capability relevant to cultured dairy portfolios and co-manufacturing economics. On packaging, INEOS Styrolution announced in August 2025 the commercial availability of sour cream cups with 30% recycled polystyrene content in ALDI SUD stores across Germany, showing retailer-ready recycled-content formats for dairy. R&D also points to tighter fermentation control as a route to consistent sensory outcomes across variable cream inputs, as reflected in 2025-2026 scientific publications on sour cream processing parameters and aroma formation, which helps manufacturers standardize product quality while expanding into new geographies and foodservice specifications.
Recent Industry Developments in Sour Cream Market
- June 2026: Danone announced the acquisition of MADE Group and the purchase of the remaining 49% stake in its fresh dairy joint venture with Saputo Dairy Australia, with completion targeted in the second half of 2026. The acquisition expands Danone's operational control and local manufacturing footprint in Australia, including cultured dairy adjacencies relevant to sour cream-style products and foodservice supply.
- January 2026: Good Culture announced a majority investment from L Catterton to support capacity expansion and accelerate growth across its cultured dairy portfolio, including sour cream. The funding supports scaling for premium, clean-label cultured products and can broaden distribution in retail and foodservice channels.
- April 2024: The State of Iowa announced Daisy Brand's planned investment of USD 626.5 million to expand operations in the state, supporting increased production capacity for cultured dairy. The project indicates continued capital deployment by leading sour cream brands to reinforce domestic supply and improve resilience against demand volatility and cold-chain constraints.


Sour Cream Market Report Scope and Research Methodology
Market Definition and Coverage
For this study, the sour cream market covers retail and foodservice sales of sour cream and sour cream alternatives that are sold as a finished product for consumer or commercial use, measured in value terms.
Scope exclusions: Excludes other dairy staples like fluid milk, yogurt, cream cheese, and culinary creams that are not marketed and sold as sour cream.
Segments Covered in This Report
- By Product Type
- Dairy
- Non-Dairy
- By Nature
- Organic
- Conventional
- By Application
- Bakery Products
- Salad and Dressings
- Dips and Toppings
- Snacks
- Ice Cream and Frozen Desserts
- Others
- By Distribution Channel
- Foodservice
- Retail
- Supermarkets / Hypermarkets
- Convenience Stores
- Online Retail Stores
- Other Channels
- By Geography
- North America
- United States
- Canada
- Mexico
- Rest of North America
- Europe
- Germany
- United Kingdom
- Italy
- France
- Spain
- Netherlands
- Poland
- Belgium
- Sweden
- Rest of Europe
- Asia-Pacific
- China
- India
- Japan
- Australia
- Indonesia
- South Korea
- Thailand
- Rest of Asia-Pacific
- South America
- Brazil
- Argentina
- Colombia
- Chile
- Peru
- Rest of South America
- Middle East and Africa
- South Africa
- Saudi Arabia
- United Arab Emirates
- Turkey
- Rest of Middle East and Africa
- North America
Data Sources, Market Sizing, and Validation
Desk Research
To build the base model structure, we start with public sources that reflect dairy supply, consumption patterns, and price movements. Common inputs come from USDA and other national agriculture departments, FAO datasets, UN Comtrade trade statistics, and dairy-industry associations that publish category notes and definitions.
We also review company annual reports, investor presentations, product labeling guidance, and reputable press coverage to map how sour cream is positioned across retail and foodservice. In parallel, a paid subscription for company financials and news supports tracking revenue exposure, plant expansions, and portfolio shifts. A patent database is also reviewed to flag activity around cultures and non-dairy formulations. These desk sources are illustrative only, and additional public references were used for data collection, internal checks, and clarifying assumptions.
Primary Interviews and Surveys
Primary work is used to pressure-test the desk assumptions and to keep the market math aligned with shelf and kitchen realities. We speak with manufacturers, ingredient suppliers, distributors, retailers, and foodservice-facing respondents across APAC, EMEA, and the Americas, then adjust assumptions on mix, pricing, and channel splits where the interviews show consistent gaps.
Distribution of primary research fieldwork respondents
| Company type | Respondent position | Region |
|---|---|---|
| Top tier: 27% | CXOs: 13% | APAC: 47% |
| Mid tier: 52% | Functional/Unit leaders: 33% | EMEA: 33% |
| Smaller Players: 21% | Managers: 54% | Americas: 20% |
Market-Sizing & Forecasting
Sizing starts with a top-down build where dairy category demand, cultured-dairy production, and trade flows are used to reconstruct the addressable sour cream pool by region. We then apply channel and application shares that were validated through discussions. Once that first number is formed, we corroborate it with selective bottom-up checks, such as sampled retail price points multiplied by observed pack sizes and estimated throughput, alongside distributor and foodservice sense-checks on volumes.
Key model inputs include cultured dairy production trends, raw milk and cream price movement, retail and foodservice price spreads, penetration of dips and toppings usage in meals, and the share of non-dairy alternatives within the sour cream set. Forecasts are built using scenario analysis supported by a light multivariate view of price and consumption drivers, and then aligned to what interviewees expect for category premiumization and private label activity. Where direct datapoints are thin, gaps are handled through proxy indicators like related dairy spreads performance and calibrated per-capita consumption benchmarks.
Data Validation & Update Cycle
Before sign-off, we run multiple checks so the estimate matches real market signals and does not drift from what buyers and sellers observe. Outputs are compared against independent indicators such as dairy price series, regional consumption direction, and noticeable shifts in retail assortment, and anomalies are reviewed and recalculated where needed.
A second analyst reviews the workbook logic, key assumptions, and unit consistency, and follow-up outreach is triggered if large variances appear by region or channel. Reports are refreshed annually, and interim updates are made when material events occur, such as major price shocks or regulatory changes that impact labeling or dairy inputs. Right before delivery, a final pass is completed so clients receive the latest updated view.
Mordor Intelligence's Sour Cream Market Sizing Compared With Other Published Estimates
Published values for sour cream can look far apart because the category is defined differently and the pricing base is not always consistent. The biggest drivers tend to be what gets counted as sour cream, how non-dairy alternatives are treated, and whether numbers reflect retail only or also include foodservice.
Adjacencies like cream cheese dips and plain culinary creams sit outside Mordor Intelligence's scope, which tends to keep the value tied to labeled sour cream demand rather than the wider dairy spreads shelf. Gaps also come from using aggressive price uplift assumptions, using a single global average price instead of region-specific pricing, and using older currency conversion timing that does not match the year being sized.
Benchmark comparison
| Source | Market Size | Gaps in Research Methodology |
|---|---|---|
| Mordor Intelligence | USD 5.06 B (2026) | |
| Industry Publisher A | USD 2.06 B (2025) | Often reflects a narrower captured sales pool with limited channel coverage, and it can undercount foodservice and cross-border trade effects when building global totals. |
| Industry Publisher B | USD 1.84 B (2024) | May use broad averages for pricing and packaging mix, and may not fully separate sour cream from nearby dairy spreads, which can shift what is included and the year-to-year comparability. |
Overall, the spread is mainly explained by category boundaries, channel coverage, and how pricing is progressed across regions and years. By keeping inputs traceable to demand and price signals that can be rechecked, the model gives a practical number that can be repeated and updated without relying on hidden assumptions.


Key Questions Answered in the Report
How large were global sour cream sales in 2026 and where are they headed by 2031?
Sales reached USD 5.06 billion in 2026 and are forecast to rise to USD 6.70 billion by 2031 at a 5.76% CAGR.
Which region is registering the fastest growth in sour cream consumption through 2031?
Asia-Pacific is advancing at a 6.62% CAGR, outperforming all other regions as urban diners adopt Western‐style dips and toppings.
How quickly are non-dairy sour cream alternatives expanding?
Plant-based versions are projected to grow at a 6.63% CAGR, outpacing dairy-based lines on the back of lactose intolerance and vegan diets.
What proportion of 2025 global revenue came from dairy-based products?
Dairy formulations accounted for 75.55% of worldwide sales in 2025.
Why are food-service channel sales growing faster than retail?
Quick-service restaurants and bakery chains are integrating sour cream into menu items, driving a 6.54% annual gain as suppliers roll out portion-control and UHT formats tailored to kitchens.
Page last updated on:





