Coal Based Activated Carbon Market Size and Share
Market Overview
| Study Period | 2021 - 2031 |
|---|---|
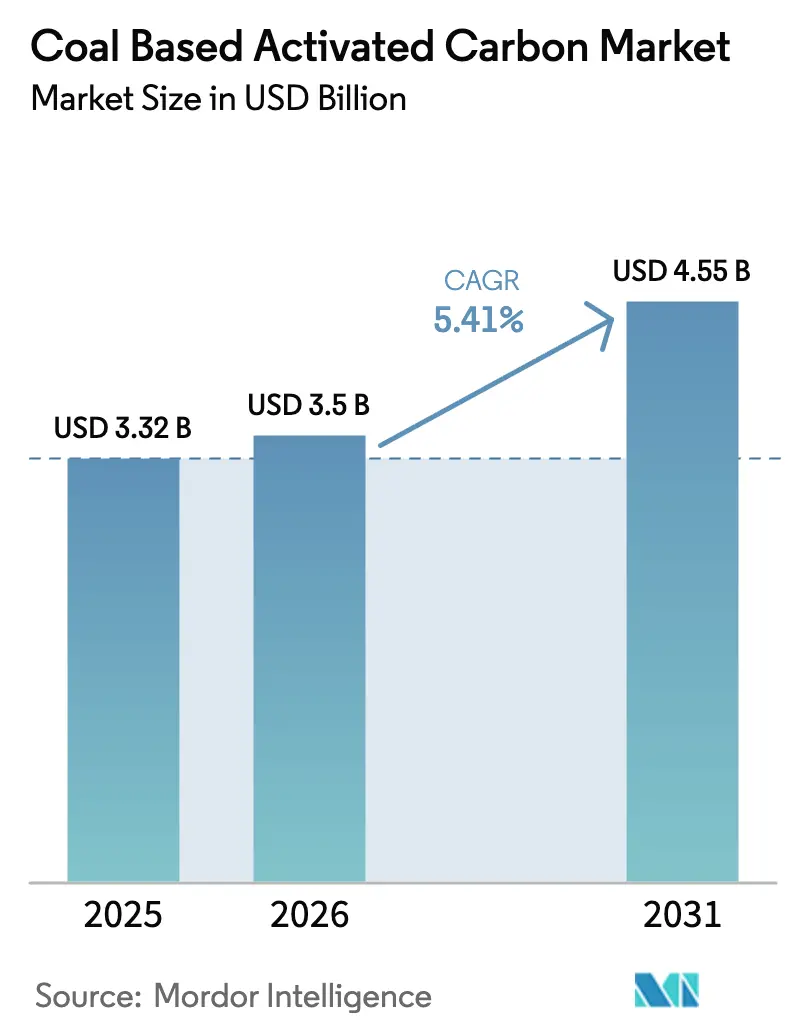
| Market Size (2026) | USD 3.5 Billion |
| Market Size (2031) | USD 4.55 Billion |
| Growth Rate (2026 - 2031) | 5.41% CAGR |
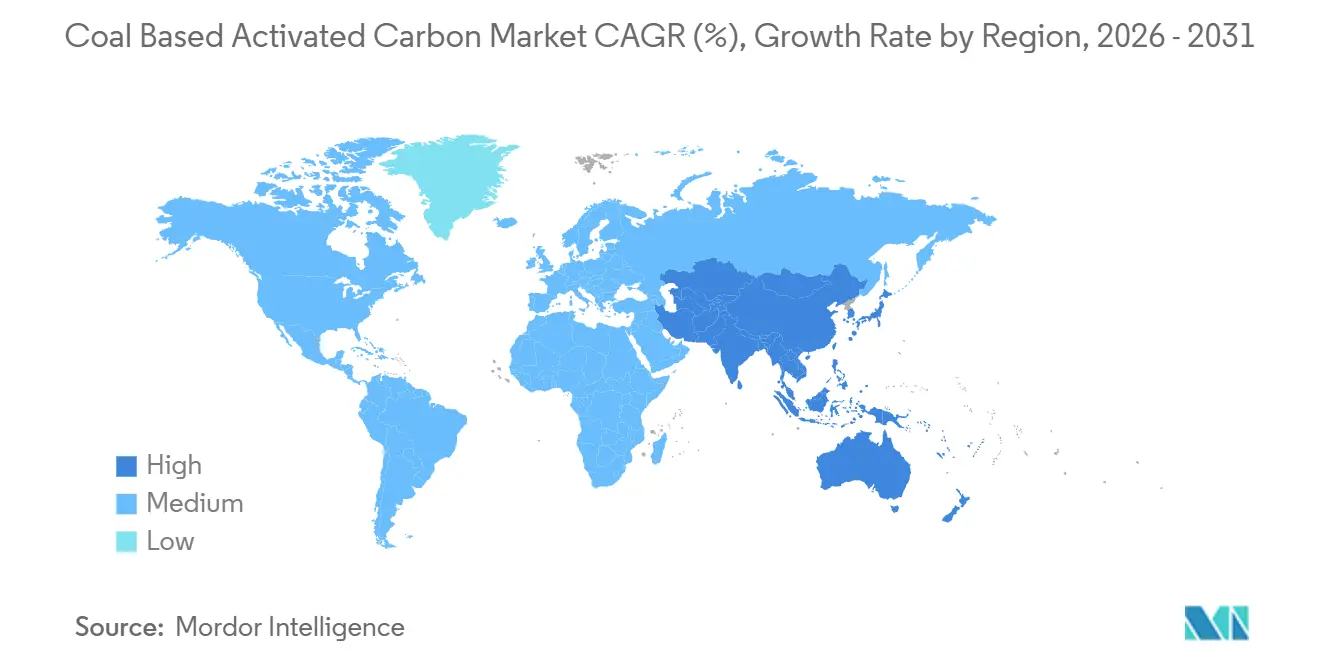
| Fastest Growing Market | Asia Pacific |
| Largest Market | Asia Pacific |
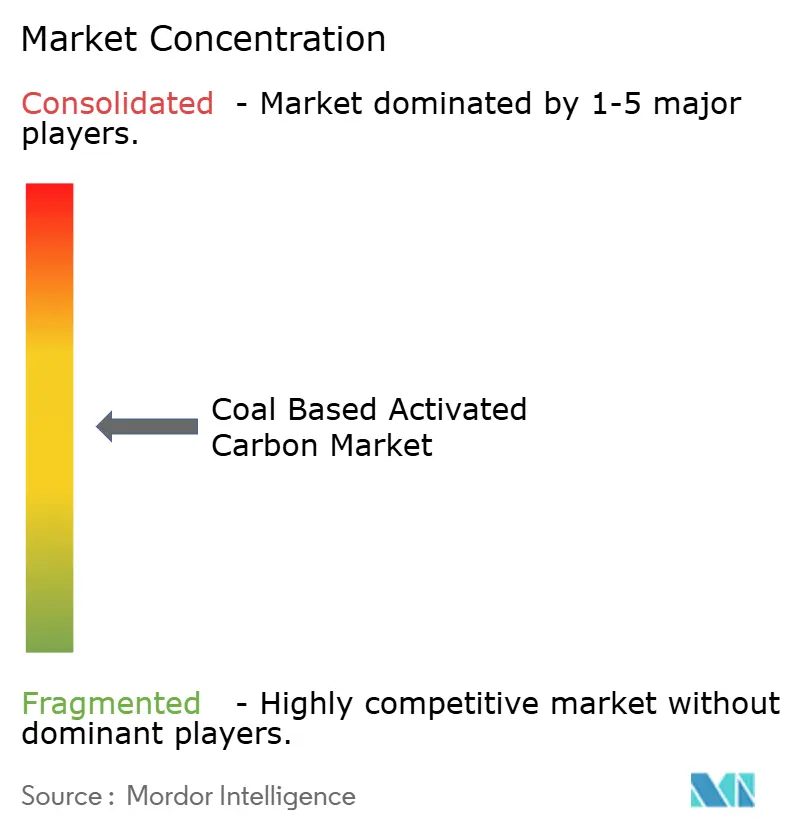
| Market Concentration | Medium |
Major Players *Disclaimer: Major Players sorted in no particular order Image © Mordor Intelligence. Reuse requires attribution under CC BY 4.0. | |
Coal Based Activated Carbon Market Analysis by Mordor Intelligence
The Coal-Based Activated Carbon Market size is projected to be USD 3.32 billion in 2025, USD 3.5 billion in 2026, and reach USD 4.55 billion by 2031, growing at a CAGR of 5.41% from 2026 to 2031. Utilities are securing regeneration-as-a-service contracts, which reduce lifecycle CO₂ emissions by nearly 80 percent while keeping unit costs below virgin-carbon benchmarks, despite the substitution risk from biomass carbons. In the United States and Europe, PFAS regulations have expedited municipal upgrades. Meanwhile, industrial users are shifting to extruded and pelletized media, which reduce pressure-drop losses in volatile-organic-compound (VOC) scrubbers. While coal-rich producers in China and India are expanding their capacities, Japan and South Korea's imports of high-iodine-number products highlight a quality gap that favors vertically integrated Western suppliers. Overall, the coal-based activated carbon market is adapting, with customers now assessing suppliers based on both adsorption performance and reductions in scope-3 emissions.
Key Report Takeaways
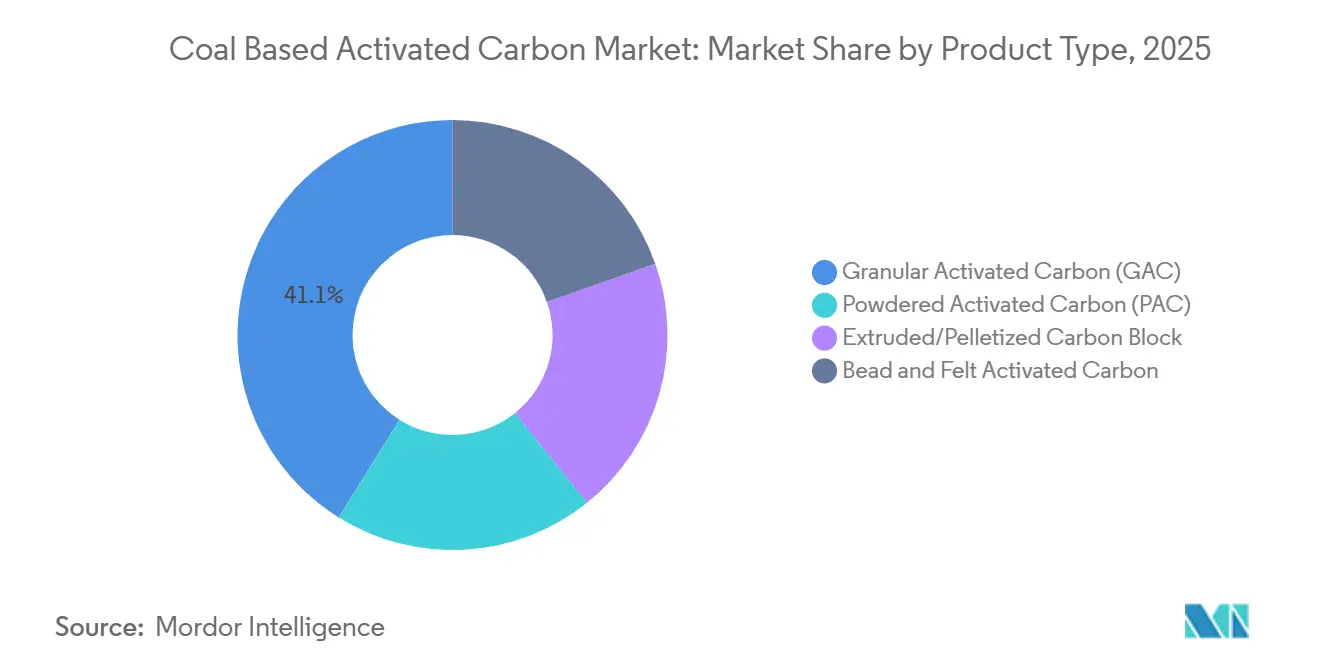
- By product type, granular activated carbon held 41.12% of the coal-based activated carbon market share in 2025; extruded and pelletized forms are projected to expand at a 5.89% CAGR in the 2026-2031 period.
- By activation process, steam activation accounted for 59.98% of the coal-based activated carbon market size in 2025, whereas phosphoric acid activation is advancing at a 5.98% CAGR in the 2026-2031 period.
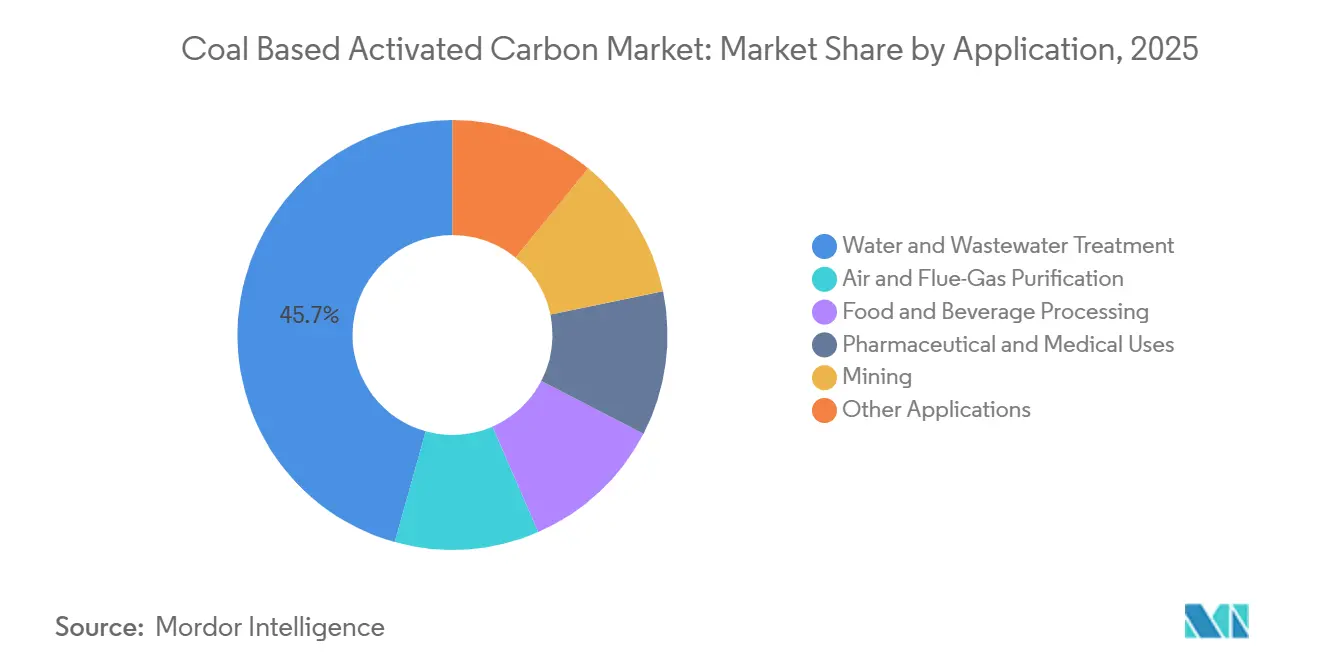
- By application, water and wastewater treatment captured 45.67% of the coal-based activated carbon market size in 2025, and air and flue-gas purification is rising at a 5.12% CAGR in the 2026-2031 period.
- By geography, Asia-Pacific led with 43.22% revenue share in 2025; it is also the fastest-growing region, registering a 5.96% CAGR in the 2026-2031 period.
Note: Market size and forecast figures in this report are generated using Mordor Intelligence’s proprietary estimation framework, updated with the latest available data and insights as of January 2026.
Global Coal Based Activated Carbon Market Trends and Insights
Drivers Impact Analysis*
| Drivers | (~) % Impact on CAGR Forecast | Geographic Relevance | Impact Timeline |
|---|---|---|---|
| Stricter air-emission norms boosting flue-gas purification | +1.2% | Global, with concentrated enforcement in North America, EU, and China | Medium term (2-4 years) |
| PFAS-driven ultra-trace standards for potable-water utilities | +1.5% | North America and EU core, spillover to APAC urban centers | Short term (≤ 2 years) |
| Surge in gold-ore cyanidation recovery circuits | +0.8% | South America (Peru, Chile), West Africa (Ghana, Burkina Faso), APAC (Indonesia, Philippines) | Long term (≥ 4 years) |
| Adoption of carbon-capture sorbents for cement and steel kilns | +0.6% | APAC (China, India), EU pilot projects | Long term (≥ 4 years) |
| Emergence of regeneration-as-a-service business models | +1.1% | Global, early traction in North America and Western Europe | Medium term (2-4 years) |
| Source: Mordor Intelligence | |||
Stricter Air-Emission Norms Boosting Flue-Gas Purification
In 2024, the U.S. MATS rule and China's ultra-low-emission standards mandate power and cement plants to inject high-iodine-number powdered activated carbon[1]U.S. Environmental Protection Agency, “Mercury and Air Toxics Standards Fact Sheet,” epa.gov. Suppliers near the Inner Mongolia and Shanxi coal basins are securing supply contracts tied to the thermal-coal benchmarks, a move that stabilizes gross margins amid feedstock fluctuations. In the EU, while biomass-based carbons command a premium, biomass co-firing plants are racing to meet the 2026 BAT conclusions, resulting in a surge in pilot orders. These regulations bolster the coal-based activated carbon market, as operators treat flue gas to maintain their operational licenses. Facilities that ensure minimal sulfur bleed-through and rapid adsorption kinetics stand to gain significantly, even with fluctuating load factors.
PFAS-Driven Ultra-Trace Standards for Potable-Water Utilities
In April 2024, the EPA set Maximum Contaminant Levels for six PFAS compounds at 4 ppt. They also identified coal-based granular activated carbon as the Best Available Technology for treating waters with total PFAS levels below 100 ppt. In response, utilities serving millions of U.S. residents entered into take-or-pay regeneration contracts, avoiding landfill liabilities for spent sorbent. Kuraray had anticipated the U.S. market opportunity to grow significantly by 2030. To capitalize, the company enhanced both virgin and reactivation capacities, aiming to secure a substantial share of that market. Meanwhile, India proposed a draft PFAS limit in line with EU Standards, signaling increased demand in South-Asia[2]Food Safety and Standards Authority of India, “Draft PFAS Limits,” fssai.gov.in. These developments have driven the coal-based activated carbon market toward a service-oriented revenue model, favoring vertically integrated suppliers.
Surge in Gold-Ore Cyanidation Recovery Circuits
Gold plants worldwide, utilizing CIP/CIL methods, are major consumers of coal-based carbon annually. Industry leaders Barrick and Newmont have recently expanded operations, resulting in significant increases in carbon consumption. In the Philippines, exporters are blending sub-bituminous coal with coconut-shell char, achieving iodine numbers that Australian refiners prefer. This underscores the region's adaptability in feedstock and its enhanced utilization. Rising cyanide costs have prompted initial trials of thiosulfate leaching, which could temper long-term growth. However, immediate volumes are supported by high-grade deposits in West Africa and Indonesia. Furthermore, smaller miners are adopting modular CIP skids, broadening their customer base and boosting throughput in the coal-based activated carbon market. Suppliers certifying abrasion resistance above ASTM Hardness gain a pricing edge in these slurry-intensive operations.
Adoption of Carbon-Capture Sorbents for Cement and Steel Kilns
In an effort to make CO₂ capture more cost-effective, China's Anhui Conch Cement and ArcelorMittal's Dunkirk works are piloting amine-impregnated, coal-based carbons. These pilot systems efficiently capture a substantial amount of CO₂ from moderately concentrated flue gases. They also regenerate the sorbent using waste heat, significantly reducing energy penalties. The European Union's Carbon Border Adjustment Mechanism (CBAM) has prompted exporters to adopt such initiatives before facing increased fees. Given that kiln exhausts emit higher levels of particulates and SOₓ than power plants, investments in pre-treatment systems, such as ESPs and desulfurization units, have become essential. These pilot projects are not only broadening the coal-based activated carbon market but are also establishing a profitable niche centered on high-value capture. This niche particularly favors sorbents with low attrition rates and rapid cyclic stability.
Restraints Impact Analysis*
| Restraints | (~) % Impact on CAGR Forecast | Geographic Relevance | Impact Timeline |
|---|---|---|---|
| Price volatility and logistics risk in coal feedstock | -0.7% | Global, acute in Asia-Pacific and Europe dependent on seaborne coal | Short term (≤ 2 years) |
| Competition from biomass-based activated carbon | -0.5% | North America and EU, driven by sustainability mandates | Medium term (2-4 years) |
| ESG-driven capital withdrawal from coal supply chains | -0.4% | Europe and North America, limited impact in Asia-Pacific | Long term (≥ 4 years) |
| Source: Mordor Intelligence | |||
Price Volatility and Logistics Risk in Coal Feedstock
In 2024, quarterly fluctuations in seaborne coal prices were influenced by factors such as weather conditions, Indonesian export quotas, and Chinese import policies. European producers, who rely heavily on imports, are seeing a significant increase in their landed coal costs due to rising freight charges. Smaller producers, bound by short-term procurement contracts, are experiencing margin compression as spikes in feedstock prices outpace the repricing of their contracts. In contrast, producers with captive mines in Shanxi or long-term offtakes in the U.S. Illinois Basin are enjoying higher EBITDA margins than those buying at spot prices. While efforts to enhance coal fines from wash-plants have led to carbons with iodine numbers in a limited range, this constraint restricts their use to low-value dye-removal markets and diminishes their potential in the coal-based activated carbon sector.
Competition from Biomass-Based Activated Carbon
In 2024, exports of coconut shells from Southeast Asia increased significantly, providing beverage and consumer goods clients with renewable alternatives that commanded a price premium in the EU and the U.S. However, the lower bulk density of these coconut shells resulted in a reduced bed life in fixed water contactors, often negating per-unit cost advantages. Nevertheless, major corporations adjusted their procurement strategies to prioritize these renewable feedstocks. While wood-based carbons met rigorous pharmaceutical purity standards, their high costs limited adoption in more price-sensitive sectors. Additionally, the overlap of coconut feedstocks with the biofuel and biochar markets occasionally tightened supply, pushing buyers back to coal products during harvest shortages. This cyclical shift helped mitigate the dampening impact on the market for coal-based activated carbon.
*Our forecasts treat driver/restraint impacts as directional, not additive. The impact forecasts reflect baseline growth, mix effects, and variable interactions.
Segment Analysis
By Product Type: Extruded Forms Gain in Industrial Air Systems
In 2025, the market saw granulated activated carbon holding a dominant 41.12% share. However, projections indicate that during the forecast period of 2026–2031, both extruded and pelletized forms are poised to expand at a vigorous 5.89% CAGR, outpacing all other categories. Within the chemicals and refining sectors, energy-intensive VOC scrubbers are increasingly leaning towards extruded pellets. These pellets not only reduce fan energy consumption but also lead to substantial savings in operating expenses, prompting a shift in specifications toward cylindrical media.
Osaka Gas Chemicals has bolstered Japan's coal-based activated carbon market by activating new presses. This, combined with binder advancements that enhance BET surface areas, has fueled steady growth for extruded products. While powdered forms play a pivotal role in emergency water remediation and pharmaceutical purification, bead and felt derivatives cater to niche applications in medical devices. However, the high capital investment required for a 10,000-ton line confines extrusion to financially robust players, resulting in a moderate concentration within this segment of the coal-based activated carbon market.


By Activation Process: Phosphoric Acid Gains on Surface-Area Advantages
Steam activation, with its familiar, reagent-free, and capital-light approach, successfully retained 59.98% of the 2025 output. Meanwhile, phosphoric acid activation, primarily due to its co-activation with KOH, achieved the highest growth rate at a 5.98% CAGR in the forecast period of 2026–2031. This co-activation significantly boosted surface areas to the 1,200-1,500 m²/g range and enhanced micropore volume.
Consequently, the market size for coal-based activated carbon, especially those utilizing phosphoric acid routes, has seen the fastest growth. This surge comes even as some Western operators shy away, deterred by wastewater neutralization costs. In contrast, plants in China and India, capitalizing on lower H₃PO₄ prices and more lenient effluent regulations, have managed to deliver superior performance at competitive prices. This advantage has enabled them to undercut their steam-only rivals. While CO₂ activation remains a niche player, its eight-hour residence times limit kiln utilization. Zinc chloride routes, however, are witnessing a downturn, grappling with stringent heavy-metal discharge limits. These economic shifts not only bolster steam's market share but also channel incremental volume and profit margins towards phosphoric acid specialists in the coal-based activated carbon arena.
By Application: Air Purification Accelerates on VOC Mandates
In 2025, water and wastewater treatment dominated the landscape, accounting for 45.67% of the total tonnage. This dominance highlights the sector's extended capital cycles and the retrofitting driven by concerns over PFAS. On the other hand, air and flue-gas purification is experiencing rapid growth, with projections indicating a 5.12% compound annual growth rate (CAGR) during the forecast period of 2026–2031. This momentum is primarily fueled by China's stringent ultra-low emission standards and recent updates to the U.S. NESHAP, both of which mandate powdered activated carbon (PAC) injection for effective mercury and volatile organic compound (VOC) capture.
Consequently, coal-based activated carbon is witnessing a steady increase in market share, especially in flue-gas applications. This growth is particularly pronounced in the cement kilns and waste-to-energy plants, which are offsetting stagnant water volumes from long-established municipalities. The food and beverage industry continues its consistent annual procurement; however, there is a discernible shift toward coconut-shell alternatives for sugar decolorization, which slightly tempers overall growth. Meanwhile, the steadfast purity benchmarks in pharmaceuticals and the consistent demand from gold mining fortify these sectors, contributing to a stable demand landscape that underpins the market's overall stability.
Geography Analysis
In 2025, the Asia-Pacific region dominated the global stage, capturing a notable 43.22% share of the global market and charting a robust projected CAGR of 5.96% for the forecast period 2026–2031. China, while a significant producer, turned to imports, acquiring premium products at prices considerably above the average export rates. This trend highlighted the resilience and demand for specialty grades in the coal-based activated carbon market. In India, production levels, combined with reduced logistics costs in Andhra Pradesh and Odisha, paved the way for enhanced regional self-sufficiency. Meanwhile, the Philippines showcased the cost benefits of blended feedstock, making it an attractive proposition for buyers in Japan and South Korea.
North America, particularly the United States, played a pivotal role in the 2025 demand landscape, largely influenced by stringent PFAS regulations and mercury limits that leaned towards regeneration contracts. Canada's oil-sands water circuits and Mexico's vibrant food processing industry further enriched the regional dynamics. Europe, while holding a significant market share, faced challenges with rising coal prices and ESG capital pressures. These factors nudged producers to pivot towards reactivation kilns, increasingly powered by renewable energy. In South America, buoyed by gold outputs from Peru and Chile, the market witnessed steady growth. The Middle-East and Africa, though modest in their global share, carved out niches in desalination pre-treatment and gold projects in West Africa. These intricate regional dynamics collectively shaped a balanced global growth trajectory for the coal-based activated carbon market.

Competitive Landscape
The coal-based activated carbon market is moderately fragmented. Vertical integration into coal supply, activation, and regional reactivation keeps switching costs high and enables lifecycle contracts that stabilize earnings. There is significant potential in carbon-capture-ready kilns, particularly those co-located with cement and steel plants. Jacobi targets this niche through its solar-powered Tianjin facility, which qualifies for green bonds. Mid-tier firms are forming joint ventures with industrial-gas majors to finance such infrastructure without breaching ESG covenants. Minimum-volume thresholds of regeneration contracts mean that smaller industrial customers remain underserved, offering entry points for agile regional suppliers. Overall, technology, feedstock control, and reactivation density define competitive moats within the coal-based activated carbon market.
Coal Based Activated Carbon Industry Leaders
Cabot Corporation
KURARAY CO., LTD.
Osaka Gas Chemicals
Haycarb PLC
Boyce Carbon Ltd
- *Disclaimer: Major Players sorted in no particular order

Recent Industry Developments
- December 2024: Cabot Corporation implemented an 8-12% price increase across its activated carbon product lines to address rising coal feedstock costs and maintain margin stability. This successful price adjustment highlights the company's strong market positioning in critical applications where performance takes precedence over cost considerations.
- May 2024: Kuraray Co., Ltd. announced that Calgon Carbon Corporation, its U.S. subsidiary, will acquire the industrial reactivated carbon business from Sprint Environmental Services, LLC, which includes a coal-based activated carbon segment.


Global Coal Based Activated Carbon Market Report Scope
Coal-based activated carbon is a highly porous adsorbent material derived from anthracite, bituminous, or lignite coal through carbonization and activation processes, resulting in an extensive internal pore structure (micro, meso, and macro pores). It is primarily used for liquid and gas phase purification, odor control, and decolorization.
The activated carbon market is segmented by product type, activation process, application, and geography. By product type, the market is segmented into powdered activated carbon (PAC), granular activated carbon (GAC), extruded/pelletized carbon block, and bead and felt activated carbon. By activation process, the market is segmented into steam activation, carbon dioxide activation, phosphoric acid, and zinc chloride. By application, the market is segmented into water and wastewater treatment, air and flue-gas purification, food and beverage processing, pharmaceutical and medical uses, mining (gold recovery), and other applications (industrial solvent recovery, biogas and hydrogen purification, etc.). The report also covers the market size and forecasts for the market in 18 countries across major regions. For each segment, the market sizing and forecasts are done based on value (USD).
| Powdered Activated Carbon (PAC) |
| Granular Activated Carbon (GAC) |
| Extruded/Pelletized Carbon Block |
| Bead and Felt Activated Carbon |
| Steam Activation |
| Carbon Dioxide Activation |
| Phosphoric Acid |
| Zinc Chloride |
| Water and Wastewater Treatment |
| Air and Flue-Gas Purification |
| Food and Beverage Processing |
| Pharmaceutical and Medical Uses |
| Mining (Gold Recovery) |
| Other Applications (Industrial Solvent Recovery, Biogas and Hydrogen Purification, etc.) |
| Asia-Pacific | China |
| Japan | |
| India | |
| South Korea | |
| ASEAN Countries | |
| Rest of Asia-Pacific | |
| North America | United States |
| Canada | |
| Mexico | |
| Europe | Germany |
| United Kingdom | |
| France | |
| Italy | |
| Spain | |
| Russia | |
| NORDIC Countries | |
| Rest of Europe | |
| South America | Brazil |
| Argentina | |
| Rest of South America | |
| Middle-East and Africa | Saudi Arabia |
| South Africa | |
| Rest of Middle-East and Africa |
| By Product Type | Powdered Activated Carbon (PAC) | |
| Granular Activated Carbon (GAC) | ||
| Extruded/Pelletized Carbon Block | ||
| Bead and Felt Activated Carbon | ||
| By Activation Process | Steam Activation | |
| Carbon Dioxide Activation | ||
| Phosphoric Acid | ||
| Zinc Chloride | ||
| By Application | Water and Wastewater Treatment | |
| Air and Flue-Gas Purification | ||
| Food and Beverage Processing | ||
| Pharmaceutical and Medical Uses | ||
| Mining (Gold Recovery) | ||
| Other Applications (Industrial Solvent Recovery, Biogas and Hydrogen Purification, etc.) | ||
| By Geography | Asia-Pacific | China |
| Japan | ||
| India | ||
| South Korea | ||
| ASEAN Countries | ||
| Rest of Asia-Pacific | ||
| North America | United States | |
| Canada | ||
| Mexico | ||
| Europe | Germany | |
| United Kingdom | ||
| France | ||
| Italy | ||
| Spain | ||
| Russia | ||
| NORDIC Countries | ||
| Rest of Europe | ||
| South America | Brazil | |
| Argentina | ||
| Rest of South America | ||
| Middle-East and Africa | Saudi Arabia | |
| South Africa | ||
| Rest of Middle-East and Africa | ||


Key Questions Answered in the Report
How large is the coal-based activated carbon market in 2026?
It is estimated at USD 3.50 billion in 2026, on track to reach USD 4.55 billion by 2031 at a 5.41% CAGR in the 2026-2031 period.
Which product leads in global demand?
Granular Activated Carbon held 41.12% share in 2025, driven by municipal water and gold recovery circuits.
What is the fastest-growing application area?
Air and flue-gas purification is projected to expand at 5.12% CAGR (2026-2031) because of tighter VOC and mercury rules.
Why are regeneration-as-a-service contracts gaining traction?
They cut lifecycle CO₂ emissions and lower net costs versus virgin carbon, appealing to utilities under PFAS mandates.
Which region offers the quickest growth prospects?
Asia-Pacific is forecast to deliver a 5.96% CAGR through 2031, buoyed by large-scale industrial and municipal investments.
Page last updated on:


