
Market Overview
| Study Period | 2020 - 2031 |
|---|---|
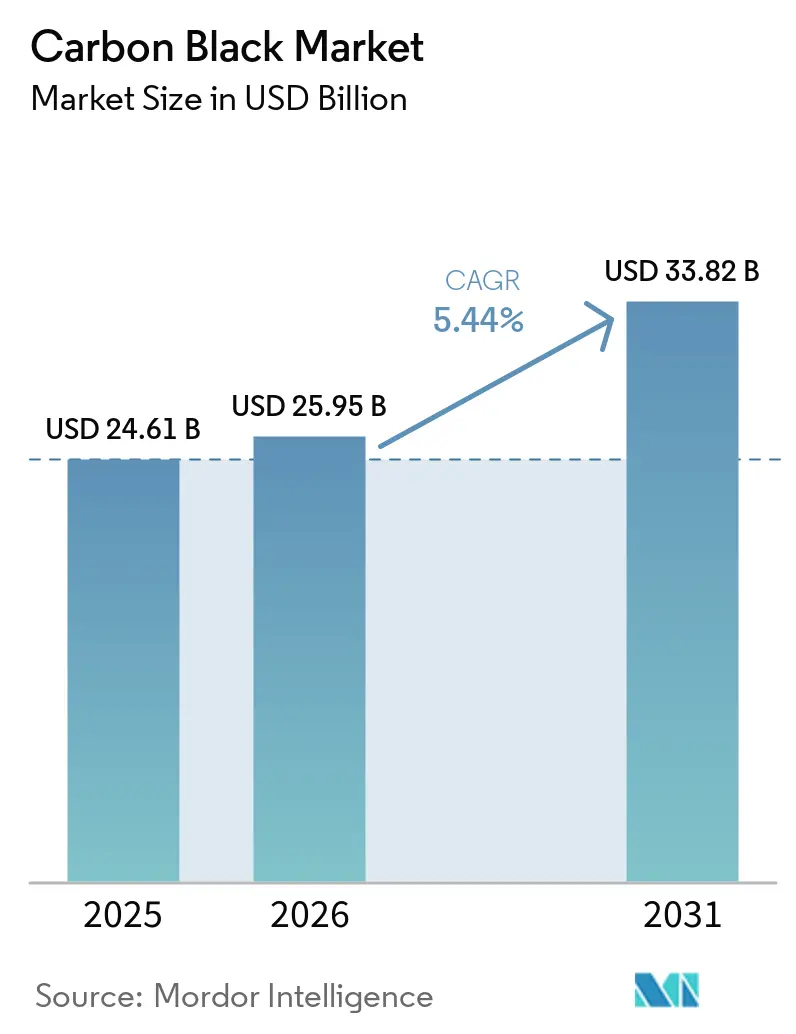
| Market Size (2026) | USD 25.95 Billion |
| Market Size (2031) | USD 33.82 Billion |
| Growth Rate (2026 - 2031) | 5.44 % |
| Fastest Growing Market | Asia Pacific |
| Largest Market | Asia Pacific |
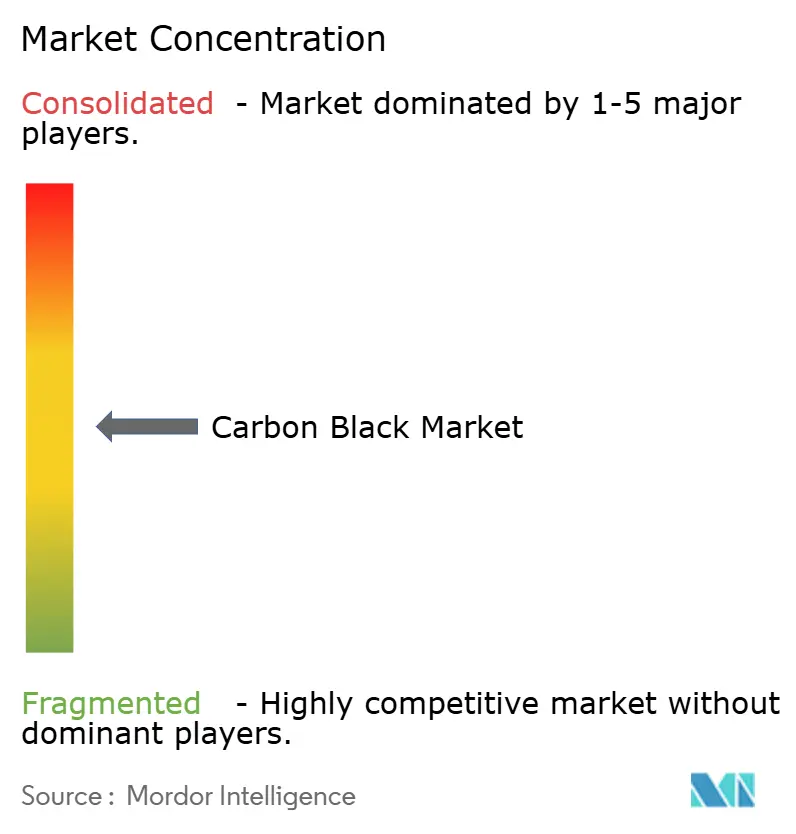
| Market Concentration | Medium |
Major Players *Disclaimer: Major Players sorted in no particular order Image © Mordor Intelligence. Reuse requires attribution under CC BY 4.0. | |
Carbon Black Market Analysis by Mordor Intelligence
The Carbon Black market size is expected to grow from USD 24.61 billion in 2025 to USD 25.95 billion in 2026 and is forecast to reach USD 33.82 billion by 2031 at 5.44% CAGR over 2026-2031. Strong demand from tire reinforcement, plastics compounding, battery electrodes, and high‐performance coatings anchors steady volume growth while enabling a gradual mix shift toward premium specialty grades. Capacity additions across Asia-Pacific underpin output expansion, yet feedstock volatility and rising sustainability requirements force producers to adopt tighter cost control and process innovation. Heightened electrification accelerates conductive grade uptake, and process breakthroughs such as plasma methane pyrolysis reshape competitive positioning. The carbon black market continues to capture value as a critical material input for traditional mobility and emerging energy storage supply chains.
Key Report Takeaways
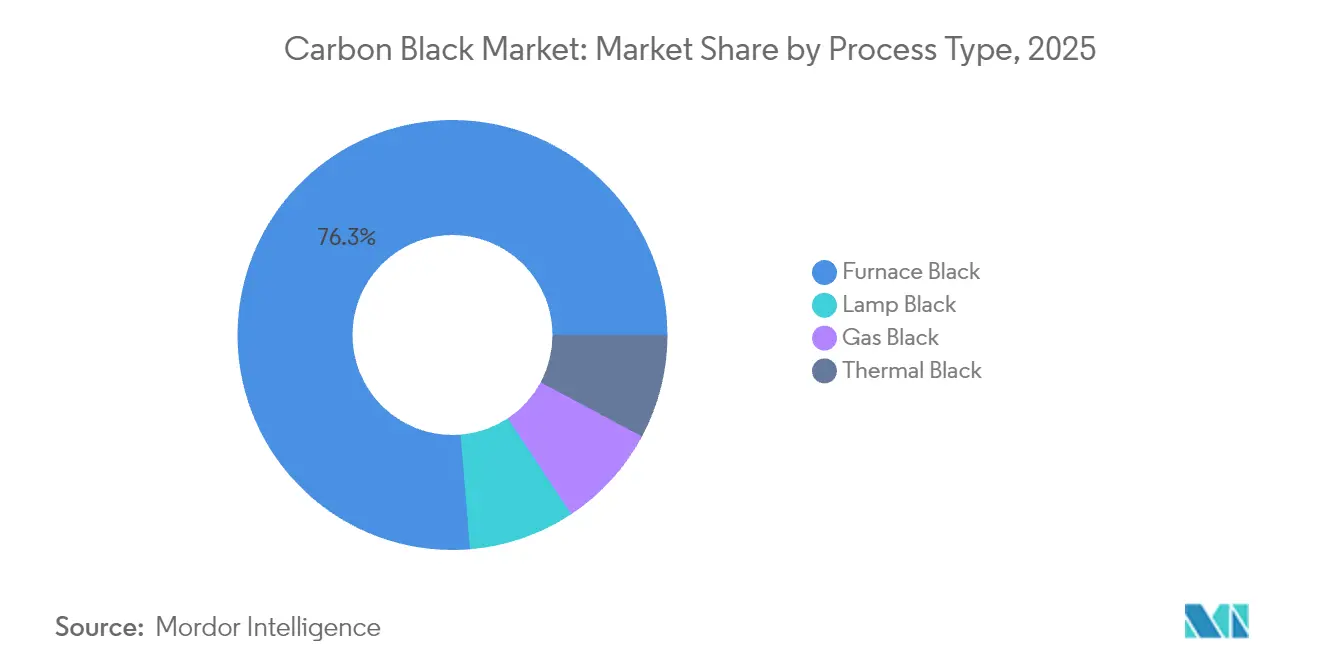
- By process type, furnace black held 76.30% of the carbon black market share in 2025. Lamp black is forecast to expand at a 7.35% CAGR through 2031, the fastest among process types.
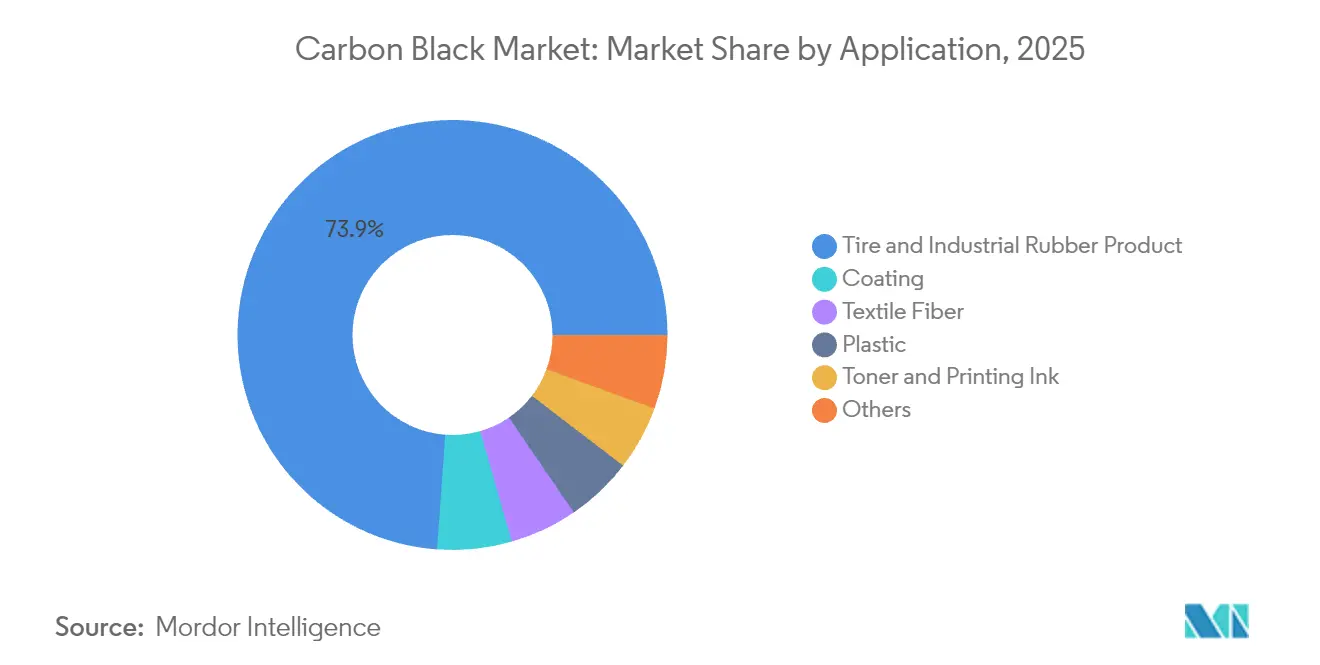
- By application, the tire and industrial rubber segment captured 73.85% of the carbon black market size in 2025. Coating applications are projected to record a 6.92% CAGR between 2026 and 2031, the highest within the application mix.
- Asia-Pacific commanded 61.85% revenue share of the carbon black market in 2025 and is advancing at a 5.85% CAGR to 2031.
Note: Market size and forecast figures in this report are generated using Mordor Intelligence’s proprietary estimation framework, updated with the latest available data and insights as of 2026.
Global Carbon Black Market Trends and Insights
Drivers Impact Analysis*
| Drivers | (~) % Impact on CAGR Forecast | Geographic Relevance | Impact Timeline |
|---|---|---|---|
| Tire manufacturing capacity expansion | +1.8% | Asia-Pacific core, spill-over to North America and Europe | Medium term (2-4 years) |
| Shift from standard to specialty blacks | +1.2% | Global, concentrated in developed markets | Long term (≥ 4 years) |
| Electrification-led demand for conductive grades | +0.9% | Global, led by China, Europe, North America | Medium term (2-4 years) |
| Low-carbon plasma methane blacks | +0.6% | North America and Europe initially | Long term (≥ 4 years) |
| Rising electric vehicle output | +0.7% | Global, EV manufacturing hubs | Medium term (2-4 years) |
| Source: Mordor Intelligence | |||
Surge in tire manufacturing capacity, especially in the Asia-Pacific region
New tire plants across China, India, and Southeast Asia continue to lock in multi-year carbon black off-take contracts that underpin predictable demand patterns. Yokohama’s ongoing Chinese capacity additions exemplify how large tire complexes stimulate parallel investments in nearby carbon black units, lowering logistics costs and encouraging just-in-time delivery models. Regional clustering raises carbon black demand density and supports economies of scale that benefit furnace black producers. Suppliers with ISO 14001-certified operations secure preferred vendor status, consolidating share among environmentally compliant facilities[1]. The structural link between tire output and carbon black consumption therefore provides a demand floor that smooths revenue cycles and aids long-range capital planning.
Rapid shift from standard to specialty blacks
OEM requirements for lower rolling resistance and higher conductivity push tire makers to adopt engineered grades that command 40-60% premiums over commodity furnace blacks. These specialty carbon black formulations enhance fuel economy and extend tread life, thereby generating measurable performance benefits that outweigh incremental cost. Producers investing in proprietary surface modification and ultra-clean furnace configurations gain sustainable advantages in a higher-margin niche. Technical differentiation and customer qualification protocols create switching costs that strengthen supplier lock-in, while the share of specialty shipments in the carbon black market rises steadily each year. Tight integration between research and development teams and tire designers accelerates the pivot toward advanced grades.
Electrification-led demand for conductive/acetylene grades
Lithium-ion battery electrodes require highly conductive additives to minimize internal resistance, and acetylene black offers superior particle morphology for this role. As electric vehicle output surges, battery manufacturers specify low-ash, high-purity carbon blacks with narrow particle-size distributions, raising qualification hurdles that only a subset of producers can meet. Orion Engineered Carbons responded by debottlenecking conductive-grade capacity and secured new supply agreements that diversify revenue beyond cyclic tire volumes. The resulting demand stream decouples from traditional automotive metrics, aligning growth with secular electrification trajectories and driving product portfolio rebalancing across the carbon black market.
Low-carbon plasma-methane blacks gain OEM credits
Plasma methane pyrolysis converts natural gas into solid carbon black and hydrogen with markedly lower CO₂ intensity than furnace processes. Monolith Materials’ commercial plant, supported by a USD 1.04 billion Department of Energy loan guarantee, positions the firm to capture carbon credit premiums and hydrogen revenue streams that offset higher capital intensity. Automotive and electronics OEMs increasingly incorporate Scope 3 emissions data into procurement scoring, giving low-carbon suppliers a competitive edge. Successful scale-up could catalyze wider adoption, compelling incumbents to reassess technology roadmaps and bundle sustainability metrics into value propositions across the carbon black market.
Restraints Impact Analysis*
| Restraints | (~) % Impact on CAGR Forecast | Geographic Relevance | Impact Timeline |
|---|---|---|---|
| Volatile feedstock pricing | -0.8% | Global, acute in import-dependent regions | Short term (≤ 2 years) |
| CO₂/PAH emission caps | -0.5% | Europe and North America | Medium term (2-4 years) |
| Quality variability of recovered carbon black | -0.3% | Markets with tire recycling mandates | Long term (≥ 4 years) |
| Source: Mordor Intelligence | |||
Volatile feedstock pricing
Carbon black production relies heavily on carbonaceous feedstocks such as coal tar and residual fuel oil that can represent up to 50% of total operating cost. The Producer Price Index for carbon and graphite products climbed sharply through late 2024, squeezing margins before contractual pass-through clauses could take effect. Import-dependent plants face added freight exposure that widens regional price differentials and influences trade flow arbitrage. Integrated producers with long-term supply agreements partially shield earnings, whereas spot buyers endure profit swings that influence maintenance turnarounds and capacity utilization. Effective hedging and procurement strategies, therefore, remain essential to stabilize cash flows across the carbon black market.
Regulatory caps on CO₂/PAH emissions from furnaces
The EU Carbon Border Adjustment Mechanism introduces embedded-carbon tariffs on imported carbon-intensive goods, raising landed costs for furnace black shipped into Europe from older plants. Similar oversight expansions are under consideration in North America through tightening EPA rules on industrial combustion emissions[2]. Producers must retrofit scrubbers and optimize combustion controls to meet lower permissible thresholds for polycyclic aromatic hydrocarbons, often triggering capital outlays that challenge facilities nearing end-of-life. Compliance costs favor newer, high-efficiency units and accelerate rationalization of outdated capacity, potentially curbing overall output growth until replacement assets come online.
*Our forecasts treat driver/restraint impacts as directional, not additive. The impact forecasts reflect baseline growth, mix effects, and variable interactions.
Segment Analysis
By Process Type: Furnace Black Dominance Faces Specialty Pressure
Furnace black accounted for 76.30% of 2025 revenue, highlighting its versatility and competitive economics across core tire and rubber goods. Nonetheless, the carbon black market size in furnace applications confronts a gradual share drift as specialty processes gain traction. Lamp black, supported by a 7.35% forecast CAGR through 2031, benefits from an inherent high-surface-area morphology that delivers superior conductivity in electronics and energy storage coatings. Gas black maintains usage in fine-dispersion inks, whereas thermal black serves niche polymer blends requiring low structure. The disruptive entrance of plasma methane technology extends the process palette by offering a low-emission pathway that can align with OEM carbon accounting frameworks.
Competitive responses include modular reactor retrofits that enable production of semi-specialty grades within existing furnace lines. Cabot Corporation and Birla Carbon are piloting advanced feed-injection controls to tighten particle size distribution and boost structure indices without needing new processes. Successful adaptation preserves scale advantages while capturing value migration toward specialty products. As ASTM develops a unified classification for recovered carbon black, furnace producers may incorporate rCB blending strategies to meet circularity targets without jeopardizing compound performance. Overall, the coexistence of commodity and specialty processes drives a dual-track growth model within the carbon black market.

By Application: Tire Segment Stability Enables Coating Growth
The tire and industrial rubber segment supplied 73.85% of 2025 demand, anchoring long-run production planning and capital recovery cycles. At the same time, the coating segment is projected to advance at a robust 6.92% CAGR through 2031, the fastest within the mix. This tilt illustrates strategic rebalancing from volume-driven sales toward differentiated offerings that command premium margins. Plastic compounding remains a steady outlet as automakers pursue lightweight interiors and exterior panels that require UV-protective blacks. Toner and printing ink volumes trend flat amid digitalization, yet specialized ultrafine grades retain defensible pricing.
Coating formulators increasingly specify treated carbon blacks that provide high jetness, electrical grounding, and UV durability, qualities unavailable from dyes or pigments alone. Products such as Birla Carbon’s Continua SCM cater to conductive paint systems used in electromagnetic interference shielding and battery casings. Stringent VOC rules also favor high-purity blacks that permit lower solvent usage. Textile fibers adopt carbon black for antistatic properties, opening incremental demand pockets that diversify revenue streams. Collectively, these shifts elevate the value density of each ton sold and reduce exposure to automotive production cycles, improving earnings resilience across the carbon black market.
Geography Analysis
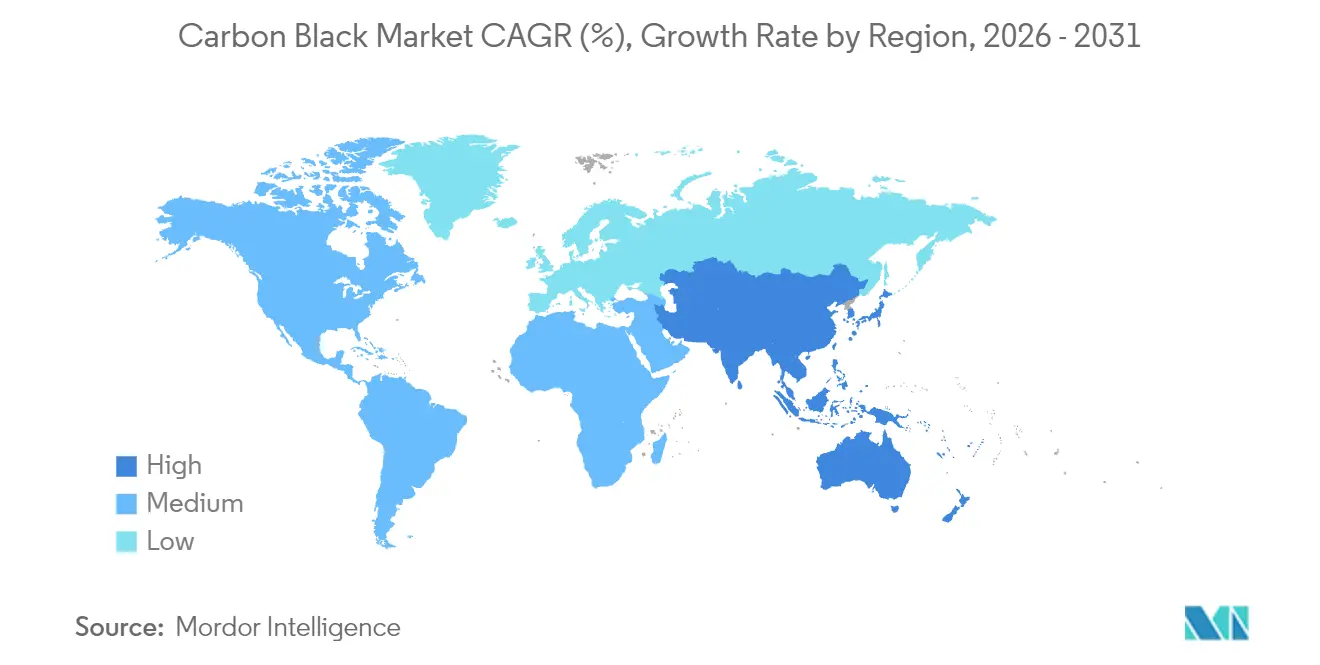
Asia-Pacific held 61.85% of global revenue in 2025, supported by China’s tire manufacturing concentration and India’s specialty grade expansion, and is forecast to log a 5.85% CAGR to 2031. China integrates large tire plants with adjacent carbon black units, achieving feedstock and logistics efficiencies that bolster regional competitiveness. India’s Himadri Speciality Chemical added 70,000 MTPA of premium capacity in 2024, signaling a shift from commodity supply toward higher-margin powders for performance tires and battery components. Japan and South Korea contribute technology leadership, while Southeast Asian economies supply cost-effective labor and growing domestic auto demand.
North America records mature yet stable consumption, driven by replacement tire demand, high-performance coatings, and early adoption of low-emission processes. Monolith Materials’ Nebraska plasma facility introduces an alternative supply base aligned with green procurement objectives, while Cabot Corporation leverages its U.S. specialty plants to pass through inflationary costs without significant volume attrition. The Inflation Reduction Act’s battery incentives indirectly support conductive grade growth, providing a structural tailwind for the carbon black market in the region.
Europe emphasizes sustainability and specialty applications, with the Carbon Border Adjustment Mechanism encouraging localized production or preferential sourcing from low-carbon suppliers. Caps on PAH and CO₂ emissions accelerate modernization or closure of legacy furnaces. Producers with advanced after-treatment systems maintain market access and negotiate price premiums that offset compliance expenditures.
South America, the Middle East, and Africa collectively account for a smaller share but exhibit pockets of high growth linked to expanding automotive assembly and broader industrialization. Brazil’s automotive recovery drives localized tire output that stimulates domestic carbon black production investment. Middle Eastern players leverage petrochemical raw material integration to propose new furnace units, though downstream demand still lags Asia-Pacific scale. South Africa’s coatings and mining sectors require specialty dispersion blacks, yet currency volatility clouds capital planning. Combined, these regions offer expansion optionality as primary markets mature, allowing diversified producers to balance regional cycles within the global carbon black market.
Regulatory Landscape
Emissions compliance remains the primary regulatory lever for carbon black manufacturing, with the US Environmental Protection Agency regulating the sector under the National Emission Standards for Hazardous Air Pollutants for Carbon Black Production (40 CFR Part 63, Subpart YY), including standards finalized in 2021 for major and area sources. In parallel, information-collection and monitoring requirements tied to stationary-source air rules keep pressure on producers to document controls for pollutants including PAHs and combustion-related emissions, which affects retrofit cadence and operating practices at legacy furnace assets.
In the European Union, carbon black sits within the REACH/CLP framework and is registered with the European Chemicals Agency (ECHA). As of March 2025, ECHA deferred the substance evaluation of carbon black under the Community Rolling Action Plan (CoRAP) to 2027, keeping registration and dossier maintenance central for suppliers serving Europe. Product-specific regulatory clearances also shape downstream access, including Cancarb Limited receiving a US FDA Food Contact Substance notification (FCN 2420) in February 2025 for a specified thermal carbon black grade used under defined food-contact conditions, creating a compliance moat for safety-sensitive polymer and elastomer applications.
Value Chain Analysis
The carbon black value chain starts with hydrocarbon feedstocks such as FCC slurry oil, coal tar, and ethylene cracker tar. These feedstocks are then converted in furnace (dominant), thermal, lamp, or gas processes, followed by pelletizing and packaging for shipment in bulk or bagged form to compounders and end-users, including tire makers, industrial rubber goods, plastics, coatings, inks, and battery-material customers. Feedstock sourcing and energy availability remain the largest cost and continuity levers, as refinery maintenance cycles and disruptions in residual streams can tighten supply, while port congestion and bulk logistics constraints affect both inbound feedstock flows and outbound carbon black deliveries.
Downstream, qualification requirements and sustainability documentation increasingly influence supplier selection, adding steps such as traceability, mass-balance accounting, and third-party certification for circular or bio-circular inputs. This shows up in 2026 moves to incorporate tire pyrolysis oil (TPO) into certified supply chains, including Orion S.A. starting circular carbon black production at its ISCC PLUS-certified Qingdao site, and in vertically integrated expansions that strengthen supply security, such as Balkrishna Industries Limited increasing carbon black capacity to 360,000 MTPA. Trade patterns also matter, highlighted by India becoming the EU's largest carbon black supplier in 2024 (about 150,000 tonnes exported), which increases the importance of export logistics and compliance readiness for Europe-facing shipments.
Competitive Landscape
The carbon black industry remains moderately fragmented. Strategic themes include vertical integration for feedstock security, regional expansion alongside customer footprints, and research and development alliances that accelerate qualification cycles. Partnerships between carbon black makers and EV battery companies shorten prototype timelines and embed suppliers in next-generation chemistry roadmaps. Mergers and acquisitions remain a viable route to specialty grade capability, though regulatory scrutiny on emissions and circularity may influence deal valuations. Recovered carbon black suppliers race to meet ASTM D36 standards, aiming to supply sustainable material for mid-tier tire formulations. Overall, technology leadership and sustainability credentials increasingly determine competitive advantage in the carbon black market.
Carbon Black Industry Leaders
-
Cabot Corporation
-
Birla Carbon (Aditya Birla Group)
-
Orion Engineered Carbons S.A.
-
Tokai Carbon Co. Ltd
-
Jiangxi Black Cat Carbon Black Co. Ltd
- *Disclaimer: Major Players sorted in no particular order
Market Opportunities and Future Outlook
High-purity and engineered conductive grades for batteries, conductive plastics, and functional coatings present a comparatively clearer white space, where qualification hurdles and consistency needs narrow the supplier pool. Recent, in-scope investments point to active capacity additions and product pushes into these higher-margin segments, including Himadri Speciality Chemical commissioning a 70,000 TPA specialty carbon black line in April 2026 (taking its specialty capacity to 130,000 TPA) and PCBL Limited commissioning a 20,000 MTPA specialty carbon black production line at Mundra in June 2026. Together, these actions support a broader portfolio migration away from primarily tire-reinforcement volumes and toward performance-driven applications.
Circular and lower-carbon carbon black also offers an actionable path grounded in certified feedstock pathways and closed-loop projects. Orion S.A. started circular carbon black production at an ISCC PLUS-certified plant in Qingdao in June 2026 using TPO as feedstock, and Pirelli North America initiated a closed-loop tire recycling project in May 2026 that uses ISCC PLUS-certified recovered carbon black supplied by Bolder Industries. In addition, supplier programs such as Birla Carbon's May 2026 launch of Continua 8030 Sustainable Carbonaceous Material (SCM) in the Indian subcontinent show commercialization routes that combine sustainability claims with application performance. This supports premiumization where OEM and compounder procurement increasingly requests traceability and emissions-related documentation.
Recent Industry Developments
- June 2026: Orion S.A. commenced production of circular carbon black grades at its ISCC PLUS-certified Qingdao, China plant using tire pyrolysis oil as feedstock. This expands commercially available circular feedstock pathways for specialty and performance applications and raises the bar for traceability in carbon black procurement across Asia-linked supply chains.
- July 2025: Orion S.A. announced plans to discontinue 3-5 underperforming carbon black production lines in the Americas and EMEA by end of 2025. This rationalization concentrates output in more competitive assets and supports a portfolio shift toward higher-value grades as emissions compliance and operating costs pressure older lines.
- April 2024: Orion S.A. broke ground on a new facility in La Porte, Texas to produce acetylene-based conductive additives. The project strengthens North American supply options for battery-electrode conductive carbons and supports tighter customer qualification cycles in electrification-driven applications.
Research Methodology Framework and Report Scope
Market Definition and Coverage
This market covers the value of carbon black sold for end uses like tires and other rubber goods, plastics, inks and toners, coatings, textile fiber, and other industrial uses. It includes common production routes such as furnace black, gas black, lamp black, and thermal black.
Scope exclusions: We exclude downstream finished products (for example, tires, molded rubber parts, and printed packaging) and count only the carbon black material value.
Segmentation Overview
- By Process Type
- Furnace Black
- Gas Black
- Thermal Black
- Lamp Black
- By Application
- Tire and Industrial Rubber Product
- Plastic
- Toner and Printing Ink
- Coating
- Textile Fiber
- Others
- By Geography
- Asia-Pacific
- China
- India
- Japan
- South Korea
- Thailand
- Rest of Asia-Pacific
- North America
- United States
- Canada
- Mexico
- Europe
- Germany
- United Kingdom
- France
- Italy
- Russia
- Rest of Europe
- South America
- Brazil
- Argentina
- Rest of South America
- Middle-East and Africa
- Saudi Arabia
- United Arab Emirates
- South Africa
- Rest of Middle-East and Africa
- Asia-Pacific
Data Sources, Market Sizing, and Validation
Desk Research
Desk work starts with building a clean view of demand pools and supply signals, and then checking that the story is consistent across regions. Public sources were used to anchor the basic reality of tires, rubber processing, plastics output, and coatings activity, which drive most carbon black consumption.
Sources typically referenced include official industrial and trade statistics (such as UN Comtrade for trade flows), government manufacturing and energy data (such as the US EIA for feedstock-linked indicators), and industrial production series published by national statistics offices. We also use technical and standards context from bodies such as ASTM International, plus peer reviewed papers and patent databases to understand process shifts (including specialty and conductive grades). Company annual reports, investor presentations, and reputable industry press add capacity, outage, and expansion signals, and a paid subscription focused on company financials and another on shipment-level trade helps validate directionally where public series are thin. These examples are not exhaustive, and many other sources were also used for data collection, validation, and clarification.
Primary Interviews and Surveys
Primary discussions were run across producers, distributors, rubber compounders, tire value chain participants, plastics and coatings formulators, and a few equipment and feedstock-linked experts. We used these inputs to confirm which applications are growing faster, how pricing moves with feedstock and grade mix, and where capacity utilization assumptions needed adjustment by region.
Distribution of primary research fieldwork respondents
| Company type | Respondent position | Region |
|---|---|---|
| Top tier: 35% | CXOs: 18% | APAC: 41% |
| Mid tier: 43% | Functional/Unit leaders: 27% | EMEA: 34% |
| Smaller Players: 22% | Managers: 55% | Americas: 25% |
Market-Sizing & Forecasting
Sizing starts with a top-down build where tire output, industrial rubber activity, plastics conversion, inks and coatings production, and trade balances are translated into an implied carbon black demand pool using typical intensity factors and grade splits. Once that first pass is formed, results are cross-checked through selective bottom-up approximations, such as sampling application volumes with representative price bands, doing channel checks for import heavy countries, and sanity testing totals against known regional capacity and utilization ranges.
A few inputs matter more than most and were handled carefully, including feedstock-linked price movements, the share shift between standard and specialty grades, changes in radial tire penetration and replacement cycles, and regional capacity additions with ramp-up timing. When gaps show up in smaller countries, we use proxy indicators like rubber goods output and apparent consumption from trade, and then align the implied per-unit intensity back to expert feedback.
For forecasting, scenario analysis is used, followed by a simple regression check that relates demand to tire and industrial production trends and to observed pricing drivers. Assumptions are then finalized after aligning with what interviewees expect for utilization, specialty adoption, and near-term volatility in key inputs.
Data Validation & Update Cycle
Outputs are checked against independent signals, including whether implied consumption lines up with regional tire and rubber activity, and whether pricing and grade mix behavior matches what is seen in trade and company commentary. If any region shows an unusual jump, the driver is traced back to the underlying variable, and the assumption is reworked or validated again through follow-up calls before sign-off.
A second analyst review is run to confirm math integrity, unit consistency, and that currency handling is applied evenly across time. The dataset is refreshed annually, and interim updates are made when material events occur, such as major capacity changes, policy shifts, or extended outages. Before delivery, a final pass is completed so clients receive the most current view available.
Mordor Intelligence's Carbon Black Market Size Compared Against Other Published Estimates
Published market sizes can vary even when they talk about the same material, because the underlying counting rules are not always aligned. Differences usually come from what gets included in scope, how pricing is treated across grades and regions, and how the base year is chosen when feedstock volatility is high.
The main gap comes from whether specialty and conductive grades are priced and weighted by realistic mix, where Mordor Intelligence ties the value build to application level demand signals and then adjusts average selling prices by region instead of using a single global price trend.
Benchmark comparison
| Source | Market Size | Gaps in Research Methodology |
|---|---|---|
| Mordor Intelligence | USD 25.95 B (2026) | |
| Global Consultancy A | USD 24.50 B (2025) | Uses an earlier base year and can understate value when specialty mix rises, since price normalization is often applied broadly rather than by application and region. |
| Industry Publisher B | USD 28.86 B (2025) | Tends to apply higher blended pricing by combining standard and specialty grades with limited visibility on actual mix, which can lift the headline value versus a demand-led weighting. |
Taken together, the spread is mostly explained by base year choice and how grade mix is translated into pricing. Our approach stays traceable because it starts from end-use demand pools, checks them against supply and trade signals, and only then converts volumes into value using region-aware assumptions.
Key Questions Answered in the Report
How large is the carbon black market in 2026?
The carbon black market size reached USD 25.95 billion in 2026 and is forecasted to reach USD 33.82 billion by 2031.
What CAGR is expected for carbon black through 2031?
The market is projected to grow at a 5.44% CAGR between 2026 and 2031.
Which region leads carbon black consumption?
Asia-Pacific accounted for 61.85% of revenue in 2025 and remains the primary growth engine.
Which application segment is expanding fastest beyond tires?
Coating applications are forecast to post a 6.92% CAGR through 2031 due to rising demand for conductive and UV-protective grades.
What technological shift could disrupt traditional furnace production?
Plasma methane pyrolysis offers low-carbon carbon black and hydrogen coproducts, supported by significant investment such as Monolith Materials’ DOE-backed plant.