Market Overview
| Study Period | 2021 - 2031 |
|---|---|
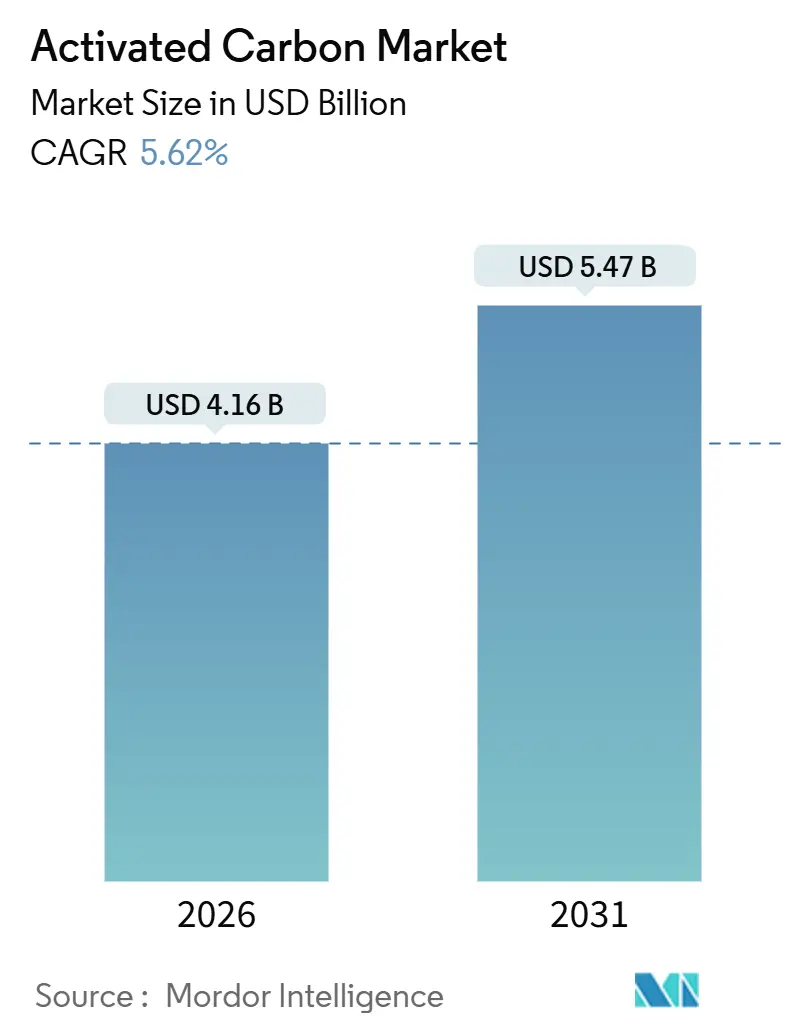
| Market Size (2026) | USD 4.16 Billion |
| Market Size (2031) | USD 5.47 Billion |
| Growth Rate (2026 - 2031) | 5.62% CAGR |
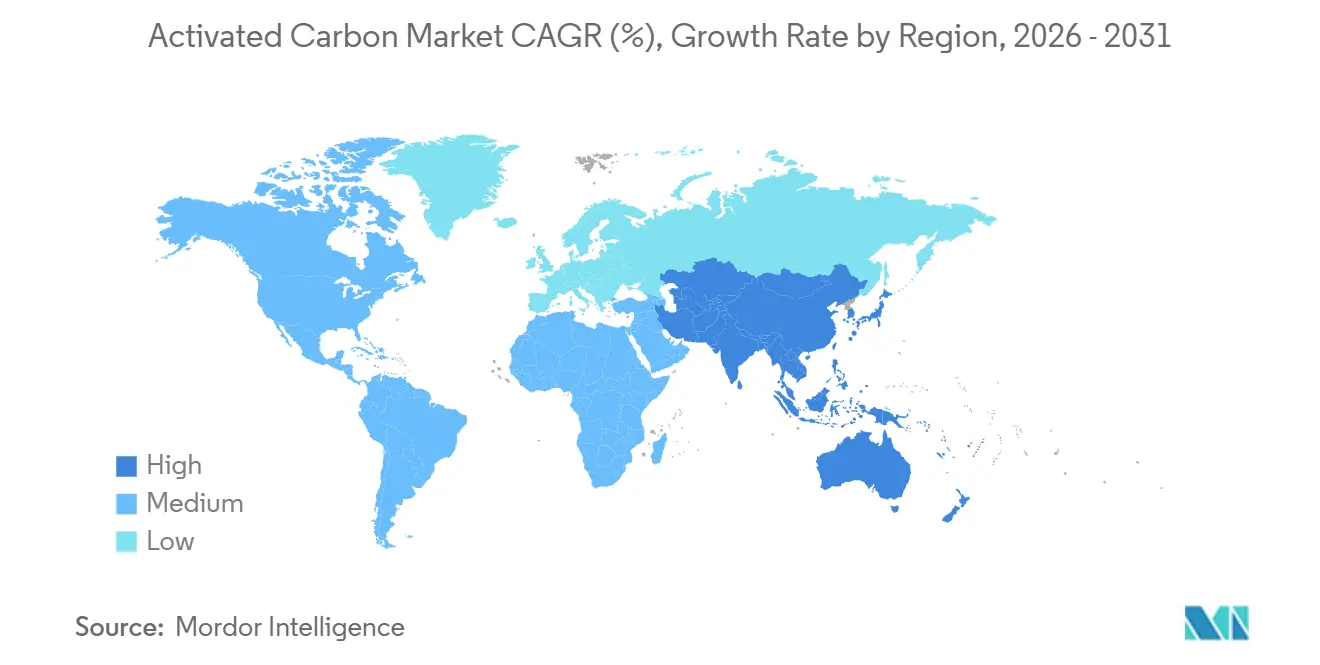
| Fastest Growing Market | Asia Pacific |
| Largest Market | Asia Pacific |
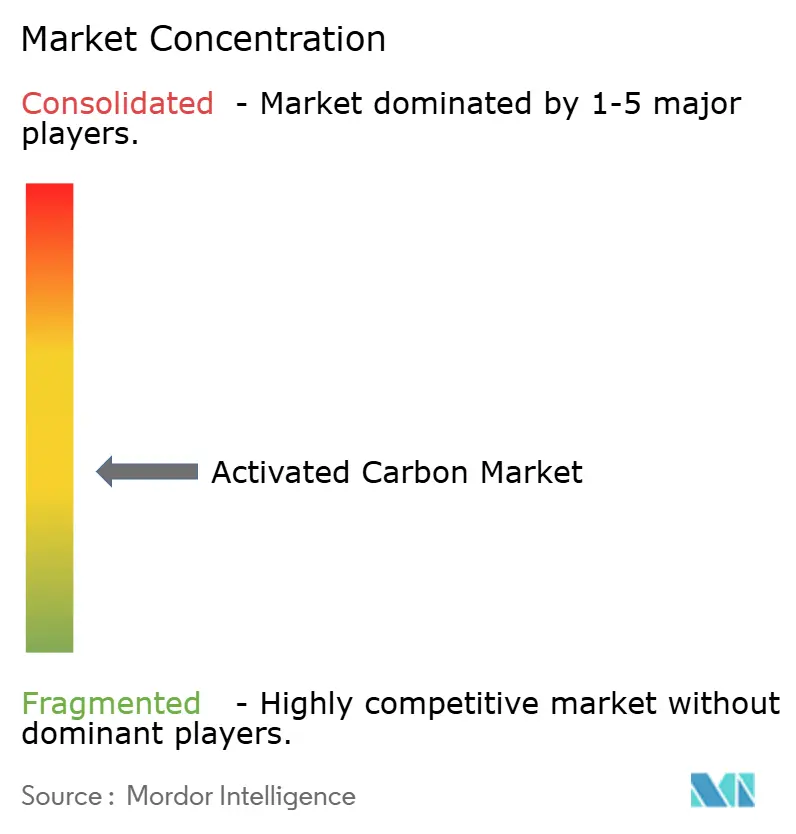
| Market Concentration | Medium |
Major Players *Disclaimer: Major Players sorted in no particular order Image © Mordor Intelligence. Reuse requires attribution under CC BY 4.0. | |
Activated Carbon Market Analysis by Mordor Intelligence
The Activated Carbon Market size is estimated at USD 4.16 billion in 2026, and is expected to reach USD 5.47 billion by 2031, at a CAGR of 5.62% during the forecast period (2026-2031). Tightening water-quality regulations, the rollout of nationwide PFAS remediation programs, and mercury-removal mandates at coal-fired plants are central to this expansion. The U.S. Environmental Protection Agency’s 2024 rule set parts-per-trillion limits for six PFAS compounds, prompting a wave of granular activated carbon (GAC) retrofits across hundreds of utilities. Concurrently, large sugar, chemical, and refining operators are investing in solvent-recovery circuits that rely on high-performance carbons, while municipal buyers strengthen long-term offtake agreements to secure supply. Operators are also shifting from single-use powdered activated carbon (PAC) toward GAC coupled with regional reactivation hubs to cut lifecycle costs. In Asia-Pacific, abundant coal feedstock and expanding coconut-shell charcoal exports keep new capacity online, yet feedstock price swings and weather-driven harvest shocks continue to complicate procurement strategies.
Key Report Takeaways
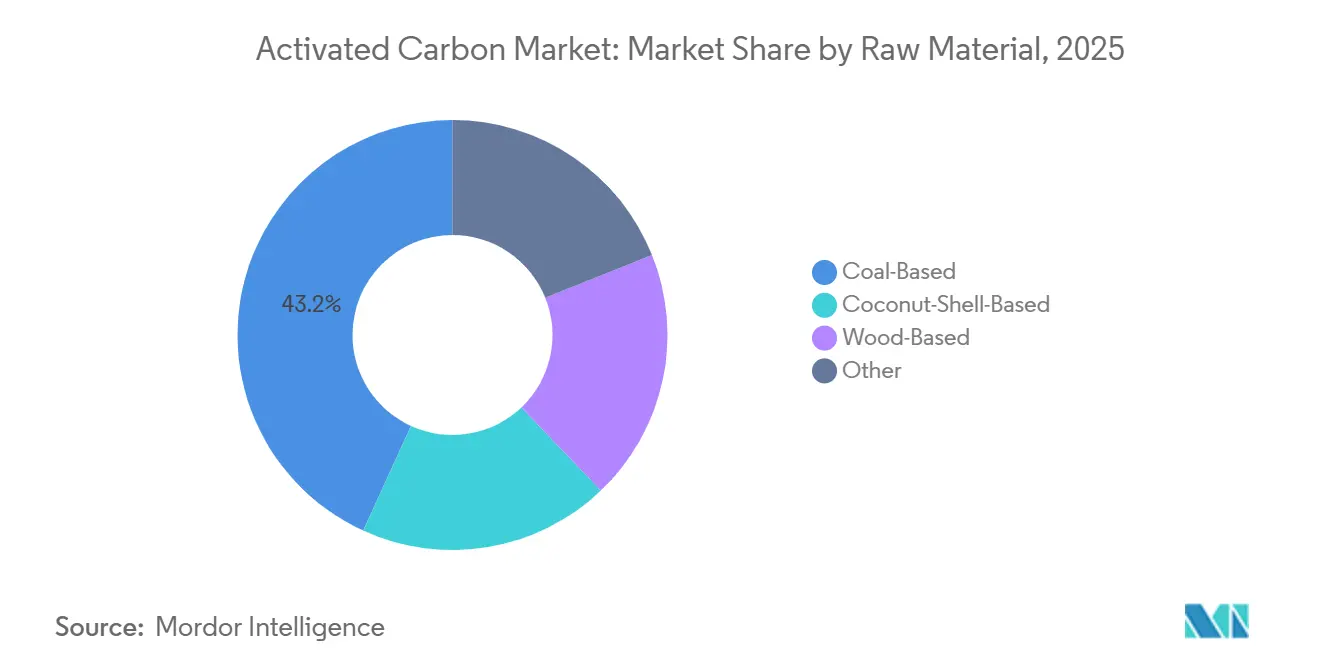
- By raw material, coal-based grades captured 43.18% activated carbon market share in 2025, whereas coconut-shell grades are poised to expand at a 6.78% CAGR through 2031.
- By form, PAC held 47.86% of the activated carbon market size in 2025, yet GAC is advancing at a 6.30% CAGR as utilities invest in reactivation assets.
- By application, drinking-water treatment accounted for 49.04% of demand in 2025; decolorization applications are forecast to grow at a 6.54% CAGR to 2031.
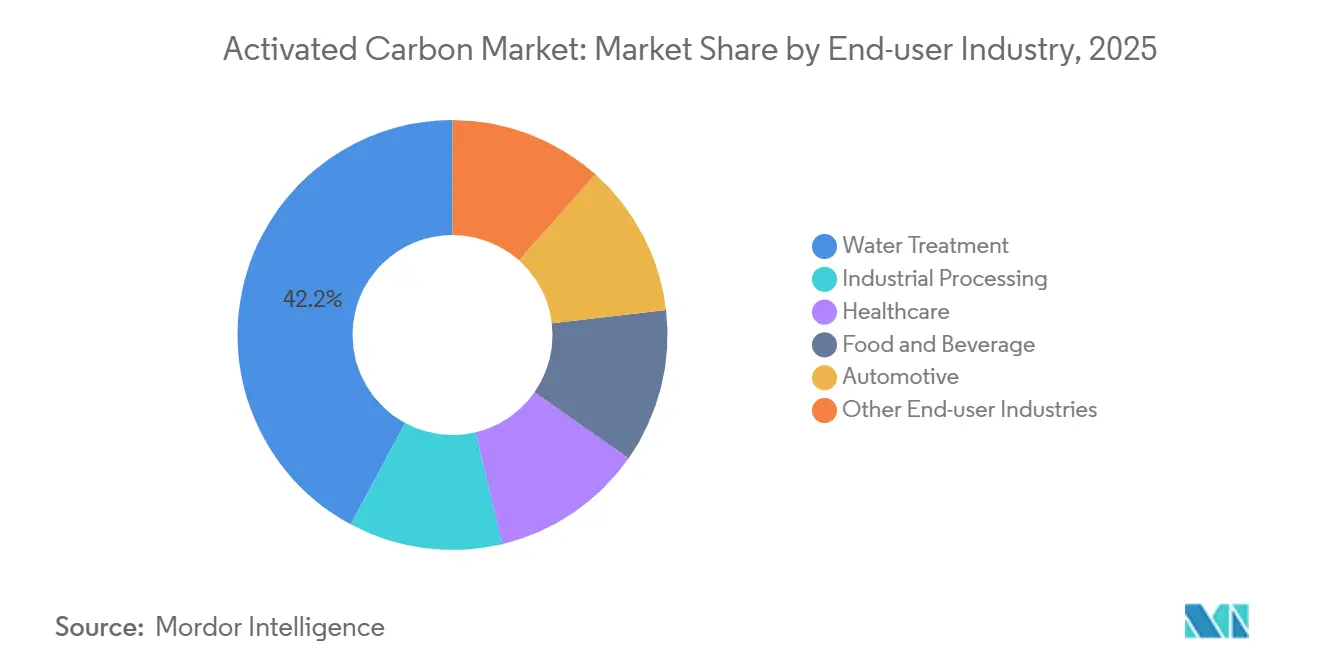
- By end-user industry, water treatment represented 42.15% of 2025 consumption and is set to rise at a 6.58% CAGR, the fastest across all industries.
- By geography, Asia-Pacific led with a 37.72% revenue share in 2025 and is projected to post a 6.44% CAGR through 2031.
Note: Market size and forecast figures in this report are generated using Mordor Intelligence’s proprietary estimation framework, updated with the latest available data and insights as of January 2026.
Global Activated Carbon Market Trends and Insights
Driver Impact Analysis*
| Drivers | (~) % Impact on CAGR Forecast | Geographic Relevance | Impact Timeline |
|---|---|---|---|
| Growing demand for water purification | +1.8% | Global, with acute demand in North America, Europe, and Asia-Pacific urban corridors | Medium term (2-4 years) |
| Mercury-removal mandates for coal-fired plants | +1.2% | North America, Europe, China, India | Long term (≥ 4 years) |
| Surge in low-sulphur fuel regulations boosting solvent-recovery activated carbon | +0.9% | Global maritime hubs; North America, Europe, Asia-Pacific refining centers | Medium term (2-4 years) |
| Increasing biogas upgrading and H₂S scrubbing at small-scale plants | +0.7% | Europe, North America, Asia-Pacific (rural and peri-urban biogas installations) | Short term (≤ 2 years) |
| Growing usage of activated carbon for air purification | +1.0% | Global, with concentration in North America, Europe, and Asia-Pacific industrial and residential markets | Medium term (2-4 years) |
| Source: Mordor Intelligence | |||


Growing Demand for Water Purification
Regulators worldwide continue to ratchet down allowable contaminant thresholds, driving unprecedented investment in high-capacity GAC filters. The EPA’s PFAS rule alone is forcing hundreds of U.S. utilities to lock in multi-year supply contracts, such as American Water’s ten-state deal with Calgon Carbon. European utilities face similar pressure under the updated Drinking Water Directive, while Indian and Chinese municipalities accelerate capacity to meet population-driven demand. The preference is shifting from PAC toward regenerable GAC systems, as operators weigh long-term disposal liabilities against higher up-front capital outlays. Suppliers able to guarantee both virgin supply and reactivation services enjoy a competitive advantage as utilities prioritize circular procurement frameworks.
Mercury-Removal Mandates for Coal-Fired Plants
Revised Mercury and Air Toxics Standards in the United States, coupled with comparable rules in China and India, are reinforcing demand for powdered and impregnated carbons designed for flue-gas injection. Although portions of the coal fleet are retiring, remaining units must upgrade capture systems, sustaining a durable, if regionally uneven, order pipeline. Japan’s strict emission controls add a steady baseline demand despite the country’s broader decarbonization push. Suppliers specializing in brominated or halogenated grades secure premium margins thanks to the technical complexity of long-duration mercury capture.
Surge in Low-Sulphur Fuel Regulations Boosting Solvent Recovery
The IMO 2020 sulphur cap continues to reshape global refining strategies, spurring hydrodesulphurization investments that employ activated carbon to polish solvents and remove VOCs. Industrial solvent users in pharmaceuticals and coatings likewise deploy carbon beds to meet tightening emission ceilings in North America and Europe. Economic payback strengthens the business case: recovered solvents offset fresh feedstock purchases, while spent carbon can be regenerated multiple cycles, lowering total ownership cost. Demand is especially strong in the Asia-Pacific, where a wave of new refining complexes seeks compliance with both local and global fuel standards.
Increasing Biogas Upgrading and H₂S Scrubbing at Small-Scale Plants
Thousands of farm-based digesters and food-waste facilities across Europe retrofit carbon filters to strip hydrogen sulfide and siloxanes before grid injection. Similar projects are being replicated in India and China under rural energy-access programs. Activated carbon offers a low-maintenance alternative to amine scrubbers for plants processing less than 500 Nm³/h of biogas, although frequent media change-outs remain an operating challenge. Suppliers are experimenting with caustic-impregnated and iron-oxide-doped grades that extend breakthrough time and reduce annual replacement volumes.
Restraint Impact Analysis*
| Restraints | (~) % Impact on CAGR Forecast | Geographic Relevance | Impact Timeline |
|---|---|---|---|
| Supply-chain disruption for coconut-shell charcoal | -0.8% | Global, with acute impact in Asia-Pacific (Indonesia, Philippines, Sri Lanka) and ripple effects in North America and Europe | Short term (≤ 2 years) |
| Coal-price volatility squeezing margins | -0.6% | Global, with concentration in China, India, North America, coal-based production hubs | Medium term (2-4 years) |
| High capex for regional reactivation hubs | -0.4% | North America, Europe, Asia-Pacific (urban centers with high GAC consumption) | Long term (≥ 4 years) |
| Source: Mordor Intelligence | |||
Supply-Chain Disruption for Coconut-Shell Charcoal
Weather-related harvest shocks, coupled with export restrictions and competition from alternatives like briquettes, have led to a tightening of coconut-shell charcoal supplies. In 2024, Indonesia saw its exports drop in volume and value. This decline caused prices to surge. In North America and Europe, buyers contended with longer lead times and heightened costs, especially since PFAS removal standards leaned towards coconut-shell grades. While producers are branching out into wood, peat, and low-rank coal precursors, these substitutes fall short in micropore distribution, which is crucial for effective trace-contaminant adsorption. As a result, adept feedstock risk management has emerged as a key differentiator in extensive, multi-year utility tenders.
Coal-Price Volatility Squeezing Margins
Spot coal prices swung sharply in 2024 on the back of supply bottlenecks and geopolitical trade flows, ratcheting up cost pressure for coal-based producers [1]A.A. Ahmad and B.H. Hameed, “Effects of Coal Properties on Activated Carbon Production,” Minerals Engineering, sciencedirect.com . Smaller Chinese and Indian manufacturers struggled to lock in feedstock contracts, while North American plants competed with metallurgical buyers for premium grades. Producers are responding through process optimization-lower activation temperatures, chemical additives, and heat-recovery loops-to curb unit energy consumption. Yet for bulk municipal tenders tied to fixed-price frameworks, the ability to absorb cost spikes remains limited, squeezing margins across the value chain.
*Our forecasts treat driver/restraint impacts as directional, not additive. The impact forecasts reflect baseline growth, mix effects, and variable interactions.
Segment Analysis
By Raw Material: Cost-Efficient Coal Grades and a Coconut-Shell Sustainability Pivot
Coal-derived products retained 43.18% of the activated carbon market share in 2025 because of their favorable cost structure and extensive supply footprints in China, India, and the United States. Coconut-shell-based carbons, while smaller in tonnage, are projected to expand at a 6.78% CAGR as regulators and high-purity users favor their ultrafine micropore network for PFAS and pharmaceutical removal[2]“Market Review of Coconut-Shell Charcoal April 2025,” International Coconut Community, coconutcommunity.org. The activated carbon market size for coconut-shell grades is therefore expected to outpace every other raw-material category through 2031. Feedstock diversification, including pilot work on peat and lignite, is accelerating as suppliers hedge against both coal and coconut price swings.
Producers with multi-feedstock portfolios demonstrated greater resilience during the 2024-2025 coconut-shell shortfall, maintaining contractual volumes by switching to chemically activated wood or low-rank coal blends. Technical papers published in 2024 showed successful ilmenite- and iron-oxide-assisted activation of lignite, yielding iodine numbers comparable to premium coconut carbons. End-use buyers increasingly evaluate lifecycle greenhouse-gas profiles, pushing suppliers to quantify emission intensity across precursor sourcing, activation energy, and reactivation cycles. Coal will remain dominant in cost-sensitive municipal tenders, yet coconut-shell and wood grades are positioned to capture value-added niches where adsorption performance outweighs unit price.


By Form: PAC Scale Versus GAC Circularity Economics
PAC represented 47.86% of the activated carbon market size in 2025, anchored in large-volume sugar, beverage, and batch water-treatment applications that value fast kinetics and straightforward dosing. GAC, however, is forecast to grow at a 6.30% CAGR as utilities embrace on-site or regional reactivation to trim the total cost of ownership. Major suppliers secured permits for new furnaces in Sweden, France, and the U.S. Gulf Coast, underpinning a regional circular economy that reduces haul-back distances and Scope 3 emissions. The activated carbon market sees extruded and pelletized shapes gaining share in flue-gas and automotive evaporative-emission control, where high mechanical strength and low pressure drop are essential.
Lifecycle economics favor GAC, tipping more municipal bidders toward regenerable systems. PAC remains entrenched in sugar decolorization and intermittent batch uses where spent media disposal aligns with existing sludge management practices. Hybrid strategies are emerging: plants dose PAC for shock-load events while maintaining base-flow GAC beds, enabling compliance flexibility without overcapitalizing reactivation assets. Suppliers leveraging both PAC and GAC portfolios can therefore align with diverse customer risk appetites and cash-flow constraints.
By Application: High-Volume Drinking Water and Specialty-Growth Decolorization
Drinking-water plants accounted for 49.04% of 2025 demand, a reflection of the large installed base of municipal infrastructure and urgent PFAS remediation mandates. The activated carbon market size attached to drinking water alone is set for sustained expansion as utilities replace early-generation carbon beds with higher-performance grades optimized for sub-nanogram PFAS capture. Decolorization, led by sugar refineries and certain pharmaceutical streams, is projected to advance at a 6.54% CAGR through 2031. Cane-sugar refineries now predominantly utilize continuous fixed-bed GAC columns, reaching significant heights. These columns achieve effective color removal and reduce carbon loss during backwash cycles.
Beyond these pillars, solvent-recovery loops in chemicals and petrochemicals, PFAS groundwater pump-and-treat systems, and niche uses in microelectronics contribute a growing but fragmented demand profile. Suppliers developing specialty impregnations—for example, alkaline-doped carbons that target 1,4-dioxane—are capturing premium pricing in emerging regulatory hot spots. Overall, the application mix is bifurcated: high-volume, margin-sensitive drinking water secures capacity utilization, while lower-volume specialties deliver outsize profitability.
By End-User Industry: Water Treatment’s Regulatory Tailwind
Water-treatment utilities absorbed 42.15% of global volume in 2025 and are predicted to grow at a 6.58% CAGR, the fastest across all industries. The activated carbon market continues to see multi-year framework agreements, ensuring supply security amid PFAS compliance deadlines. Industrial processors—chemicals, refining, and pharmaceuticals—rank second, leveraging carbon beds for solvent recovery and ultrapure water production. Automotive demand is steady as cabin-filter and evaporative-emission canister specifications tighten in North America, Europe, and China.
Healthcare, food, and beverage users prioritize high-purity carbons with low ash and metal content, supporting niche grades that command price premiums. Emerging applications in energy storage and carbon capture remain small but attract research and development funding, particularly for tailored pore architectures that improve ion transport in supercapacitors. The diversity of end-user needs compels suppliers to maintain broad product catalogs, from cost-efficient coal PAC to silver-impregnated coconut GAC for dialysis.
Geography Analysis
Asia-Pacific retained 37.72% of 2025 revenue and is anticipated to post a 6.44% CAGR through 2031, driven by Chinese coal-to-carbon integration, India’s burgeoning municipal buildout, and ASEAN’s expanding coconut-shell charcoal exports. In 2024, Indian exporters boosted shipments of coconut-shell carbon, with notable exports flowing to the United States, Sri Lanka, and Belgium. Meanwhile, Chinese producers are harnessing coke-oven off-gases to cut down on activation energy costs. Despite wider decarbonization initiatives, Japanese utilities continue to show a strong demand for mercury-control carbons.
North America’s activated carbon market is shaped by PFAS compliance and a decisive pivot toward domestic GAC capacity. Arq commissioned a line in Louisiana during 2025, marking the region’s first vertically integrated virgin-carbon asset. Calgon Carbon expanded Gulf Coast reactivation capacity in 2024 and launched “Operation Bedrock” in 2025 to secure long-term supply for major utilities. Canadian and Mexican buyers benefit from shorter delivery lead times under continental trade agreements.
New reactivation hubs in France, Sweden, and the United Kingdom are cutting spent-carbon shipping distances, underscoring Europe's commitment to circularity. The revised Drinking Water Directive enforces PFAS group limits, prompting capital upgrades analogous to U.S. programs. Germany, Italy, Spain, and the Nordics add incremental demand from biogas upgrading and industrial VOC abatement. South America grows from a low base as Brazil and Argentina expand municipal networks, while the Middle East and Africa see early-stage adoption tied to desalination and gold-processing projects, though volumes remain modest relative to other regions.

Competitive Landscape
The market is moderately fragmented. Established brands compete alongside newer entrants that emphasize vertical integration or low-carbon activation technologies. Suppliers differentiate through three levers. First, feedstock flexibility protects against both coal and coconut price shocks, as evidenced by Haycarb’s ability to redirect orders from Sri Lankan coconut shells to Thai wood chips during 2025 weather disruptions. Second, regional reactivation capacity underpins multi-cycle service contracts, with Jacobi’s French plant and Calgon Carbon’s Gulf Coast furnaces shortening turnaround times to under three weeks. Third, specialty impregnation and pore-engineering capabilities target high-margin niches such as 1,4-dioxane removal and micro-contaminant polishing. Entrants pursue patented activation chemistries and niche pellet formats. Competitive intensity will likely heighten as PFAS-driven demand peaks mid-decade, compelling suppliers to secure long-term offtake and invest in differentiated product lines.
Activated Carbon Industry Leaders
Osaka Gas Chemicals Co., Ltd.
KURARAY CO., LTD.
Haycarb PLC
Norit
Ingevity
- *Disclaimer: Major Players sorted in no particular order

Recent Industry Developments
- July 2025: Jacobi announced a 15–20% price increase on all coconut-shell grades effective July 1, citing sustained raw-material cost inflation.
- May 2024: Arq, Inc., secured its inaugural sales contract, marking the delivery of Granular Activated Carbon (GAC) produced from Arq's proprietary feedstock, a purified bituminous coal waste, at the company's strategically located Red River facility.


Research Methodology Framework and Report Scope
Market Definitions and Key Coverage
Our study defines the activated carbon market as the worldwide revenue generated from new powdered, granular, and extruded carbons obtained by physical or chemical activation of coal, coconut shells, wood, peat, or similar feedstocks and then sold for water and air purification, metal extraction, food processing, medical, automotive, and other industrial uses.
Scope exclusion: Reactivate and reuse services and composite adsorbents containing under 50 percent activated carbon are outside this scope.
Segmentation Overview
- By Raw Material
- Coal-Based
- Coconut-Shell-Based
- Wood-Based
- Other (Peat, Lignite, etc.)
- By Form
- Powdered Activated Carbon (PAC)
- Granular Activated Carbon (GAC)
- Extruded/Pelletised Activated Carbon (EAC)
- By Application
- Decolorisation Treatment
- Sugar Production
- Concentration Treatment
- Solvent Recovery
- PFAS Adsorption Treatment
- Drinking Water Treatment
- Other Applications
- By End-user Industry
- Water Treatment
- Industrial Processing
- Healthcare
- Food and Beverage
- Automotive
- Other End-user Industries
- By Geography
- Asia-Pacifc
- China
- India
- Japan
- South Korea
- ASEAN Countries
- Rest of Asia-Pacific
- North America
- United States
- Canada
- Mexico
- Europe
- Germany
- United Kingdom
- France
- Italy
- Spain
- NORDIC Countries
- Rest of Europe
- South America
- Brazil
- Argentina
- Rest of South America
- Middle-East and Africa
- Saudi Arabia
- South Africa
- Rest of Middle-East and Africa
- Asia-Pacifc
Detailed Research Methodology and Data Validation
Primary Research
Structured interviews and surveys with plant engineers, activated carbon distributors, municipal water utilities, and regional environmental regulators across Asia-Pacific, North America, and Europe allowed us to validate secondary numbers, sense-check average selling prices, and gauge regulatory adoption timelines. Feedback loops with technical consultants helped refine adsorption efficiency assumptions in niche end uses.
Desk Research
We began with open datasets that quantify production, trade, and consumption, including UN Comtrade HS-3802 export flows, U.S. EPA Toxic Release Inventory, Eurostat industrial water directives, China MEE emission bulletins, and statistics from the International Water Association. Company filings, investor decks, and reputable press articles were mined to benchmark corporate sales and new plant capacities. Mordor analysts also tapped paid repositories such as D&B Hoovers for supplier financials, Dow Jones Factiva for deal tracking, Volza for shipment-level verifications, and Questel for patent velocity around water treatment media. These sources created the factual spine; many additional references supported day-to-day fact-checks, though they are not all listed here.
Market-Sizing and Forecasting
Our model starts with a top-down reconstruction of global demand using production output and import-export balances, which are then mapped to end-use sectors through penetration ratios derived from installed purification capacity and mercury-control mandates. Supplier roll-ups and channel checks provide a selective bottom-up cross-test, letting us adjust totals where distributor margins or captive consumption skew the headline. Key variables tracked include PFAS compliance deadlines, mercury emission standards in coal plants, municipal desalination investments, coconut-shell charcoal price indices, and average PAC versus GAC selling prices. A multivariate regression, informed by GDP and water-infrastructure spending outlooks, projects each driver before results are blended into scenario curves and stress-tested with industry experts.
Data Validation and Update Cycle
Outputs pass variance screens, outlier flags, and peer review before sign-off. Reports refresh annually; interim updates are triggered by material events such as large capacity additions or sudden regulatory changes. A last-mile analyst review ensures clients always receive the freshest view.
Why Mordor's Activated Carbon Baseline Commands Reliability
Published estimates often diverge because firms choose different material cut-offs, bundle services, or apply blanket growth rates. By matching scope to virgin carbons only and layering regulatory milestones onto trade-verified baselines, we keep figures anchored in observable reality.
Key gap drivers include: some studies merge reactivation revenues, others apply aggressive air-purifier rollouts without cross-checking capacity additions, and several translate supplier sales at list rather than transacted prices, inflating totals. Our tighter scope, annual refresh cadence, and dual-path validation reduce those distortions.
Benchmark comparison
| Market Size | Anonymized source | Primary gap driver |
|---|---|---|
| USD 4.58 Bn | Mordor Intelligence | - |
| USD 4.07 Bn | Global Consultancy A | Excludes pelletized grades; lifts 2024 base straight-line to 2025 |
| USD 5.62 Bn | Global Consultancy B | Bundles reactivation services and charcoal supplements; limited primary checks |
In short, the disciplined scope selection, transparent variable tracking, and frequent model refresh that Mordor analysts follow yield a balanced, decision-ready baseline clients can trust.


Key Questions Answered in the Report
How fast is the activated carbon market projected to grow from 2026-2031?
It is forecast to expand at a 5.62% CAGR, increasing from USD 4.16 billion in 2026 to USD 5.47 billion by 2031.
Which raw material category is expected to record the fastest growth?
Coconut-shell-based grades are poised to rise at a 6.78% CAGR, supported by PFAS and pharmaceutical purification needs.
Why are utilities shifting from powdered to granular activated carbon?
GAC can be thermally reactivated three to five times, cutting lifecycle costs and waste volumes for high-throughput plants.
Which region leads global demand?
Asia-Pacific held 37.72% revenue share in 2025, thanks to Chinese capacity and India’s municipal buildout.
How will the price volatility of coconut-shell charcoal affect supply?
Tight feedstock availability and rising prices push buyers to diversify into wood and coal precursors or lock in multi-year contracts.
Page last updated on:


