Market Overview
| Study Period | 2021 - 2031 |
|---|---|
| Forecast Data Period | 2026 - 2031 |
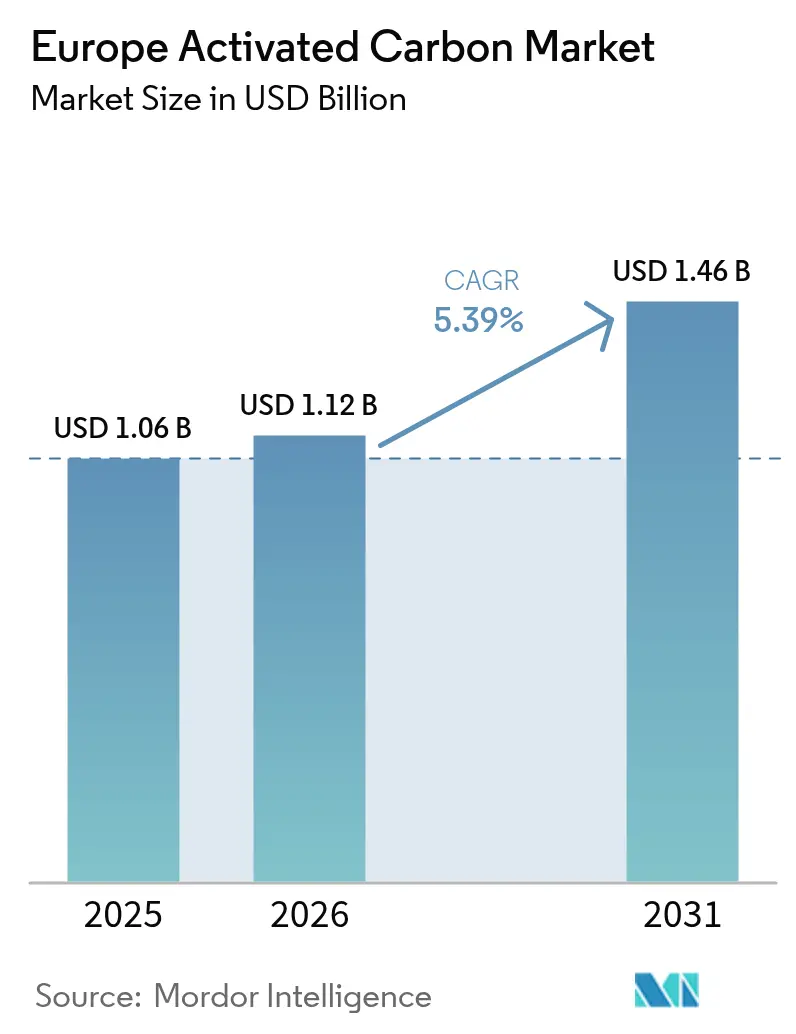
| Base Year Market Size (2025) | USD 1.06 Billion |
| Market Size (2026) | USD 1.12 Billion |
| Market Size (2031) | USD 1.46 Billion |
| Growth Rate (2026 - 2031) | 5.39% CAGR |
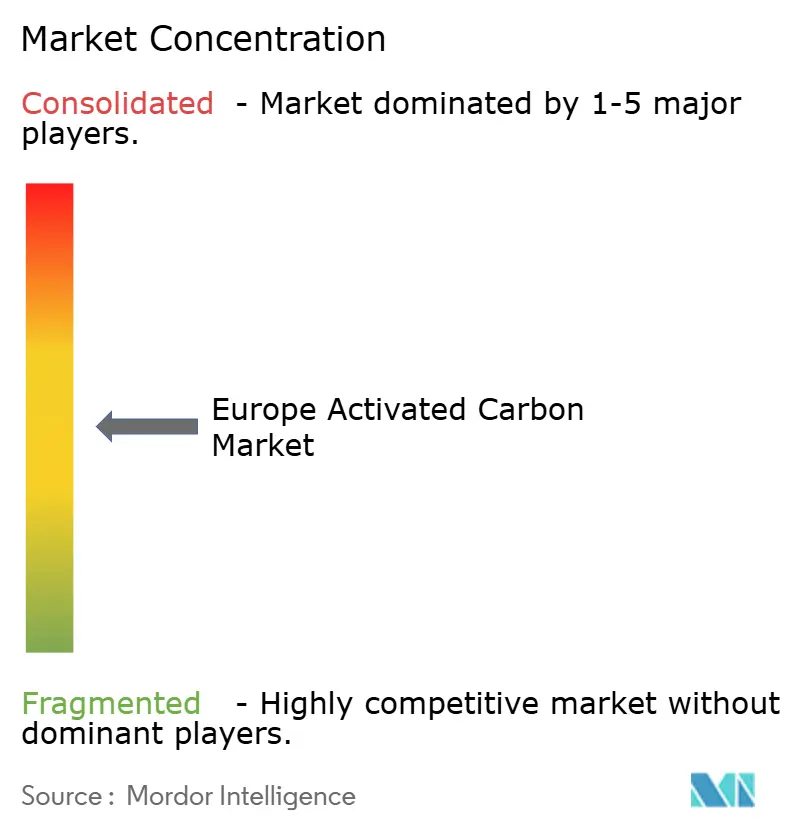
| Market Concentration | Medium |
Major Players *Disclaimer: Major Players sorted in no particular order Image © Mordor Intelligence. Reuse requires attribution under CC BY 4.0. | |
Europe Activated Carbon Market Analysis by Mordor Intelligence
The Europe Activated Carbon Market size is projected to be USD 1.06 billion in 2025, USD 1.12 billion in 2026, and reach USD 1.46 billion by 2031, growing at a CAGR of 5.39% from 2026 to 2031. Persistent tightening of water-quality directives, rising scrutiny of industrial flue-gas emissions, and embedded-carbon disclosure rules are combining to lift baseline demand across utilities, process industries, and specialty-chemical segments. The new 0.10 µg/L limit for a group of 20 PFAS compounds under the revised Drinking Water Directive that came into force in January 2026 has already forced municipal operators in Germany, France, and the Netherlands to accelerate procurement cycles, often layering powdered or granular activated carbon into existing trains rather than waiting for scheduled media changeouts. Coal- and biomass-fired power plants are following a similar compliance arc after the 2024 BAT conclusions under the Industrial Emissions Directive lowered permissible mercury in flue gas to 1 µg/Nm³, a threshold that is driving adoption of brominated PAC injection systems. At the same time, the Carbon Border Adjustment Mechanism (CBAM) is widening the landed-cost gap between coal-based imports and lower-carbon coconut- or wood-based grades, reshaping sourcing strategies for utilities and beverage fillers alike. Taken together, these regulatory moves reinforce a structural uptrend in the Europe activated carbon market, even as feedstock price swings and early-stage biochar substitutes inject episodic volatility.
Key Report Takeaways
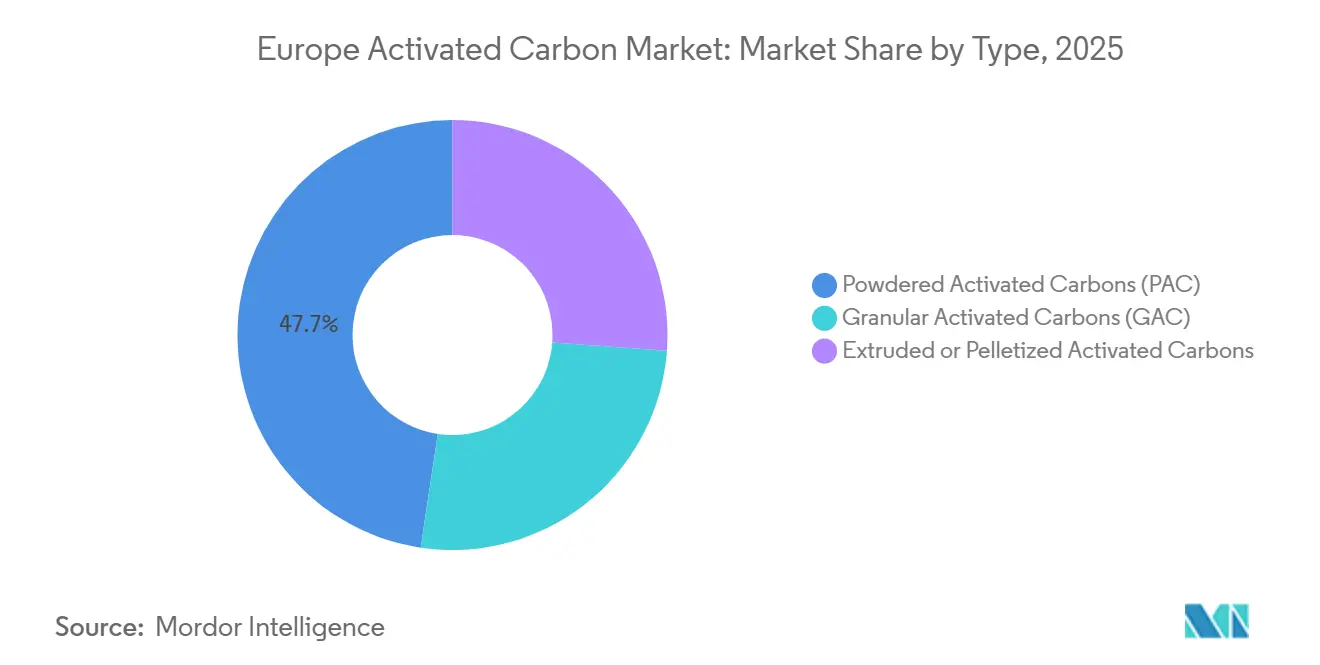
- By product type, Powdered Activated Carbon (PAC) held 47.63% of the Europe activated carbon market share in 2025 and is projected to expand at a 5.67% CAGR through 2031.
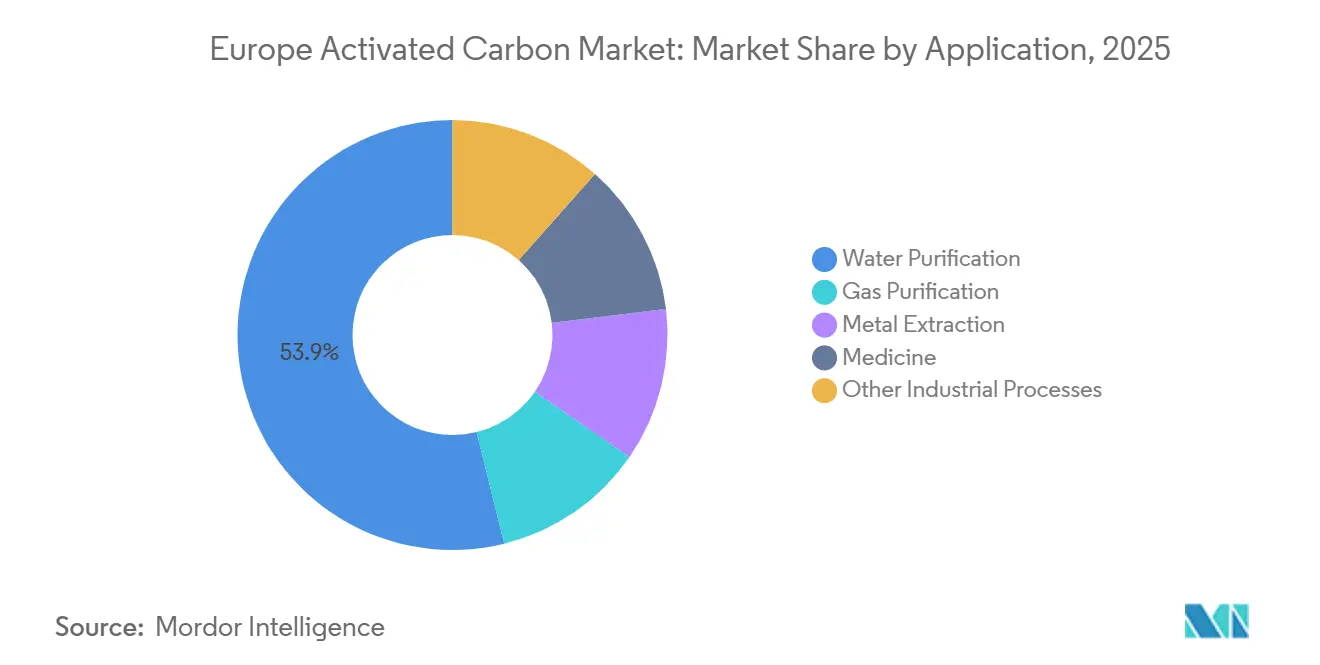
- By application, water purification commanded 53.87% of the Europe activated carbon market size in 2025, while medicine applications record the highest projected CAGR at 6.81% to 2031.
- By geography, Germany accounted for 31.99% revenue share in 2025; the country is advancing at a 5.92% CAGR through 2031.
Note: Market size and forecast figures in this report are generated using Mordor Intelligence’s proprietary estimation framework, updated with the latest available data and insights as of 2026.
Europe Activated Carbon Market Trends and Insights
Drivers Impact Analysis*
| Driver | (~) % Impact on CAGR Forecast | Geographic Relevance | Impact Timeline |
|---|---|---|---|
| Surging demand from municipal water utilities | +1.2% | Germany, France, Netherlands, Belgium | Short term (≤ 2 years) |
| Mercury-emissions cap in coal & biomass co-firing | +0.9% | Germany, Poland, Czech Republic | Medium term (2-4 years) |
| Rising PFAS removal mandates in groundwater | +1.5% | Germany, Netherlands, Denmark, Sweden | Short term (≤ 2 years) |
| Regenerative carbon-reactivation service contracts gaining traction | +0.6% | Germany, France, UK, Italy | Medium term (2-4 years) |
| Expansion of European beer & hard-seltzer filtration lines | +0.4% | Germany, Belgium, UK, Czech Republic | Long term (≥ 4 years) |
| Source: Mordor Intelligence | |||
Surging Demand From Municipal Water Utilities
Utility buyers are front-loading orders to comply with the 2026 Drinking Water Directive, which fixes a binding deadline of January 2029 for PFAS monitoring and removal. Germany’s Federal Environment Agency disclosed in December 2025 that 23% of sampled groundwater wells already exceed the 0.10 µg/L ceiling, prompting emergency tenders across Bavaria and Hesse[1]Umweltbundesamt, “PFAS Groundwater Monitoring Report 2025,” umweltbundesamt.de. French operator Veolia committed EUR 85 million to retrofit 14 plants with fresh GAC beds and PAC-dosing skids, explicitly citing the inability of legacy media to meet short-chain PFAS targets. Supply-chain lead times have lengthened into Q3 2026, and product specifications now emphasize mesoporous carbons derived from coconut shell, which show higher uptake for four-carbon PFBA molecules. The ripple effect is a measurable uplift in spot pricing for both PAC and GAC, yet utilities appear willing to pay the premium because regulatory penalties for non-compliance can reach EUR 500,000 per incident. This dynamic injects near-term momentum into the Europe activated carbon market while foregrounding the importance of agile dosing technologies.
Mercury-Emissions Cap in Coal & Biomass Co-Firing
The 2024 BAT conclusions slashed mercury limits for large combustion plants above 300 MW th, compelling operators to double or even triple PAC injection rates. Poland’s PGE Energia is now consuming 1,200 t of brominated PAC annually across Bełchatów and Turów to hold stack concentrations below 1 µg/Nm³. RWE’s Neurath lignite complex followed a similar path, scaling injection equipment and entering multi-year supply contracts with specialty carbon vendors. Bromination raises unit prices by 30%–40%, but life-cycle cost models still favor PAC over catalytic sorbents when carbon-allowance expenses under the EU-ETS are factored in. Smaller biomass co-firing units confront the same threshold; their inherently lower baseline mercury is offset by wide variability in feedstock, forcing continuous PAC dosing as a guardrail. The upshot is sustained, moderately counter-cyclical demand that shores up revenue diversity inside the Europe activated carbon market.
Rising PFAS Removal Mandates in Groundwater
Beyond the drinking-water sphere, the European Chemicals Agency is finalizing a broad PFAS restriction that will push industrial property owners to remediate legacy hotspots between 2026 and 2031. The Dutch Ministry of Infrastructure and Water Management reported in June 2025 that 18 chemical sites near Dordrecht and Rotterdam have already installed pump-and-treat systems using coconut-shell GAC, totaling about 800 t of annual carbon throughput. Denmark’s Environmental Protection Agency ordered cleanup at 12 firefighting-training areas, again specifying high-micropore GAC for PFOA and PFOS sorption. Because such groundwater projects often run 5–10 years, they establish a predictable replacement cadence that insulates providers from short-term commodity swings. The backlog of remediation projects should therefore keep the Europe activated carbon market on a firm growth path even if municipal budgets temporarily tighten.
Regenerative Carbon-Reactivation Service Contracts Gaining Traction
Thermal reactivation at 800–900°C recovers 85%–95% of spent carbon mass, a metric that now carries financial heft as waste-disposal fees surpass EUR 150/t in Germany and the Netherlands. Desotec logged a 22% jump in reactivation contracts during 2025, citing pharmaceutical and chemical customers eager to lower Scope 3 footprints. Calgon Carbon introduced a subscription-style “Carbon-as-a-Service” bundle that converts capital outlays into operating costs and embeds real-time tracking for CSRD reporting. Contract lengths are stretching to 3–5 years, smoothing revenue visibility for suppliers and reducing spot-market volatility. As more corporates adopt internal carbon-pricing schemes, reactivation is expected to graduate from a cost-avoidance tool into a mainstream procurement norm, further undergirding the Europe activated carbon market.
Restraints Impact Analysis*
| Restraint | (~) % Impact on CAGR Forecast | Geographic Relevance | Impact Timeline |
|---|---|---|---|
| Price volatility of coconut-shell & coal feedstocks | -0.8% | Europe-wide, acute in Germany, France, UK | Short term (≤ 2 years) |
| Availability of engineered biochar substitutes | -0.3% | Germany, Netherlands, Sweden | Medium term (2-4 years) |
| Carbon Border Adjustment Mechanism cost on coal-based grades | -0.5% | Import-dependent markets: Italy, Spain, Poland | Medium term (2-4 years) |
| Source: Mordor Intelligence | |||
Price Volatility of Coconut-Shell & Coal Feedstocks
Typhoon Mawar and Cyclone Mocha disrupted coconut-shell supply chains in 2025, slashing Sri Lankan charcoal exports by 24% and sending Rotterdam PAC spot prices from EUR 2,100/t in January to EUR 2,480/t by September[2]Sri Lanka Export Development Board, “Coconut Charcoal Export Statistics 2025,” edb.gov.lk. Parallel spikes in anthracite followed TTF gas futures upward; when gas touched EUR 45/MWh in December 2025, anthracite climbed 14% month on month. Because coconut and coal markets are uncorrelated and lack hedging instruments, suppliers had little room to offset squeezes, narrowing gross margins across the Europe activated carbon industry. Utilities on fixed-price tenders bore the brunt, occasionally invoking force-majeure clauses to recover costs.
Carbon Border Adjustment Mechanism Cost on Coal-Based Grades
Full CBAM enforcement on 1 January 2026 now taxes embedded CO₂ at the EU-ETS price, adding EUR 300–350/t to Chinese coal-based carbon imports with a 4 t CO₂e footprint. Italian and Spanish processors that once sourced half their volumes from Asia are pivoting to coconut-shell or EU-made wood grades. This split is manifesting in a two-tier market: premium low-carbon grades for CBAM-exposed segments and legacy coal grades for less-regulated niches. The phenomenon is already redirecting capital toward European expansion projects and reinforcing the long-term resilience of the Europe activated carbon market.
*Our forecasts treat driver/restraint impacts as directional, not additive. The impact forecasts reflect baseline growth, mix effects, and variable interactions.
Segment Analysis
By Product Type: PAC’s Dosing Agility Captures Municipal Surge
Powdered activated carbon controlled 47.65% of revenue in 2025, and its share of the Europe activated carbon market size is projected to increase steadily at a 5.67% CAGR to 2031. Water utilities value the ability to spike PAC directly into clarifiers within hours of detecting river-borne PFAS or geosmin episodes, a flexibility unattainable with fixed-bed GAC systems. Veolia’s 2025 tender demanded 48-hour delivery for 3,200 t of PAC, underscoring how supply-chain responsiveness has become a procurement criterion. GAC, although slower growing, remains the backbone for continuous remediation and industrial reuse loops; Netherlands-based Waternet cut annual carbon consumption by 35% after switching a major plant to GAC despite paying EUR 4 million in upfront capex. Extruded and pelletized grades retain a smaller share but are indispensable in gas-phase VOC recovery where low pressure drop matters. Cabot’s launch of a wood-based pellet with 1,100 m²/g surface area offered a CBAM-friendly alternative and illustrates feedstock migration trends. This product mix evolution reinforces the depth of the Europe activated carbon market.


By Application: Medicine Segment Outpaces Legacy Water Uses
Water purification remained dominant at 53.87% of 2025 turnover, yet medicine is the breakout category, growing at 6.81%. The European Medicines Agency tightened heavy-metal limits in APIs in 2024, compelling drug makers to polish intermediates with ultrapure PAC. Merck KGaA now draws roughly 120 t per year of pharmaceutical-grade PAC across two German sites. Over-the-counter oral detoxification tablets gained two ANSM approvals in 2025, expanding retail channels in France. Gas purification applications are growing in lockstep with mercury and VOC constraints, while nascent energy-storage uses remain small but technically demanding, positioning suppliers like Ingevity, developing 1,800 m²/g capacitor carbons, for differentiated growth. Together, these dynamics widen the opportunity set embedded in the Europe activated carbon market.
Geography Analysis
Germany cemented its pre-eminence in the Europe activated carbon market by accounting for 31.99% of 2025 revenue and charting a 5.92% CAGR to 2031. Emergency PFAS tenders exceeding 1,800 t of combined PAC and GAC in Bavaria and Hesse, coupled with 1,200 t of brominated PAC for mercury abatement in lignite plants, have made the country the region’s single largest offtake node. Reactivation infrastructure, such as Donau Carbon’s 12,000 t/yr facility in Offenbach, further binds German buyers to local supply chains, reducing CBAM exposure and shortening turnaround cycles.
The United Kingdom and France trail closely, each propelled by distinctive catalysts. The UK’s Environment Agency imposed a precautionary PFAS cap on 47 compounds, triggering retrofit programs at Thames Water and Severn Trent. France, meanwhile, tightened PFAS limits in bottled water, prompting premium brands in the Auvergne-Rhône-Alpes basin to install PAC stages. Spain and Italy, smaller in absolute volume, are expanding faster in pharmaceutical and food uses, respectively; Spanish biosimilar plants lifted USP-grade carbon demand by 14% in 2025, while Italian wineries reported a jump in activated-carbon fining from 8% to 12% of members since 2023.
Nordic nations exemplify the sustainability edge of the Europe activated carbon market. Denmark’s mandate covering 12 firefighting-training sites and Sweden’s survey of 27 contaminated areas lock in priority for coconut-shell GAC, prized for lower Scope 3 emissions. Eastern Europe, led by Poland’s coal fleet, is the epicenter for brominated PAC, where 1,200 t/yr goes solely to PGE Energia plants. Although compliance deadlines narrow geographic spread in regulatory standards, local industrial mixes continue to set divergent growth arcs, ensuring that the overall Europe activated carbon market remains geographically diversified.
Competitive Landscape
The Europe Activated Carbon market is moderately fragmented. Service innovation is rising as a competitive wedge. Jacobi’s low-temperature reactivation patent claims a 25% energy cut, a saving likely to resonate with Scope 3-aware clients. Calgon Carbon’s “Carbon-as-a-Service” converts capex to opex and feeds real-time compliance dashboards. Regional specialists, Desotec, CarboTech, Donau Carbon, exploit mobile reactivation fleets that shrink downtime and cut waste-handling fees.
Europe Activated Carbon Industry Leaders
Desotec
Donau Carbon GmbH
JACOBI CARBONS GROUP
Calgon Carbon Corporation
Cabot Corporation
- *Disclaimer: Major Players sorted in no particular order

Recent Industry Developments
- November 2025: The French government, through its initiative INNOV’EAU, aimed at bolstering innovation in the water sector, chose the Carb’eau project for support. Carb’eau is pioneering a plant-based activated carbon, produced in France, to lessen the environmental impact of a key material used in water treatment.
- January 2025: AdFiS products GmbH initiated a research and development program aimed at electrifying steam-activation stages to boost energy efficiency and pave the way for future low-carbon kilns.


Europe Activated Carbon Market Report Scope
Activated carbon is a form of carbon processed with small, low-volume pores that increase the surface area for adsorption or chemical reactions. Usually, activated carbon is extracted from charcoal.
Europe's Activated Carbon Market is segmented by product type, application, and geography. By product type, the market is segmented into powdered activated carbon, granular activated carbon, and extruded or pelletized activated carbon. By application, the market is segmented into gas purification, water purification, metal extraction, medicine, and other industrial processes. The report also covers the market sizes and forecasts for the activated carbon market in 5 countries across the European region. Each segment's market sizing and forecasts are based on revenue (USD).
By Product Type
| Powdered Activated Carbon (PAC) |
| Granular Activated Carbon (GAC) |
| Extruded / Pelletized Activated Carbon |
By Application
| Water Purification |
| Gas Purification |
| Metal Purification |
| Medicine |
| Other Industrial Processes (solvent recovery and energy storage) |
By Geography
| Germany |
| United Kingdom |
| France |
| Italy |
| Spain |
| Rest of Europe |
| By Product Type | Powdered Activated Carbon (PAC) |
| Granular Activated Carbon (GAC) | |
| Extruded / Pelletized Activated Carbon | |
| By Application | Water Purification |
| Gas Purification | |
| Metal Purification | |
| Medicine | |
| Other Industrial Processes (solvent recovery and energy storage) | |
| By Geography | Germany |
| United Kingdom | |
| France | |
| Italy | |
| Spain | |
| Rest of Europe |


Key Questions Answered in the Report
How large will European demand for activated carbon be by 2031?
The Europe activated carbon market size is forecast to climb to USD 1.46 billion by 2031, expanding at a 5.39% CAGR from 2026.
Which product type is expected to grow fastest?
Powdered activated carbon is projected to rise at a 5.67% CAGR through 2031, benefiting from rapid-dose flexibility valued by water utilities.
Why is medicine the fastest expanding application?
Stricter EMA limits on elemental impurities in pharmaceuticals require ultrapure PAC polishing, pushing medicine demand to a 6.81% CAGR.
How does CBAM affect buying patterns?
The surcharge on coal-based imports adds 10%–12% to landed cost, steering many buyers toward coconut- or wood-based grades with lower embedded carbon.
Which country dominates regional consumption?
Germany leads with 31.99% of 2025 revenue and maintains momentum due to simultaneous PFAS and mercury-abatement programs.
Page last updated on:


