Carbonization Furnace Market Size and Share
Market Overview
| Study Period | 2021 - 2031 |
|---|---|
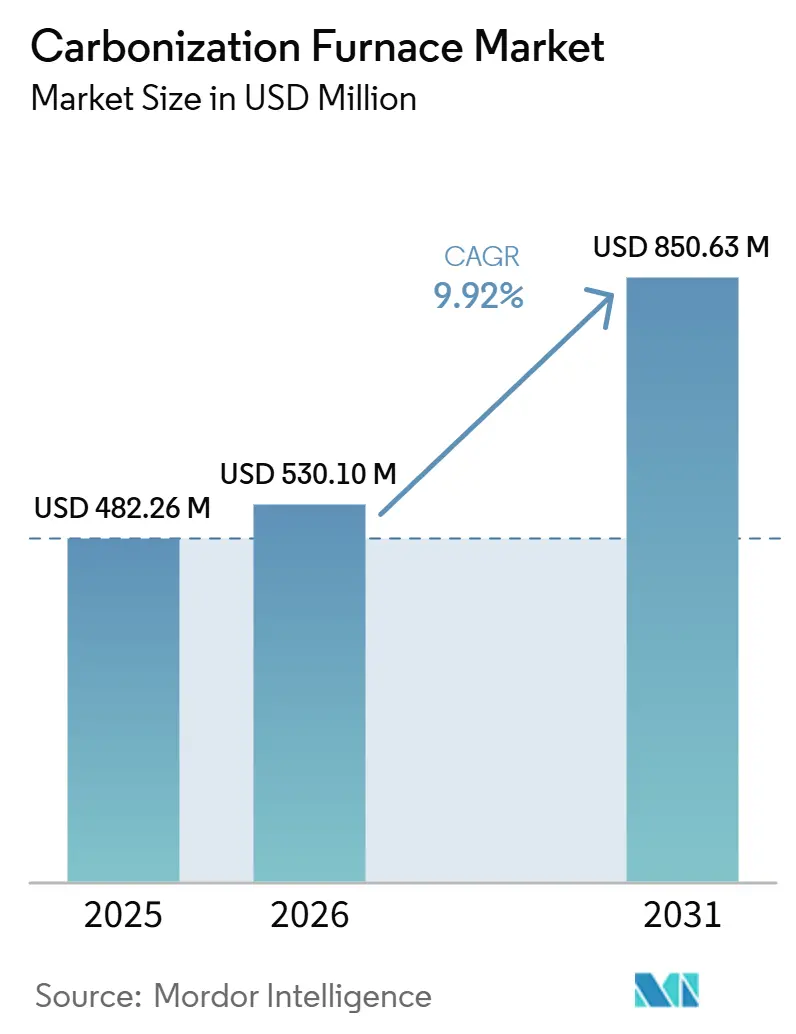
| Market Size (2026) | USD 530.10 Million |
| Market Size (2031) | USD 850.63 Million |
| Growth Rate (2026 - 2031) | 9.92% CAGR |
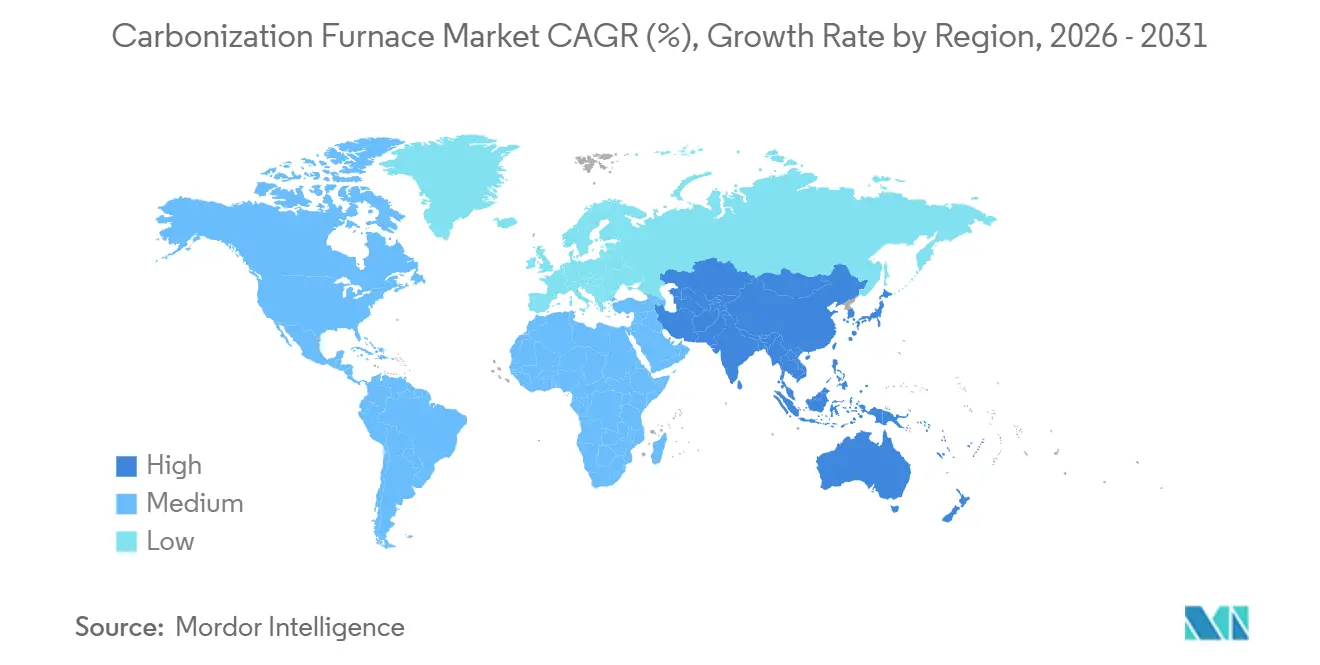
| Fastest Growing Market | Asia Pacific |
| Largest Market | Asia Pacific |
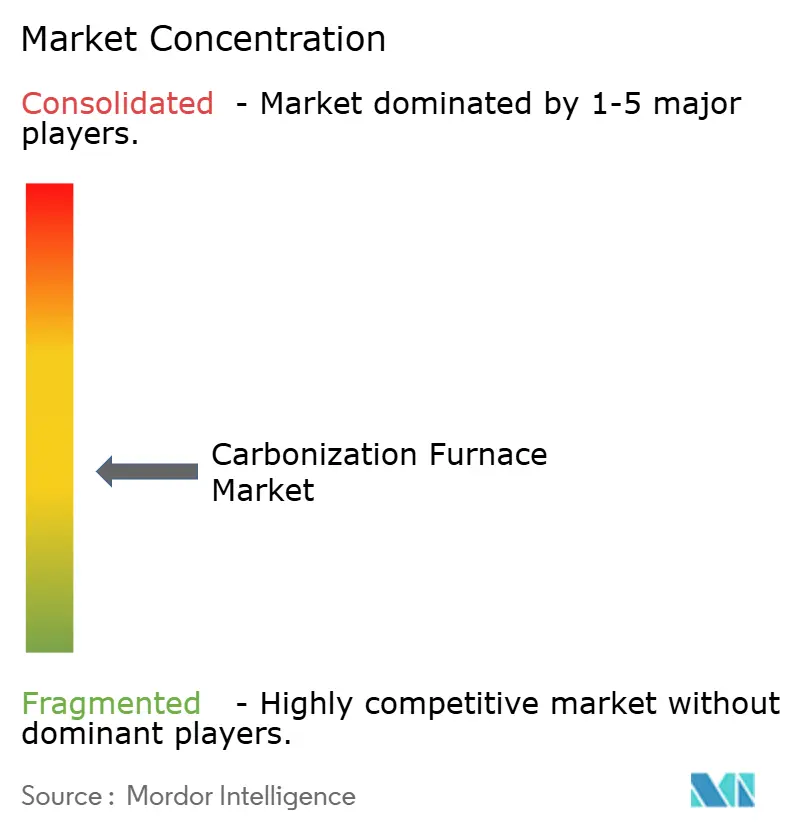
| Market Concentration | Medium |
Major Players *Disclaimer: Major Players sorted in no particular order Image © Mordor Intelligence. Reuse requires attribution under CC BY 4.0. | |
Carbonization Furnace Market Analysis by Mordor Intelligence
The Carbonization Furnace Market size is expected to grow from USD 482.26 million in 2025 to USD 530.10 million in 2026 and is forecast to reach USD 850.63 million by 2031 at 9.92% CAGR over 2026-2031. Investment priorities are being influenced by favorable biomass policies, increasing biochar-credit prices, and a transition toward continuous furnaces. Producers are identifying biomass residues as assets with dual revenue streams: saleable charcoal products and tradable carbon-removal credits. This approach resulted in 1.6 million tons of verified biochar removals in the first half of 2025 alone. Operators in the Asia-Pacific region are leveraging India's 7% biomass co-firing mandate and China's 10 gigawatt (GW) retrofit target. Meanwhile, stakeholders in North America and Europe are focusing on wildfire mitigation and obtaining compliance-grade carbon credits. Equipment suppliers offering artificial intelligence (AI)-driven process control combined with emissions-monitoring services are achieving pricing advantages, while Chinese manufacturers compete on lower capital costs. However, challenges are anticipated. New hazardous air pollutant limits in the United States and the January 2026 reclassification of biochar under the International Maritime Dangerous Goods (IMDG) Code are expected to increase compliance and freight costs.
Key Report Takeaways
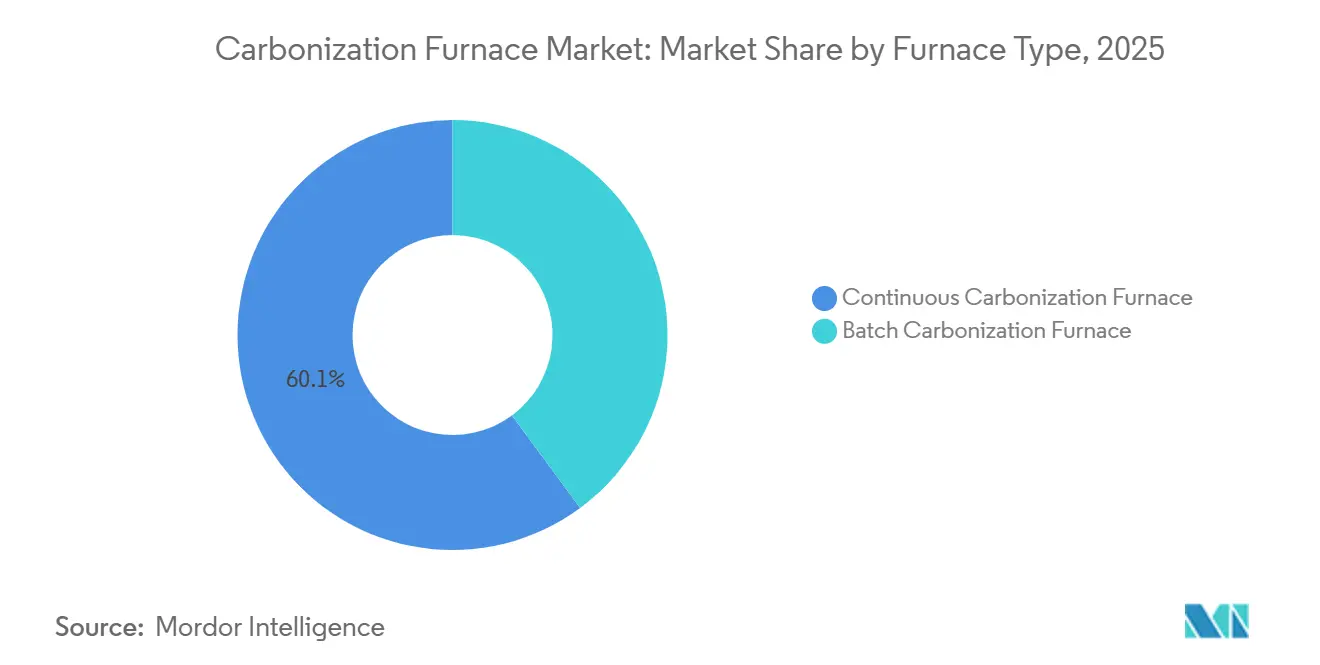
- By furnace type, the Continuous Carbonization Furnace held 60.12% of the carbonization furnace market share in 2025, and this same category is projected to expand at 10.34% CAGR through 2031.
- By feedstock, wood retained 31.78% share of the carbonization furnace market size in 2025, while coconut shell is advancing at a 10.66% CAGR through 2031.
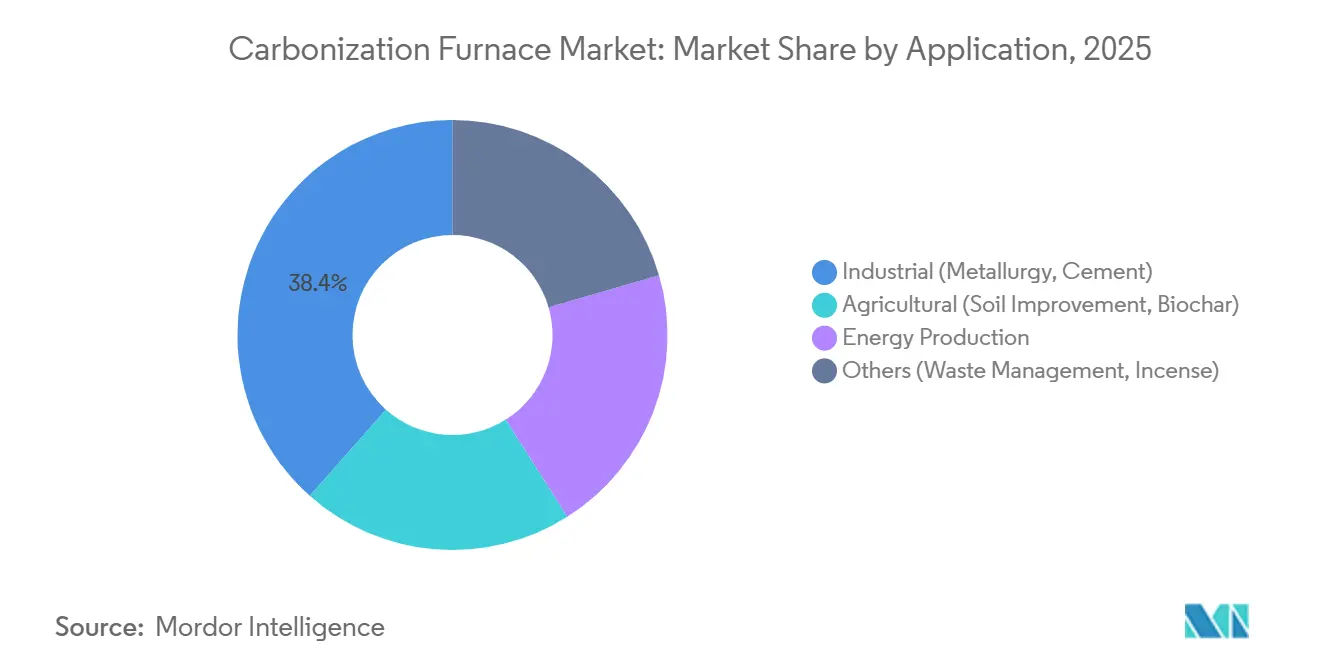
- By application, industrial end users led with 38.44% revenue share in 2025, whereas agricultural biochar is forecast to expand at a 10.66% CAGR to 2031.
- By geography, Asia-Pacific commanded 46.11% revenue in 2025 and is rising at a 10.37% CAGR through 2031.
Note: Market size and forecast figures in this report are generated using Mordor Intelligence’s proprietary estimation framework, updated with the latest available data and insights as of January 2026.
Global Carbonization Furnace Market Trends and Insights
Drivers Impact Analysis*
| Drivers | (~) % Impact on CAGR Forecast | Geographic Relevance | Impact Timeline |
|---|---|---|---|
| Rising industrial charcoal use in metallurgy and cement | +2.5% | Global, with concentration in China, India, Brazil | Medium term (2-4 years) |
| Government incentives for biomass-to-energy projects | +2.0% | APAC core (India, China, ASEAN), spill-over to EU | Short term (≤ 2 years) |
| Expansion of voluntary carbon-credit markets | +1.8% | Global, early gains in North America, EU, Australia | Long term (≥ 4 years) |
| Deployment of mobile carbonization units for wildfire mitigation | +1.2% | North America (U.S. West, British Columbia), Australia | Medium term (2-4 years) |
| Integration with carbon-negative hydrogen hubs | +1.0% | Pilot regions: India, EU, select U.S. states | Long term (≥ 4 years) |
| Source: Mordor Intelligence | |||
Rising Industrial Charcoal Use in Metallurgy and Cement
In 2024, operators of blast furnaces and cement kilns consumed approximately 1.2 billion tons of coal. Pilot programs have started replacing 10% of this coal charge with bio-coke, achieving a 20% reduction in CO₂ emissions. In 2025, artificial intelligence (AI) control platforms such as Carbon Re reduced kiln fuel usage by 5%. This has driven consistent demand for biochar with low volatility and uniform size, supplied by continuous furnaces[1]Company Release, “Carbon Re Delivers 5% Fuel Savings in Cement Kilns,” Carbon Re, carbonre.com. China's target of 10 gigawatts (GW) for biomass co-firing could increase annual charcoal demand by 3 million tons, highlighting the sector's reliance on continuous equipment.
Government Incentives for Biomass-to-Energy Projects
India’s Ministry of New and Renewable Energy (MNRE) subsidizes up to 40% of capital costs for biomass projects, reducing the payback period for mid-scale furnaces to under five years. In February 2026, Varhad Capital commissioned a unit with a capacity of 3,000 tons per year under this scheme. In 2024, China allocated grants worth CNY 2 billion(approximately USD 280 million) for biomass projects. The United States Department of Agriculture’s (USDA) Rural Energy for America Program (REAP) disbursed USD 145 million in 2025[2]USDA Newsroom, “REAP Awards USD 145 Million in 2025,” USDA, usda.gov . Additionally, premium pricing for certified biochar is supported by Japan’s J-Credit and South Korea’s fertilizer standards, creating regulatory momentum across Asia.
Expansion of Voluntary Carbon-Credit Markets
In the second quarter (Q2) of 2025, biochar accounted for 89.4% of all durable CO₂ removals. These credits traded between USD 150-200 per ton of CO₂ equivalent, exceeding the margins of traditional charcoal. Corporate entities such as Microsoft and Shopify signed multi-year removal contracts through Carbonfuture, providing small furnace operators with reliable offtake agreements. Europe’s Carbon Removal Certification Framework, finalized in late 2024, recognized biochar credits for Corporate Sustainability Reporting Directive (CSRD) compliance. This is expected to triple regional demand for biochar by 2028.
Deployment of Mobile Carbonization Units for Wildfire Mitigation
The United States Forest Service introduced CharBoss, a mobile unit that processes 1 ton of slash per hour on-site. This approach eliminates smoke and reduces hauling expenses for routes exceeding 50 kilometers. In British Columbia, Caribou Biofuels operates a trailer with a throughput of 2 tons per hour, selling beetle-kill biochar at CAD 600 (USD 430.07) per ton, supported by carbon credits. A pilot project in Australia in 2026 demonstrated the model's adaptability by converting eucalyptus slash into vineyard soil.
Restraints Impact Analysis*
| Restraints | (~) % Impact on CAGR Forecast | Geographic Relevance | Impact Timeline |
|---|---|---|---|
| Stringent emission-control and permitting requirements | -1.5% | Global, acute in North America, EU, Japan | Short term (≤ 2 years) |
| Limited skilled workforce for AI-driven continuous furnaces | -0.8% | APAC emerging markets, Latin America, Sub-Saharan Africa | Medium term (2-4 years) |
| Fragmented international shipping rules for biochar classification | -0.6% | Global maritime trade routes, acute for exporters | Short term (≤ 2 years) |
| Source: Mordor Intelligence | |||
Stringent Emission-Control and Permitting Requirements
U.S. Environmental Protection Agency's (EPA) 40 CFR 63 Subpart M requires each furnace to be equipped with continuous emissions monitoring hardware, with costs ranging from USD 50,000 to 150,000. This requirement can be financially challenging for smaller batch operators. Additionally, the International Maritime Dangerous Goods (IMDG) Amendment 42-24, effective January 2026, classifies biochar as a Class 4.2 dangerous good. This classification introduces measures such as a 14-day weathering period and inert-gas purging, potentially increasing container costs by up to 30%.
Limited Skilled Workforce for AI-Driven Continuous Furnaces
Reinforcement-learning controllers optimize temperature and residence time but require operators to have proficiency in Programmable Logic Controller (PLC) coding and data analytics. In emerging markets, fewer than 5% of technicians meet this requirement, leading to commissioning delays of three to four months. To address this skills gap, India's BiocharIND has allocated INR 150 million (USD 1.61 million) for six-month certification courses. However, China's biomass-energy programs enroll fewer than 2,000 students annually across all programs.
*Our forecasts treat driver/restraint impacts as directional, not additive. The impact forecasts reflect baseline growth, mix effects, and variable interactions.
Segment Analysis
By Furnace Type: Continuous Systems Capture Scale Efficiencies
In 2025, continuous units accounted for 60.12% of the revenue and are projected to grow at a 10.34% compound annual growth rate (CAGR). Their efficiency enables operation for over 8,000 hours annually, reducing per-ton costs by up to 40%. This segment contributed USD 290 million to the carbonization furnace market in 2025. PyroGreen’s screw-conveyor design achieves 85-90% energy self-sufficiency by recycling syngas. Zhengzhou Jiutian’s programmable logic controller (PLC)-controlled line enhances productivity, allowing a single operator to achieve five times the output.
Batch kilns remain significant for heterogeneous feedstocks and markets with lower capital requirements. Entry-level units, priced from USD 20,000, attract small growers monetizing their produce under Verra’s VM0044 methodology. However, tighter carbon dioxide (CO) caps in U.S. states are driving buyers toward continuous systems to avoid ignition spikes. CHAR Technologies’ Thorold plant, set to scale up to 5,000 tons per year (t/y) in Q2 2026, demonstrates this trend. Using a continuous auger reactor integrated with wood-waste sorting, it highlights the benefits of end-to-end integration in favoring continuous systems.


By Feedstock: Coconut Shell Outpaces Traditional Wood
While wood feedstock accounted for 31.78% of the 2025 revenue, coconut shell is projected to grow at a 10.66% CAGR through 2031. This growth is driven by its zero acquisition cost and 75-85% fixed-carbon yields, which attract premium credits. By 2031, coconut shells' share in the carbonization furnace market could exceed 15%. Indonesian processor Tom Cococha processes 12,000 tons per year of shells into hookah briquettes. Equipment vendors are responding by marketing 5 tons per day (t/d) modular lines priced under USD 120,000.
Rice husk and sawdust benefit from co-location at mills, avoiding transport costs. BiocharIND’s five 100 tons per day (t/d) rice-husk projects in Punjab and Uttar Pradesh demonstrate the scale economies achievable when feedstock is sourced on-site. Bamboo and palm shell, categorized as “Others,” are gaining traction in Southeast Asia due to their rapid regrowth and high calorific value.
By Application: Agriculture Emerges as Fastest-Growing Segment
While industrial sectors such as metallurgy and cement accounted for 38.44% of the 2025 revenue, agricultural soil amendment is projected to grow at a 10.66% CAGR. This growth is driven by agronomic benefits and carbon-credit income. By 2031, the agricultural segment of the carbonization furnace market is expected to reach USD 300 million. In South Korea, the fertilizer standard mandates 60% fixed carbon. Continuous systems meet this requirement, enabling certified biochar to command a 30% price premium.
Energy production, primarily through syngas cogeneration, remains a secondary application. Continuous furnaces recirculate 60-80% of syngas to maintain reactor heat, reducing external fuel use and enhancing carbon-negative lifecycle performance. In states like West Virginia, waste management applications persist. Municipal solid waste carbonization earns local landfill-diversion credits, though operators face a 24-month permit process.
Geography Analysis
Asia-Pacific, accounting for 46.11% of 2025 revenue, is projected to grow at a 10.37% compound annual growth rate (CAGR) until 2031. This growth is supported by India's 7% biomass co-firing mandate and China's 10 gigawatt (GW) retrofit initiative. Capital investments include BiocharIND's commitment of INR 1.5 billion (USD 0.01 billion) toward five 100 tons per day (t/d) units and Varhad Capital's newly operational 3,000 tons per year (t/y) plant in Maharashtra. Additionally, Japan's J-Credit premium and Korea's fertilizer standards are driving demand across the region.
In North America, wildfire mitigation strategies are advancing. CharBoss's mobile units process slash at a rate of 1 ton per hour (t/h), generating carbon credits and reducing particulate matter (PM) exceedances. CHAR Technologies secured a CAD 10 million (USD 7.16 million) investment from BMI for a 50,000 t/y project in Espanola. Kanadevia Inova plans to convert 75,000 t/y of organic material into 8,000 tons of biochar and renewable natural gas (RNG), with operations starting in 2027.
Europe is progressing with its Carbon Removal Certification Framework, which incorporates biochar into corporate reporting. This policy is expected to triple demand by 2028. Carbonfuture facilitated the brokering of 2.5 million tons of credits in 2025, turning long-term offtakes into revenue streams for smaller furnaces. Nordic district-heating pilots are integrating syngas into combined heat and power (CHP) networks, enhancing economic stability in colder climates.
South America is focusing on Brazil's sugarcane bagasse. Carbon credits exceeding USD 150 per ton are encouraging the development of char plants with capacities of 10,000-20,000 t/y in São Paulo and Minas Gerais. The Middle East and Africa are in early stages, with Saudi Arabia's Vision 2030 emphasizing biomass energy in its diversification plans and South Africa evaluating biochar for improving degraded maize soils.

Competitive Landscape
The carbonization furnace market is moderately fragmented. Chinese vendors, including Beston Group and Henan Lvkun, offer continuous lines at prices 30-50% lower than their Western counterparts. Companies such as CHAR Technologies, Bioforcetech, and NextChar differentiate themselves through integrated credit offtake and artificial intelligence (AI) control. Strategic actions in the industry include vertical feedstock integration and registry partnerships. For example, Beston recently secured pre-approval from Puro. earth for a 12,000 tons carbon dioxide equivalent (CO₂e) almond-shell project. Additionally, companies are expanding operations into regions with high subsidies, such as India.
Air Burners and Caribou Biofuels, early adopters of mobile units, are addressing the wildfire slash market, a segment not widely served by fixed equipment. In the software domain, Carbon Re licenses AI algorithms that improve kiln fuel efficiency by 5%. This improvement provides a margin advantage, now offered by furnace manufacturers as after-market upgrades. Moreover, compliance support has become a key selling point. Vendors capable of installing continuous emissions monitoring systems and providing International Maritime Dangerous Goods (IMDG) paperwork are securing export contracts in markets such as ASEAN and South America.
Carbonization Furnace Industry Leaders
Beston Group Co., Ltd.
GreenPower
Sugimat S.L.
CHAR Technologies Ltd.
Bioforcetech Corporation
- *Disclaimer: Major Players sorted in no particular order

Recent Industry Developments
- February 2026: CHAR Technologies, supported by CAD 10 million (USD 7.16 million) from Business Development Bank of Canada (BMI), has completed engineering for its 50,000 tons/year biocarbon plant in Espanola, which incorporates a Carbonization Furnace. The plant is scheduled for commercial start-up in late 2027.
- February 2026: Varhad Capital commissioned a 3,000 tons per year (t/y) cotton-stalk biochar production unit in Maharashtra, utilizing a Carbonization Furnace. The company has also confirmed plans for a duplicate production line, scheduled for Q2 2026, under India’s 40% capital-subsidy program.


Global Carbonization Furnace Market Report Scope
Carbonization furnaces are industrial machines that convert biomass, such as wood, coconut shells, and agricultural waste, into carbon-rich charcoal or biochar. This process, known as pyrolysis, involves high-temperature anaerobic decomposition. By heating the raw materials in the absence of oxygen, the furnace removes moisture and volatile substances, producing refined carbon.
The carbonization furnaces market is segmented by furnace type, feedstock, application, and geography. By furnace type, the market is segmented into continuous carbonization furnaces and batch carbonization furnaces. By feedstock, the market is segmented into wood, coconut shell, sawdust, rice husk, and others (bamboo, palm shells). By application, the market is segmented into industrial (metallurgy, cement), agricultural (soil improvement, biochar), energy production, and others (waste management, incense). The report also covers the market size and forecasts for the carbonization furnaces in 17 countries across major regions. The market sizes and forecasts are provided in terms of value (USD).
| Continuous Carbonization Furnace |
| Batch Carbonization Furnace |
| Wood |
| Coconut Shell |
| Sawdust |
| Rice Husk |
| Others (Bamboo, Palm Shells) |
| Industrial (Metallurgy, Cement) |
| Agricultural (Soil Improvement, Biochar) |
| Energy Production |
| Others (Waste Management, Incense) |
| Asia-Pacific | China |
| India | |
| Japan | |
| South Korea | |
| ASEAN Countries | |
| Rest of Asia-Pacific | |
| North America | United States |
| Canada | |
| Mexico | |
| Europe | Germany |
| United Kingdom | |
| France | |
| Italy | |
| Spain | |
| Russia | |
| NORDIC Countries | |
| Rest of Europe | |
| South America | Brazil |
| Argentina | |
| Rest of South America | |
| Middle-East and Africa | Saudi Arabia |
| South Africa | |
| Rest of Middle-East and Africa |
| By Furnace Type | Continuous Carbonization Furnace | |
| Batch Carbonization Furnace | ||
| By Feedstock | Wood | |
| Coconut Shell | ||
| Sawdust | ||
| Rice Husk | ||
| Others (Bamboo, Palm Shells) | ||
| By Application | Industrial (Metallurgy, Cement) | |
| Agricultural (Soil Improvement, Biochar) | ||
| Energy Production | ||
| Others (Waste Management, Incense) | ||
| By Geography | Asia-Pacific | China |
| India | ||
| Japan | ||
| South Korea | ||
| ASEAN Countries | ||
| Rest of Asia-Pacific | ||
| North America | United States | |
| Canada | ||
| Mexico | ||
| Europe | Germany | |
| United Kingdom | ||
| France | ||
| Italy | ||
| Spain | ||
| Russia | ||
| NORDIC Countries | ||
| Rest of Europe | ||
| South America | Brazil | |
| Argentina | ||
| Rest of South America | ||
| Middle-East and Africa | Saudi Arabia | |
| South Africa | ||
| Rest of Middle-East and Africa | ||


Key Questions Answered in the Report
What is current market size of Carbonization Furnace Market?
The Carbonization Furnace Market size is expected to increase from USD 482.26 million in 2025 to USD 530.10 million in 2026 and reach USD 850.63 million by 2031, growing at a CAGR of 9.92% over 2026-2031.
Which feedstock offers the strongest growth outlook?
Coconut shell leads with a 10.66% CAGR to 2031 because zero-cost residues and high fixed-carbon content lift both charcoal margins and credit prices.
Why are agricultural users adopting biochar more rapidly than industrial buyers?
Farmers gain dual revenue from soil-health benefits and carbon credits, allowing agricultural biochar to outpace industrial charcoal with a forecast 10.66% CAGR.
What regulatory change will most affect exporters in 2026?
IMDG Amendment 42-24 classifies biochar as Class 4.2 dangerous goods, adding cooling and headspace rules that can raise container costs by up to 30%.
Page last updated on:


