Market Overview
| Study Period | 2021 - 2031 |
|---|---|
| Forecast Data Period | 2026 - 2031 |
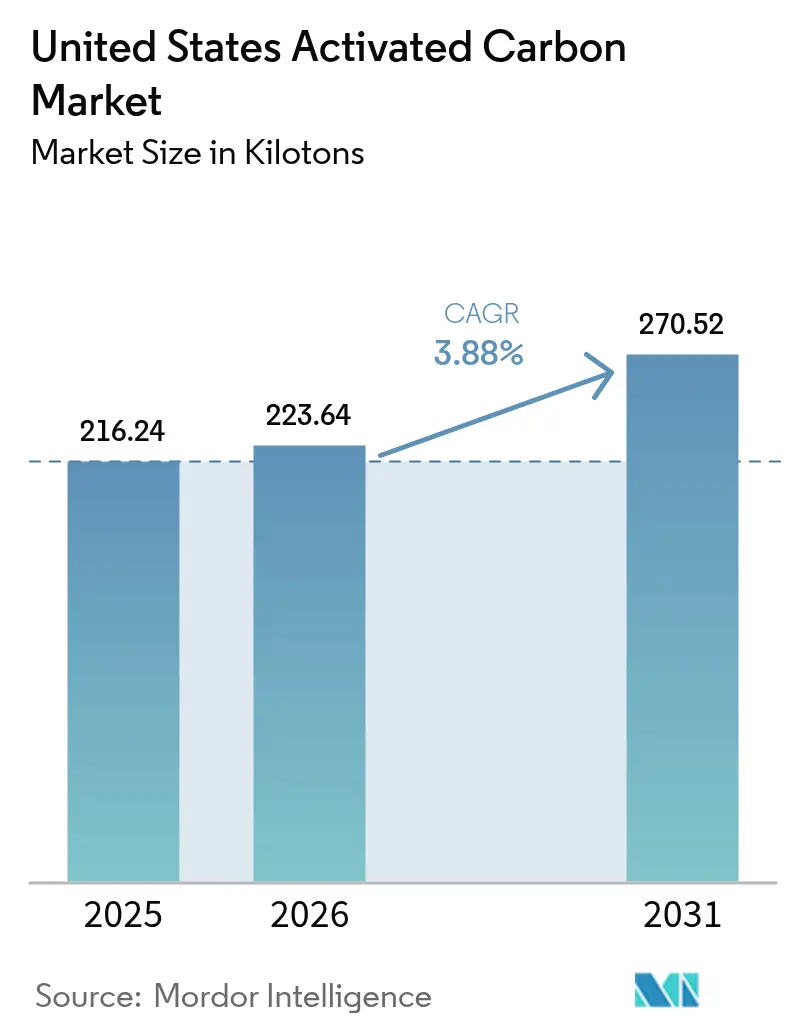
| Base Year Market Size (2025) | 216.24 kilotons |
| Market Volume (2026) | 223.64 kilotons |
| Market Volume (2031) | 270.52 kilotons |
| Growth Rate (2026 - 2031) | 3.88% CAGR |
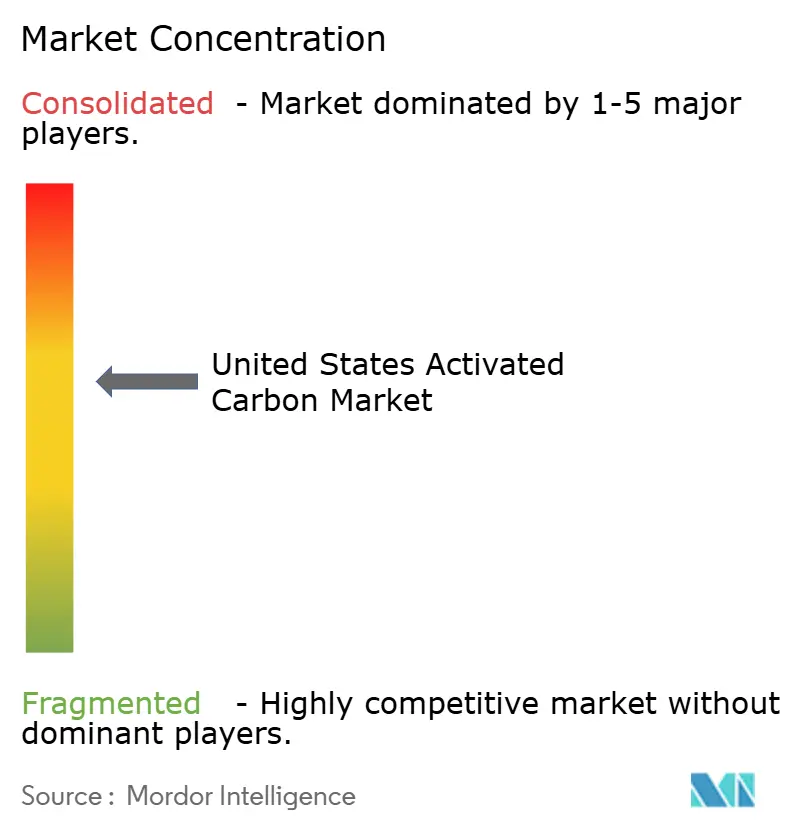
| Market Concentration | Medium |
Major Players *Disclaimer: Major Players sorted in no particular order Image © Mordor Intelligence. Reuse requires attribution under CC BY 4.0. | |
United States Activated Carbon Market Analysis by Mordor Intelligence
The United States Activated Carbon Market size is expected to increase from 216.24 kilotons in 2025 to 223.64 kilotons in 2026 and reach 270.52 kilotons by 2031, growing at a CAGR of 3.88% over 2026-2031. Heightened enforcement of per- and polyfluoroalkyl substances (PFAS) drinking-water limits, tighter mercury controls on the residual coal fleet, and new pharmaceutical capacity together anchor a predictable demand curve. Utilities now expedite granular contactor procurements to meet the 2029 PFAS deadline, while coal-plant operators retrofit powdered injection systems to comply with the revised Mercury and Air Toxics Standards. Parallel investments in continuous active-pharmaceutical-ingredient (API) lines and grid-scale supercapacitors diversify end-market exposure and smooth cyclical swings. Feedstock dynamics add another dimension: domestic wood- and coal-based suppliers currently enjoy cost tailwinds as coconut-shell imports face climate-driven variability, yet long-run decarbonization policies may reverse that advantage.
Key Report Takeaways
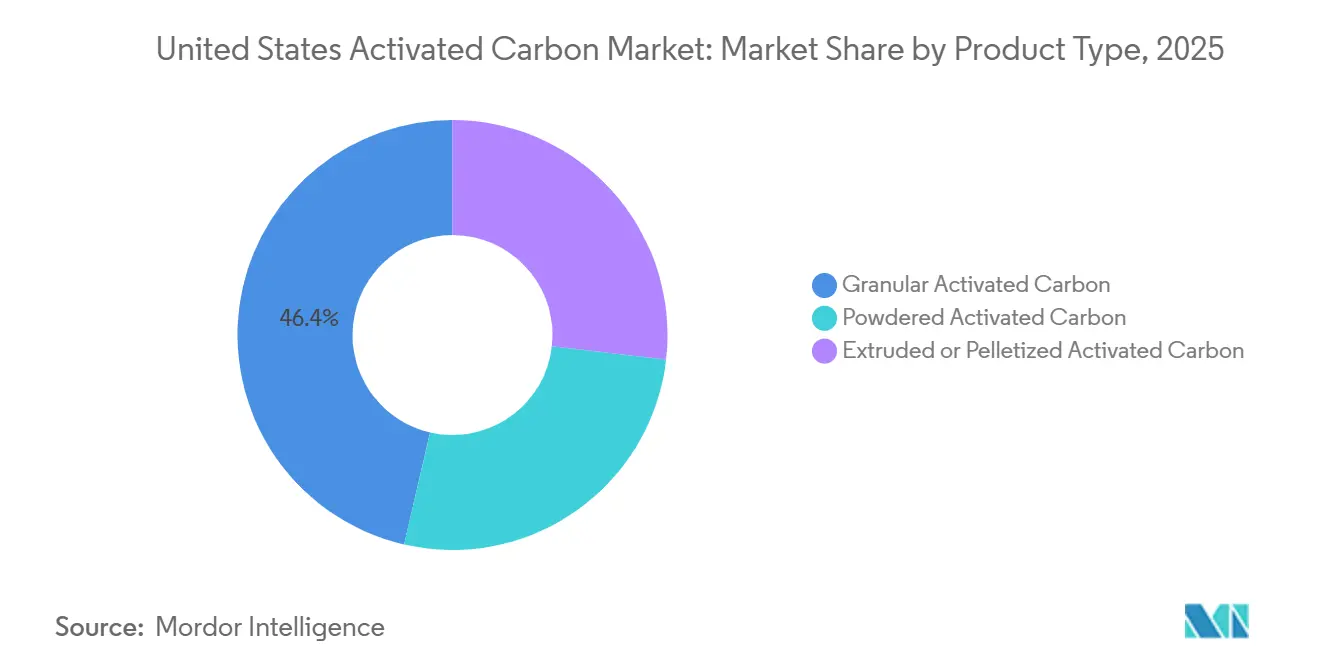
- By product type, granular activated carbon led with 46.37% volume of United States activated carbon market in 2025, while extruded or pelletized grades are projected to expand at a 4.34% CAGR through 2031.
- By application, water purification accounted for 58.42% of United States activated carbon market share in 2025, whereas the medicine segment is forecast to register a 4.46% CAGR to 2031.
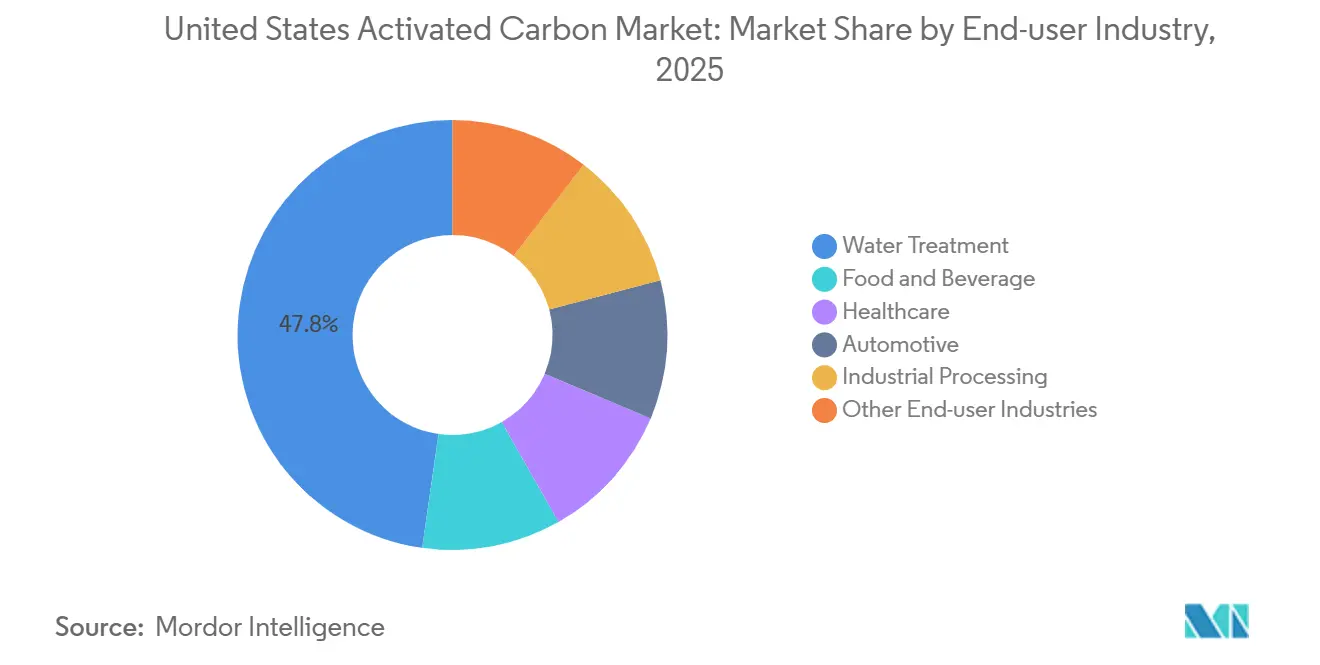
- By end-user industry, water treatment held 47.76% of United States activated carbon market share in 2025 and is predicted to grow at a 4.30% CAGR to 2031.
Note: Market size and forecast figures in this report are generated using Mordor Intelligence’s proprietary estimation framework, updated with the latest available data and insights as of 2026.
United States Activated Carbon Market Trends and Insights
Drivers Impact Analysis*
| Driver | (~) % Impact on CAGR Forecast | Geographic Relevance | Impact Timeline |
|---|---|---|---|
| EPA Regulations on PFAS/PFOA in Drinking Water | +1.2% | National, with early gains in Northeast, Great Lakes, and California systems | Medium term (2–4 years) |
| Phase-Out of Mercury Emissions from Coal-Fired Utilities | +0.8% | National, concentrated in Ohio Valley, Appalachia, and Texas lignite belt | Short term (≤ 2 years) |
| Tightening VOC Limits for Industrial Air Streams | +0.6% | National, led by non-attainment zones in California, Texas Gulf Coast, and Midwest industrial corridors | Medium term (2–4 years) |
| Rapid Expansion of Pharmaceutical API Capacity | +0.7% | National, with clusters in New Jersey, North Carolina Research Triangle, and Puerto Rico | Long term (≥ 4 years) |
| Grid-Scale Supercapacitor Projects Using Activated Carbon | +0.3% | Pilot deployments in California ISO and ERCOT territories | Long term (≥ 4 years) |
| Source: Mordor Intelligence | |||
EPA Regulations on PFAS/PFOA in Drinking Water
The April 2024 National Primary Drinking Water Regulation sets a 4-parts-per-trillion maximum for PFOA and PFOS, forcing roughly 6,000-8,000 community systems to adopt granular activated carbon beds by 2029. Federal PFAS remediation funds and state revolving loans accelerate contract awards, rewarding vendors with NSF/ANSI 61 listings and domestic regeneration capacity. Smaller utilities collaborate through cooperative purchasing agreements to lower unit costs, and states including Michigan and New York provide matching grants that shorten payback periods. Ion-exchange resins appear in niche low-flow installations, but carbon’s multi-contaminant profile and simpler residuals management preserve its dominance. Suppliers are now bundling media with IoT sensors that predict breakthrough, a service model that locks in multi-year aftermarket revenue.
Phase-Out of Mercury Emissions from Coal-Fired Utilities
The 2024 Mercury and Air Toxics Standards revision trims existing-unit limits to 0.003 lb/GWh, necessitating powdered activated carbon injection at 30 GW of lignite and sub-bituminous capacity by late 2027. Each 500-MW boiler adds 5,000-15,000 tons of annual demand, and brominated grades fetch price premiums for dual mercury-SO₃ capture. Forward-curve volatility in coal retirement schedules prompts suppliers to favor two- to three-year indexed contracts rather than decade-long agreements. As retirements accelerate after 2030, vendors pivot toward gas-turbine carbon-capture projects that qualify for 45Q credits, partly offsetting the coal decline.
Tightening VOC Limits for Industrial Air Streams
Ozone non-attainment plans in California, Texas, and the Midwest impose stringent VOC caps on storage tanks and process vents, steering operators toward vapor-phase activated carbon instead of thermal oxidizers in low-BTU streams. Refiners and chemical plants now trial regenerable carbon beds with on-site steam desorption to cut disposal costs. Extruded carbons with high crush strength and low pressure drop gain favor, and early adopters report 20% operating-cost savings over disposable media. Technology transfer workshops hosted by the American Chemistry Council have accelerated best-practice diffusion, further lifting nationwide uptake.
Rapid Expansion of Pharmaceutical API Capacity
Reshoring incentives under the Inflation Reduction Act and the CHIPS and Science Act added 25,000-30,000 tons of annual API output between 2023 and 2025, each metric ton requiring 50-200 kg of activated carbon for purification[1]U.S. Food and Drug Administration, “Continuous Manufacturing Guidance,” fda.gov. Continuous-manufacturing lines at new North Carolina facilities standardize 4-mm extruded pellets that integrate easily with process-analytical-technology loops. The FDA’s 2025 guidance on continuous validation removes regulatory ambiguity and has prompted a pipeline of brownfield conversions. Suppliers able to certify to USP and EP monographs win multi-year sole-source contracts, locking in predictable high-margin volumes.
Restraints Impact Analysis*
| Restraint | (~) % Impact on CAGR Forecast | Geographic Relevance | Impact Timeline |
|---|---|---|---|
| High Energy Cost of Virgin Steam Activation | -0.5% | National, acute in regions with limited natural gas pipeline access or renewable gas infrastructure | Medium term (2–4 years) |
| Competition from Silica Gel, Biochar, and Advanced Membranes | -0.4% | National, concentrated in semiconductor, pharmaceutical clean rooms, and municipal water hybrids | Long term (≥ 4 years) |
| Climate-Driven Supply Risk for Coconut-Shell Feedstocks | -0.3% | Import-dependent producers sourcing from Philippines, Indonesia, and Sri Lanka | Medium term (2–4 years) |
| Source: Mordor Intelligence | |||
High Energy Cost of Virgin Steam Activation
Steam activation consumes 3-5 MWh per ton, and natural-gas price swings compress margins for plants without hedged supply. Reactivation, needing roughly 40% less energy, offers relief, yet potable-water users demand rigorous leachate testing before approving reused media. Section 45V hydrogen tax credits could enable electrolytic steam by 2028, but capital hurdles keep most producers on conventional fuel through the medium term. Vendors therefore index contracts to Henry Hub futures and experiment with biomass-derived syngas, a strategy that earns renewable-fuel credits but complicates process control.
Competition from Silica Gel, Biochar, and Advanced Membranes
Silica gel’s low-humidity adsorption profile garners wins in semiconductor clean rooms, while engineered biochars backed by USDA conservation grants undercut prices in agricultural runoff pilots. Ceramic-membrane hybrids dominate potable-reuse schemes in California, forecast to erode 5%-8% of municipal carbon demand by 2031[2]California State Water Resources Control Board, “Direct Potable Reuse Regulations,” waterboards.ca.gov . Activated carbon retains an edge in multi-contaminant settings, yet suppliers now bundle carbon with pre-filtration membranes to stay in specification.
*Our forecasts treat driver/restraint impacts as directional, not additive. The impact forecasts reflect baseline growth, mix effects, and variable interactions.
Segment Analysis
By Product Type: Granular Reliance Meets Extruded Momentum
Granular activate carbon commanded 46.37% of volume in 2025 as utilities and industrial users favored their backwash stability and ready access to regional reactivation kilns. Reactivation capacity underpins a circular procurement model that answers corporate sustainability goals and shields buyers from virgin-price volatility. At the same time, extruded or pelletized activated carbon is projected to grow 4.34% annually between 2026 and 2031, outpacing the broader United States activated carbon market. Automotive evaporative-emission canisters, mandated under Tier 3 regulations, increasingly specify larger-diameter pellets to mitigate butane breakthrough, while pharmaceutical continuous-manufacturing lines value the pellets’ low friability.
Extruded innovation reshapes value propositions. Kuraray’s 2024 4-mm pellet with 1,200 m²/g surface area offers 20% higher adsorption than legacy 3-mm formats. General Motors’ USD 500 million hybrid-truck program keeps canister demand buoyant at least through 2028. Meanwhile, powdered carbon remains tactical, serving episodic taste-and-odor events in surface-water plants and mercury-injection duties at coal stations. Together, these dynamics reinforce the multi-speed nature of the United States activated carbon market size at the product-form level.


By Application: Regulatory Tailwind Sustains Water Dominance
Water purification represented 58.42% of 2025 volume, and the PFAS rule ensures this share widens through the forecast period. Utilities facing tighter lead and copper limits add orthophosphate, which elevates organic fouling and shortens filter runs, thereby increasing carbon replacement frequency. Medicine applications are set for a 4.46% CAGR on the back of API expansions and the Joint Commission’s emergency-department antidote stockpiling directive.
Gas purification faces coal-retirement headwinds but secures upside in renewable-natural-gas upgrading, where activated carbon strips siloxanes and hydrogen sulfide before grid injection. Metal extraction stays niche, tied to gold mines in Nevada and Alaska with stable tonnage.
By End-user Industry: Compliance-Driven Surge in Water Treatment
Water treatment accounted for 47.76% of 2025 volume and are forecast to grow 4.30% annually through 2031. Bipartisan-Infrastructure-Law grants funnel capital into small community systems, broadening the installed base. Food and beverage processors rely on coconut-shell grades for color removal from corn syrup and sugared beverages under Food Safety Modernization Act protocols. Healthcare users—pharma manufacturers and hospital pharmacies—source USP-grade carbons with strict endotoxin limits, sustaining price premiums that lift overall United States activated carbon market revenue despite modest tonnage.
Automotive OEMs continue purchasing evaporative-emission canisters aligned with 15.5-million-unit light-vehicle sales expected in 2026. Industrial processors show mixed fortunes: semiconductor fabs in Arizona and Texas demand ultra-pure grades, while refineries see erosion as renewable diesel output rises.
Geography Analysis
Regional consumption aligns closely with regulatory intensity and industrial footprints. The Northeast and Great Lakes together accounted for roughly one-third of 2025 volume, driven by early PFAS standards and surface-water dependence that favors granular carbon change-outs every three to five years. California’s strict air-quality rules and direct-potable-reuse mandates make it a disproportionate consumer at 15%-18% of national tonnage, even though it hosts just 12% of the population. Utilities in both regions have moved quickly to sign multi-year supply agreements, locking in pricing ahead of peak PFAS-related demand in 2028-2029.
The Texas Gulf Coast and Midwest industrial corridors support powdered carbon volumes for mercury capture and VOC abatement. Yet the retirement of 10 GW of coal capacity between 2023 and 2025 begins to bite, tempering growth prospects in these states. Extruded-carbon demand gains traction in the Southeast, where pharmaceutical hubs around Raleigh-Durham and Puerto Rico scale continuous API lines. Emerging grid-storage pilots in ERCOT, PJM, and CAISO spread incremental demand more evenly across the map, smoothing regional volatility.
Logistics and supply-chain realities also mold purchasing patterns. Gulf-Coast buyers benefit from port proximity and rail access to coal-based plants, while Mountain-West municipalities incur freight premiums that make on-site mobile reactivation attractive. State-level PFAS limits tighter than federal rules create staggered replacement cycles, forcing suppliers to juggle inventory across disparate timelines. Justice40 funding steers advanced-treatment grants toward rural and disadvantaged communities, broadening the customer base and reinforcing a geographically diverse growth outlook for the United States activated carbon market.
Competitive Landscape
The five leading producers—Ingevity, Cabot Corporation, Kuraray, Jacobi Carbons, and Xylem—held a combined 78% share in 2025, keeping the market moderately fragmented. Vertical integration remains the prime hedge against feedstock risk: Ingevity draws on pine-chemical derivatives from its own mills, while Cabot’s 2024 dual-activation patent boosts micro-pore volume critical for PFAS adsorption. Kuraray’s 2026 Louisiana reactivation acquisition fills a Gulf-Coast gap and supports petrochemical clients under stricter VOC rules.
Mobile regeneration services represent the largest white space. Veolia’s 2025 truck-mounted kilns regenerate 500 tons per month in the Northeast at a 30%-40% cost saving over virgin supply. Xylem’s IoT-enabled breakthrough sensor, launched in 2025, integrates with these services to create predictive-maintenance loops that lower life-cycle costs by 10%-15%. Disruptors such as biochar startups leverage carbon-sequestration credits to discount pricing in non-potable applications, while membrane-system integrators bundle ceramic UF with post-carbon polishers to win zero-liquid-discharge tenders.
Strategic alliances and R&D collaborations intensify. Cabot’s 2025 joint-development pact with a California supercapacitor maker locks in future electrode supply, while Advanced Emissions Solutions doubled brominated-powder capacity in Alabama to capture the brief but lucrative coal-retrofit window. The cadence of investment suggests a pivot from volume growth toward technology differentiation, signaling that service, performance certification, and digital integration will determine winners in the United States activated carbon market over the next five years.
United States Activated Carbon Industry Leaders
Cabot Corporation
Ingevity
JACOBI CARBONS GROUP
Xylem
KURARAY CO., LTD.
- *Disclaimer: Major Players sorted in no particular order

Recent Industry Developments
- December 2025: Calgon Carbon (now part of KURARAY CO., LTD.) announced new patents, including U.S. Patent No. 12,478,948, for its advanced activated carbon sorbent and thermal reactivation technology. This technology demonstrated the capability to remove and destroy over 99.9% of PFAS from water, facilitating carbon recycling and contributing to sustainability objectives.
- August 2025: Sentinel Water Solutions (Sentinel), a company specializing in PFAS pilot testing and treatment, announced an exclusive channel partnership with DESOTEC, a global provider of sustainable activated carbon solutions. The partnership aimed to offer NSF-certified granular activated carbon (GAC) reactivation services to United States drinking water utilities.


United States Activated Carbon Market Report Scope
Activated carbon, also known as activated charcoal, is a highly porous material derived from carbon-rich sources such as coconut shells, coal, or wood. It is recognized for its extensive surface area and functions through adsorption, capturing impurities like organic compounds, chlorine, and odors within its microscopic pores.
The United States activated carbon market is segmented by product type, application, and end-user industry. By product type, the market is segmented into granular activated carbon, powdered activated carbon, and extruded or pelletized activated carbon. By application, the market is segmented into water purification, gas purification, metal extraction, medicine, and other applications. By end-user industry, the market is segmented into water treatment, food and beverage, healthcare, automotive, industrial processing, and other end-user industries. For each segment, the market sizing and forecasts have been done on the basis of volume (tons).
By Product Type
| Granular Activated Carbon |
| Powdered Activated Carbon |
| Extruded or Pelletized Activated Carbon |
By Application
| Water Purification |
| Gas Purification |
| Metal Extraction |
| Medicine |
| Other Applications |
By End-user Industry
| Water Treatment |
| Food and Beverage |
| Healthcare |
| Automotive |
| Industrial Processing |
| Other End-user Industries |
| By Product Type | Granular Activated Carbon |
| Powdered Activated Carbon | |
| Extruded or Pelletized Activated Carbon | |
| By Application | Water Purification |
| Gas Purification | |
| Metal Extraction | |
| Medicine | |
| Other Applications | |
| By End-user Industry | Water Treatment |
| Food and Beverage | |
| Healthcare | |
| Automotive | |
| Industrial Processing | |
| Other End-user Industries |


Key Questions Answered in the Report
What is the size of the United States activated carbon market?
The United States activated carbon market stands at 223.64 kilotons in 2026 and is forecast to reach 270.52 kilotons by 2031, reflecting a 3.88% CAGR through 2031.
Which application will add the most incremental demand through 2031?
Water purification will add the largest tonnage, powered by PFAS compliance investments.
How fast will extruded or pelletized grades grow?
They are expected to expand at 4.34% annually, outpacing the broader market.
Which factor poses the biggest cost risk to producers today?
Volatile natural-gas prices that drive steam-activation energy expenses.
Page last updated on:


