Clinical Trial Patient Recruitment Services Market Size and Share
Market Overview
| Study Period | 2020 - 2031 |
|---|---|
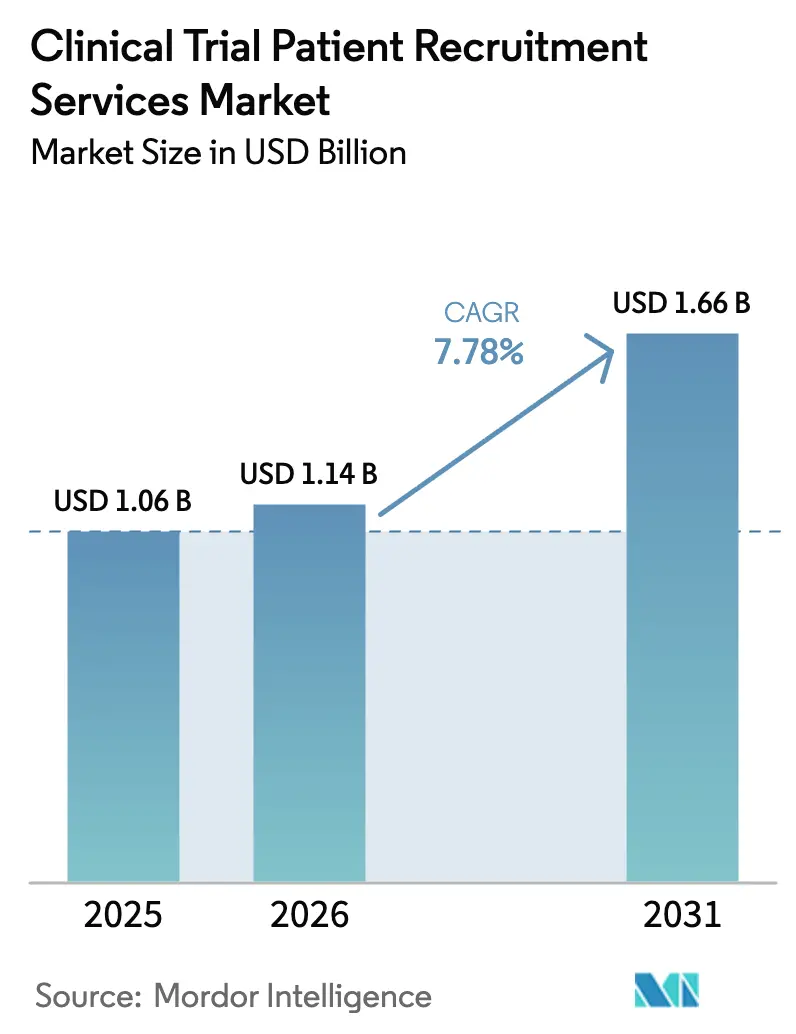
| Market Size (2026) | USD 1.14 Billion |
| Market Size (2031) | USD 1.66 Billion |
| Growth Rate (2026 - 2031) | 7.78% CAGR |
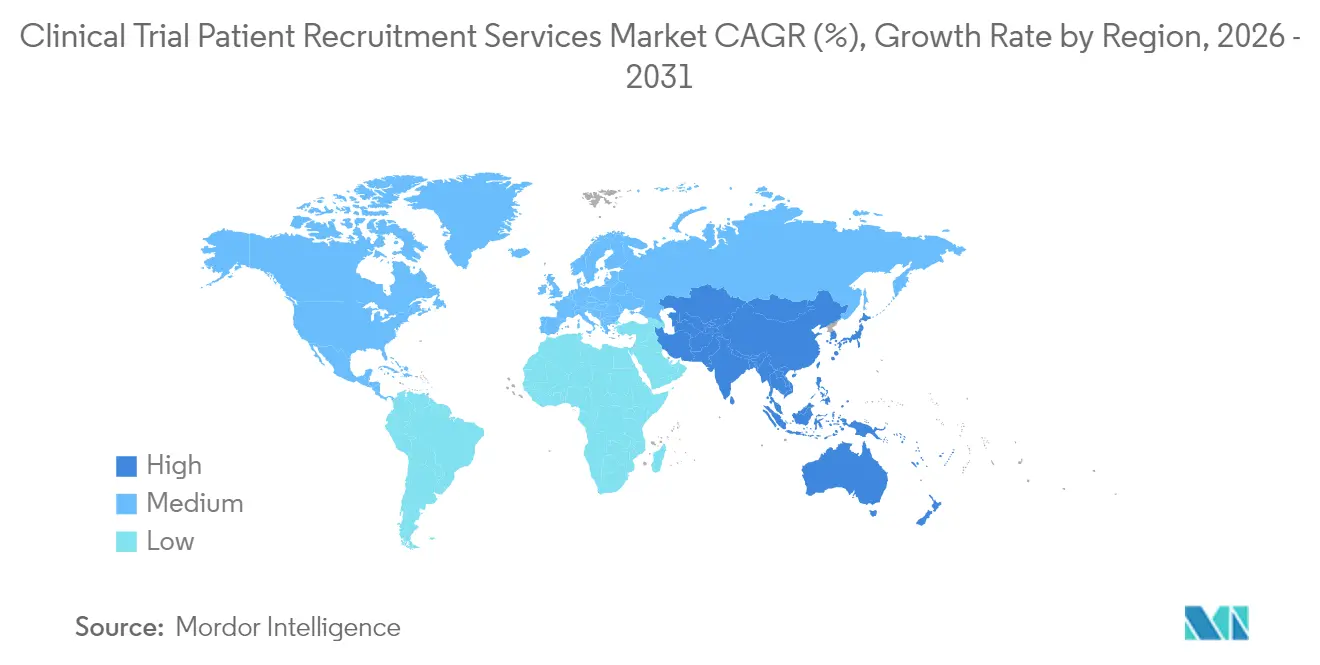
| Fastest Growing Market | Asia Pacific |
| Largest Market | North America |
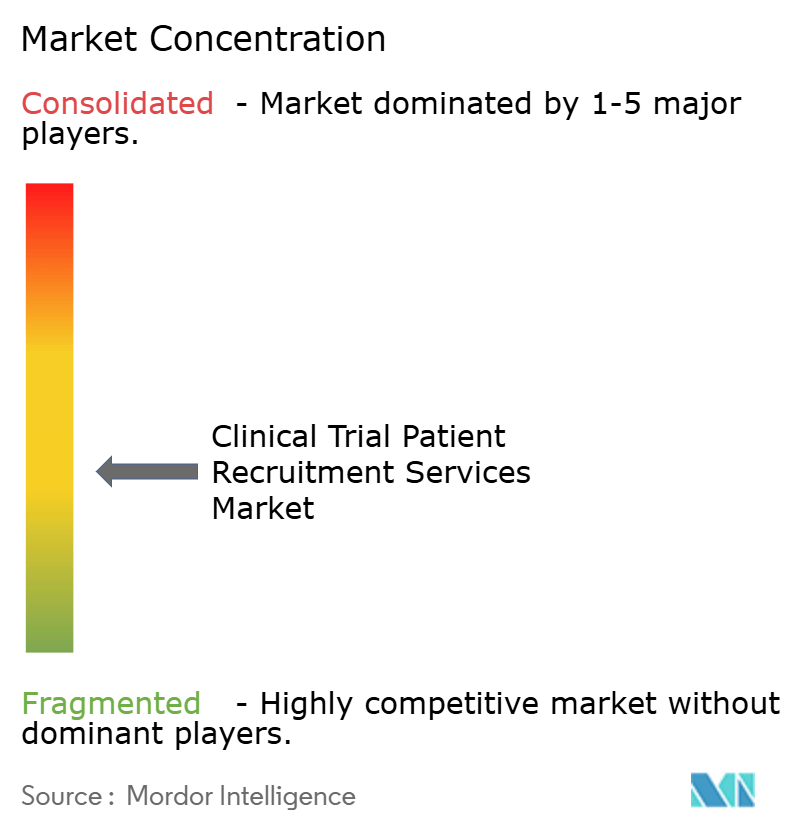
| Market Concentration | Medium |
Major Players *Disclaimer: Major Players sorted in no particular order Image © Mordor Intelligence. Reuse requires attribution under CC BY 4.0. | |
Clinical Trial Patient Recruitment Services Market Analysis by Mordor Intelligence
The clinical trial patient recruitment services market size is expected to grow from USD 1.06 billion in 2025 to USD 1.14 billion in 2026 and is forecast to reach USD 1.66 billion by 2031 at 7.78% CAGR over 2026-2031. Expansion is underpinned by regulatory mandates that penalize trials lacking demographic diversity, rising use of AI-driven participant identification, and accelerating adoption of decentralized and hybrid study models. Sponsors are allocating larger budgets to recruitment platforms to cut cycle times, while technology vendors are layering predictive analytics onto vast health-data assets to refine outreach. Direct-to-patient strategies, supported by social media micro-targeting, are lowering geographic barriers and elevating enrollment rates. Heightened M&A activity among contract research organizations (CROs) and digital health firms signals a shift toward full-stack service offerings that integrate site selection, recruitment, retention and data capture functions. Collectively, these dynamics keep the clinical trial patient recruitment services market on a steady growth trajectory despite intensifying competition for qualified participants.
Key Report Takeaways
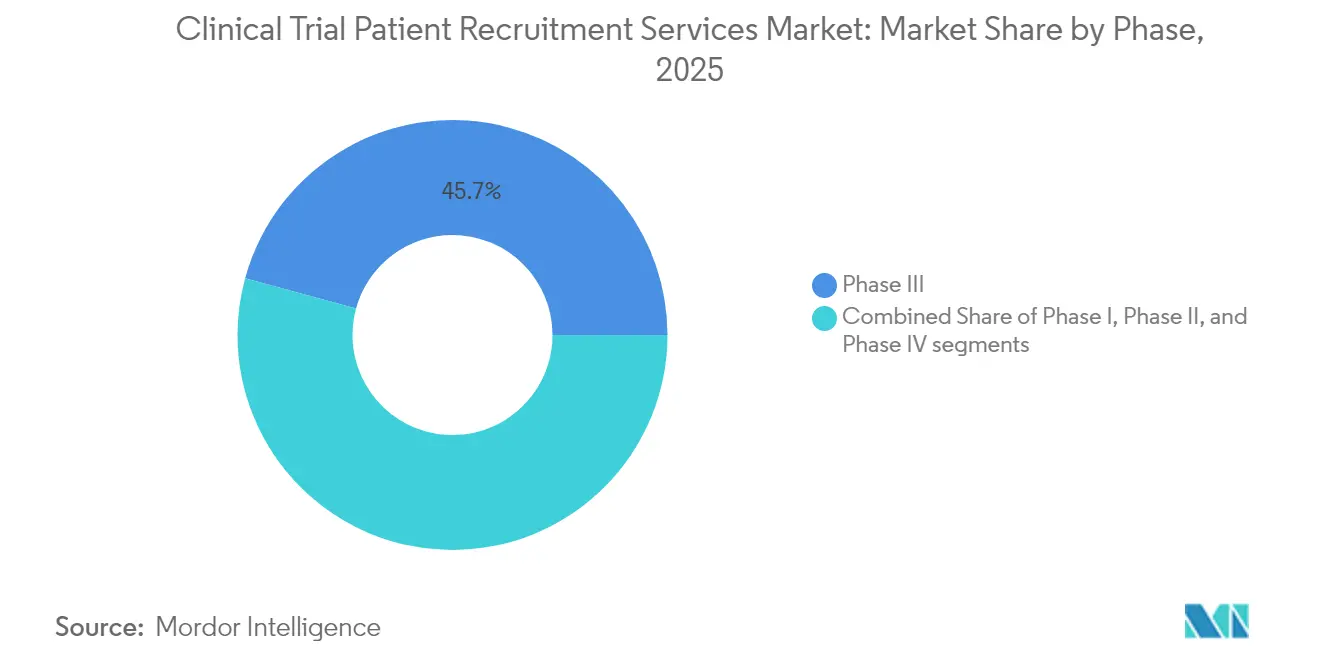
- By phase, Phase III accounted for 45.74% of the clinical trial patient recruitment services market share in 2025, while Phase I is projected to expand at a 10.18% CAGR through 2031.
- By therapeutic area, oncology led with 38.12% revenue share in 2025; infectious diseases are forecast to grow at a 12.72% CAGR to 2031.
- By service type, digital and social media recruitment held 34.10% of the clinical trial patient recruitment services market size in 2025 and is advancing at a 10.63% CAGR through 2031.
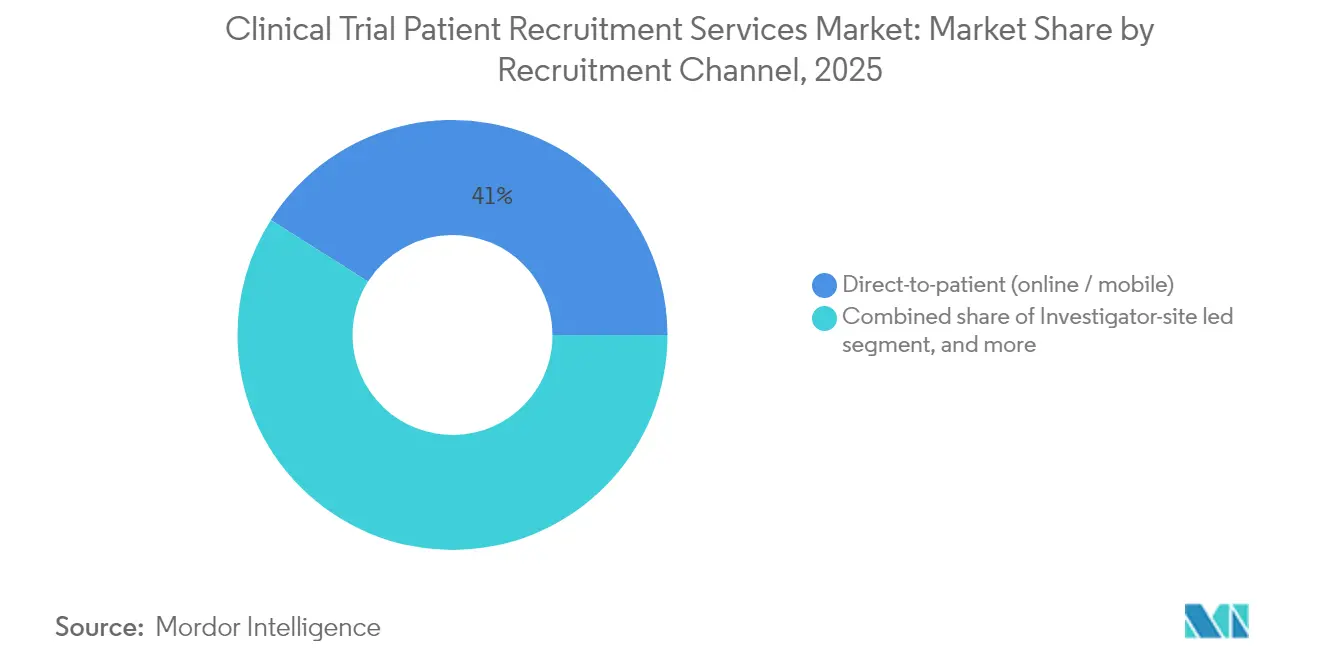
- By recruitment channel, direct-to-patient outreach commanded 41.02% share of the clinical trial patient recruitment services market size in 2025 and is forecast to grow at an 11.49% CAGR to 2031.
- By sponsor type, pharmaceutical and biotech companies controlled 65.02% revenue share in 2025, outpacing all other sponsor categories with a 12.22% CAGR through 2031.
- By geography, North America dominated with 44.12% market share in 2025, whereas Asia-Pacific is the fastest-growing region with a 9.44% CAGR through 2031.
Note: Market size and forecast figures in this report are generated using Mordor Intelligence’s proprietary estimation framework, updated with the latest available data and insights as of 2026.
Market Trends and Insights
Drivers Impact Analysis of Clinical Trial Patient Recruitment Services Market*
| Driver | (~) % Impact on CAGR Forecast | Geographic Relevance | Impact Timeline |
|---|---|---|---|
| Growing number of clinical trials globally | +2.1% | North America & Asia-Pacific | Long term (≥ 4 years) |
| Demand for diverse patient populations | +1.8% | North America & Europe | Medium term (2-4 years) |
| Rising prevalence of rare & ultra-rare diseases | +1.4% | Developed markets worldwide | Long term (≥ 4 years) |
| AI-enabled predictive enrollment analytics | +1.6% | North America & Europe | Short term (≤ 2 years) |
| Growth of decentralized & hybrid trial models | +1.3% | Global, fastest uptake in Asia-Pacific | Medium term (2-4 years) |
| Source: Mordor Intelligence | |||
Growing Number of Clinical Trials Globally
Global trial volume continues to climb, with more than 250 new studies launched in rare metabolic conditions during 2024. Oncology remains the largest therapeutic contributor to this expansion, yet Asia’s share of new trial starts has risen sharply as China’s activity now exceeds pre-2020 levels by 57%. Sponsors pursuing precision-medicine programs are seeking smaller but highly targeted patient cohorts, elevating demand for recruitment partners that combine genomic databases with real-world evidence. The resulting workload pushes CROs to invest in automation that screens electronic health records at scale. These trends collectively reinforce sustained growth across the clinical trial patient recruitment services market.
Demand for Diverse Patient Populations
Regulators now tie approval success to demographic inclusion benchmarks, and the FDA requires every new protocol to disclose specific enrollment targets for underrepresented populations. Less than 10% of participants in 2022 new-drug trials were Black and fewer than 50% were women, underscoring systemic access gaps that recruitment specialists must solve. Decentralized models help by bringing research to patients’ homes, and retail pharmacies such as Walgreens have enrolled 44% minority participants in pilot studies through community outreach[1]Walgreens Boots Alliance, “Pharmacy-Led Clinical Trial Recruitment,” walgreens.com. Diversity mandates are therefore translating into premium pricing for firms that can validate measurable representation gains, strengthening revenue visibility across the clinical trial patient recruitment services market.
Rising Prevalence of Rare & Ultra-Rare Diseases
More than half of orphan-drug studies miss enrollment milestones because eligible patients are dispersed across countries and care settings. Genetic etiology dominates rare illnesses, so sponsors are using global patient registries and advocacy-group partnerships to locate candidates rapidly. Concurrently, shrinking returns on orphan-drug launches—averaging 2.5% since 2022—pressure developers to shorten recruitment windows and contain overall spend. These factors elevate the strategic value of technology platforms that integrate natural-history data with AI matching algorithms, a capability increasingly viewed as table stakes in the clinical trial patient recruitment services market.
AI-Enabled Predictive Enrollment Analytics
Artificial intelligence has migrated from pilot to production: Inato’s prescreening engine reaches 95% eligibility-matching accuracy while halving screening time[2]Inato, “AI-Powered Prescreening Launch,” inato.com. Early adopters report 10-15% faster enrollment and six-month cycle-time reductions once AI informs site selection. Algorithms mine past trial data to refine inclusion criteria, expand candidate pools and flag high-performing investigators. Although 70% of sponsors still run AI in isolated workstreams, the competitive imperative to accelerate R&D pipelines is pushing wider deployment. As adoption scales, predictive analytics will anchor next-generation growth across the clinical trial patient recruitment services market.
Restraints Impact Analysis of Clinical Trial Patient Recruitment Services Market*
| Restraints Impact Analysis | (~) % Impact on CAGR Forecast | Geographic Relevance | Impact Timeline |
|---|---|---|---|
| Patient concerns about risks & side-effects | -1.2% | Developed markets worldwide | Medium term (2-4 years) |
| Complex eligibility (inclusion / exclusion) criteria | -0.9% | Global, most acute in rare-disease studies | Long term (≥ 4 years) |
| Rising global data-privacy regulations (GDPR, CCPA) | -0.7% | Europe & North America, expanding to other regions | Short term (≤ 2 years) |
| Source: Mordor Intelligence | |||
Patient Concerns About Risks & Side-Effects
Historical mistrust among minority communities and concerns about placebo assignment inhibit participation, especially in chronic and life-threatening conditions. Only 4% of physicians routinely discuss trials with patients, leaving knowledge gaps that amplify apprehension. Sponsors are countering through culturally tailored education and concierge support that walks participants through protocol requirements. Pharmacy-based recruitment stations and mobile consent teams are also emerging to build confidence closer to where patients receive routine care. These initiatives temper but do not fully neutralize the restraint's drag on the clinical trial patient recruitment services market.
Complex Eligibility (Inclusion / Exclusion) Criteria
Stringent criteria narrow candidate pools, extend timelines and inflate budgets. In rare genetic disorders, multi-layer diagnostic thresholds can shrink viable populations to double-digit numbers per country. AI tools such as Trial Pathfinder analyze historical data to recommend broader yet still safe criteria, potentially doubling eligibility. Regulators now encourage inclusive designs, but operationalizing broader criteria requires re-training of sites and real-time data monitoring. Until such support becomes universal, complex protocols will continue to restrain growth in the clinical trial patient recruitment services market.
*Our forecasts treat driver/restraint impacts as directional, not additive. The impact forecasts reflect baseline growth, mix effects, and variable interactions.
Clinical Trial Patient Recruitment Services Market Segment Analysis
By Phase:
Phase III Dominance Faces Phase I InnovationPhase III studies held 45.74% of the clinical trial patient recruitment services market share in 2025, underlining their scale and regulatory importance. These pivotal trials often span multiple regions and demand thousands of participants, prompting sponsors to secure multi-year master service agreements with leading CROs. Conversely, Phase I recruitment is accelerating at a 10.18% CAGR as advanced-therapy programs flood early-stage pipelines. Gene and cell-therapy developers increasingly target well-characterized sub-populations, compelling recruiters to blend genomic-lab data with electronic health record mining. The clinical trial patient recruitment services market therefore sees a twin focus: large-scale global engagement for Phase III and hyper-targeted, data-driven outreach for Phase I. Digital safety monitoring and wearable devices, permitted under recent ICH E6(R3) updates, further widen the geographic reach of early studies while preserving vigilance.
Second-generation AI models now recommend “micro-site” networks—clusters of two to three high-performing investigators—in lieu of broad but under-utilized site maps. This approach curtails screen-fail rates and raises enrollment velocity by up to 20%, reinforcing ROI for sponsors operating at the front end of the pipeline. Successful execution at both ends of the spectrum illustrates how the clinical trial patient recruitment services market is balancing volume with precision to accelerate commercialization timelines.


By Therapeutic Area:
Oncology Leadership Challenged by Infectious Disease GrowthOncology captured 38.12% of the clinical trial patient recruitment services market size in 2025, reflecting intense development activity across solid tumors and hematologic malignancies. Competition for patients in marquee indications now compels sponsors to differentiate protocols through reduced visit schedules and travel reimbursements. Infectious-disease studies, buoyed by pandemic-preparedness funding, display a 12.72% CAGR and threaten to outpace oncology growth in certain regions. Vaccine trials leverage community clinics and retail pharmacies to access large healthy-volunteer pools, while antimicrobial resistance programs tap hospital networks for rapid enrollment.
Neurology projects use digital endpoints and tele-neuro assessments to mitigate investigator shortages, whereas cardiovascular studies deploy wearable devices to capture real-time biomarkers. Such cross-learning has elevated expectations for recruitment speed across all therapeutic segments. Together, these shifts ensure the clinical trial patient recruitment services market remains dynamic as therapeutic priorities evolve.
By Service Type:
Digital Recruitment Transforms Traditional ModelsDigital and social-media offerings secured 34.10% of service-type revenue in 2025 and post the fastest 10.63% CAGR through 2031. Sophisticated audience-segmentation tools match trial protocols to patient interests, comorbidities and geography with pinpoint accuracy, cutting cost per randomized patient by double-digit percentages. Patient-database and feasibility solutions follow in scale, bolstered by health-system partnerships that grant de-identified access to more than 160 million U.S. records. Site-identification algorithms overlay performance metrics onto epidemiological data to suggest optimized site mixes, further tightening timelines.
Hybrid services now bundle eligibility scoring, eConsent, and remote visit logistics, creating friction-less experiences that elevate retention. This convergence blurs once discrete categories, positioning integrated platforms as the growth engine of the clinical trial patient recruitment services market.
By Recruitment Channel:
Direct-to-Patient Models Reshape Industry DynamicsDirect-to-patient pathways held 41.02% of the clinical trial patient recruitment services market size in 2025 and are forecast to advance at an 11.49% CAGR. Social platforms, streaming-media ad spots, and condition-specific podcasts are funneling self-referred volunteers to study portals at unprecedented scale. Investigator-site led recruitment remains vital for complex protocols requiring deep clinical relationships, but CROs are augmenting traditional outreach with mobile apps that allow participants to self-screen and schedule visits. Patient-advocacy alliances further expand reach in rare disease communities, demonstrating enrollment lifts of up to 30% versus CRO-only models. As regulators endorse decentralized frameworks, direct-to-patient will likely cement itself as the anchor channel within the clinical trial patient recruitment services market.
By Sponsor Type:
Pharmaceutical Dominance Drives Innovation InvestmentPharma and biotech organizations commanded 65.02% of spending in 2025, reflecting their expansive late-stage pipelines and willingness to outsource non-core functions. More than 85% of active studies report enrollment challenges, prompting sponsors to earmark incremental budget for AI-based recruitment accelerators. Medical-device firms, although smaller in volume, require specialized surgeon and proceduralist networks, driving niche-service demand. Academic sponsors adopt commercial tactics as grant agencies impose stricter timeline metrics. Consolidation within Big Pharma amplifies purchasing power, reinforcing volume commitments that propel the clinical trial patient recruitment services market toward scale efficiencies.
Geography Analysis
North America Clinical Trial Patient Recruitment Services Market
North America retained 44.12% market share in 2025 on the back of FDA leadership, dense investigator networks, and payer infrastructure willing to reimburse innovative therapeutics. Enrollment budgets are rising to offset high screen-fail rates, while Walgreens’ 9,000-store footprint offers a convenient front line for localized outreach. New diversity guidance imposes site-level reporting, catalyzing demand for analytics that predict demographic enrollment gaps before first-patient-in.
APAC Clinical Trial Patient Recruitment Services Market
Asia-Pacific delivers the fastest 9.44% CAGR as China, South Korea and Australia streamline approvals and invest in site modernization. Decentralized platforms thrive in the region thanks to strong mobile penetration; rural-telehealth pilots in India cut participant travel by 60%, widening access to historically underserved populations. Variable approval timelines, ranging from 2 months in Australia to 8 months in China, drive recruiters to craft country-specific playbooks that keep multi-region studies on schedule.
EMEA and South America Clinical Trial Patient Recruitment Services Market
Europe remains a mature yet evolving market where GDPR compliance heightens data-management costs, but centralized ethics processes under the EU Clinical Trials Regulation shorten initial review stages. Sponsors navigate fragmented healthcare systems by engaging pan-European patient associations to disseminate study awareness. The Middle East & Africa and South America contribute modest volumes today yet post double-digit growth rates as payers, ministries of health, and multinational sponsors co-fund infrastructure upgrades. Collectively, these regional trends sustain global momentum in the clinical trial patient recruitment services market.

Competitive Landscape
The market exhibits moderate fragmentation, featuring CRO giants, specialized recruitment tech startups and health-data aggregators. ICON vaulted to second place after its USD 12 billion acquisition of PRA Health Sciences in March 2025, creating a 41,000-employee powerhouse with combined decentralized-trial platforms[3]ICON plc, “ICON Completes Acquisition of PRA Health Sciences,” iconplc.com. IQVIA preserves overall lead through its integrated data-technology stack and USD 31.5 billion contracted R&D backlog.
Start-ups such as Inato secure venture funding to scale AI prescreening and community-site activation tools, adding competitive pressure that accelerates tech adoption cycles. Traditional CROs counter by partnering or merging with niche providers: Labcorp allied with Hawthorne Effect for remote phlebotomy, while Suvoda combined with Greenphire to tie financial compliance to interactive response technology.
Retail pharmacy chains enter the fray, leveraging longitudinal medication data and ubiquitous locations to run micro-sites, a move that could displace smaller investigator networks. Meanwhile, rare-disease specialists guard turf by cultivating patient-advocacy relationships that remain difficult to replicate at scale. These competitive vectors collectively raise the innovation threshold and sustain momentum across the clinical trial patient recruitment services market.
Clinical Trial Patient Recruitment Services Industry Leaders
IQVIA
ICON plc
Parexel International
Labcorp Drug Development
Syneos Health
- *Disclaimer: Major Players sorted in no particular order
Clinical Trial Patient Recruitment Services Market Companies Covered in this Report
- IQVIA
- ICON
- Syneos Health
- Parexel International
- LabCorp
- BBK Worldwide
- Antidote Technologies
- AutoCruitment
- Elligo Health Research
- Worldwide Clinical Trials
- Biorasi
- Trialbee
- M&B Sciences
- TrialSpark
- Clara Health
- Verily Life Sciences
- Deep 6 AI
- PicnicHealth
- ClinicalConnection
- PatientWing

Recent Industry Developments in Clinical Trial Patient Recruitment Services Market
- March 2025: ICON plc completed its USD 12 billion acquisition of PRA Health Sciences, expanding decentralized and hybrid trial capabilities.
- January 2025: Inato launched an AI prescreening tool with 95% accuracy and secured USD 20 million to extend access across 5,000 community sites.
- January 2025: Medable integrated generative AI into its Studio platform, automating eCOA creation and supporting 300 decentralized studies.
- January 2025: Suvoda and Greenphire merged to streamline patient payments and supply management in one platform.
- January 2025: Faro Health partnered with Recursion to enhance AI-powered protocol design and recruitment efficiency.


Clinical Trial Patient Recruitment Services Market Report Scope and Research Methodology
Market Definition and Coverage
Our study defines the clinical trial patient recruitment services market as fee-based, third-party activities that identify, screen, engage, enroll, and retain human participants for interventional clinical studies on behalf of biopharma sponsors and contract research organizations across all trial phases. Efforts range from database mining and geo-targeted digital outreach to site-level advertising and travel logistics.
Scope exclusion: back-end site management, data management, and general clinical supply logistics are not counted.
Segments Covered in This Report
- By Phase
- Phase I
- Phase II
- Phase III
- Phase IV
- By Therapeutic Area
- Oncology
- Cardiovascular
- Central Nervous System
- Endocrine & Metabolic
- Infectious Diseases
- Other Therapeutic Areas
- By Service Type
- Patient Database & Feasibility Services
- Site Identification & Engagement
- Digital / Social-media Recruitment
- Community-based / Outreach Programs
- Retention & Compliance Services
- By Recruitment Channel
- Investigator-site led
- CRO led
- Direct-to-patient (online / mobile)
- Patient-advocacy Group Partnerships
- By Sponsor Type
- Pharmaceutical & Biotech Companies
- Medical Device Companies
- Other Sponsor Types
- Geography
- North America
- United States
- Canada
- Mexico
- Europe
- Germany
- United Kingdom
- France
- Italy
- Spain
- Rest of Europe
- Asia-Pacific
- China
- Japan
- India
- Australia
- South Korea
- Rest of Asia-Pacific
- Middle East & Africa
- GCC
- South Africa
- Rest of Middle East & Africa
- South America
- Brazil
- Argentina
- Rest of South America
- North America
Data Sources, Market Sizing, and Validation
Primary Research
Mordor analysts held semi-structured calls with investigators, study-coordinator networks, recruitment-tech vendors, and CRO pricing managers across North America, Europe, and Asia-Pacific. Interviews clarified real-world enrollment costs, typical social-media response rates, and regional regulatory hurdles, letting us validate secondary ratios and adjust assumptions.
Desk Research
We began with public indicators that map directly to enrollment demand, such as ClinicalTrials.gov and EU-CTR counts by phase, U.S. FDA and EMA protocol approvals, and trial diversity statistics from the FDA Drug Trials Snapshots. Industry bodies, including PhRMA, TransCelerate, and the Tufts CSDD, supplied averages on screen-fail rates and cycle times. Company 10-Ks, SEC filings, and investor decks revealed sponsor outsourcing ratios and spend per enrolled subject, which we aggregated inside D&B Hoovers and Dow Jones Factiva screens. Academic journals in Contemporary Clinical Trials and JCO offered peer-reviewed dropout benchmarks. This list is illustrative; many other sources were consulted for data checks and context.
A second pass captured supporting variables, national R&D expenditures (OECD), internet and smartphone penetration (ITU), and patient advocacy group membership rolls to gauge digital outreach scalability in key regions.
Market-Sizing & Forecasting
A coordinated top-down build starts with annual global interventional trial starts, segmented by phase and geography, which are then multiplied by median enrollment targets and observed screen-fail ratios to derive gross patient demand. Results are corroborated with selective bottom-up checks, sampled vendor fee cards and channel-check average selling price × volume estimates to refine totals. Key model fingerprints include: - registered trial count by phase, - average cost per enrolled patient, - screen-fail and dropout rates, - share of digital versus site-led outreach, and - growth in decentralized/hybrid trial adoption.
Five-year projections rely on multivariate regression that links enrollment spend to pipeline expansion, protocol complexity scores, and broadband reach, with scenario overlays vetted by our expert panel. Missing data points are bridged using regional analogs and disclosed assumption ranges.
Data Validation & Update Cycle
Outputs pass variance checks against historic spend, public vendor revenues, and independent cost studies before a senior analyst review. The dataset is refreshed annually; mid-cycle updates occur when material events, large acquisitions, regulatory shifts, or pandemic policy changes alter market dynamics.
How Mordor Intelligence's Clinical Trial Patient Recruitment Services Market Size Compares to Other Published Estimates
Published estimates often diverge because firms choose different service scopes, price stacks, and refresh cadences.
Key gap drivers include whether retention fees sit inside recruitment totals, if analyst teams adjust for sponsor in-house enrollment, and how currency conversions handle multi-site trials. Some providers also extrapolate global figures from limited U.S. samples or apply aggressive pipeline growth scenarios, whereas Mordor aligns volumes to verified trial registry counts and cross-checks ASPs with current vendor quotes.
Benchmark comparison
| Market Size | Anonymized source | Primary gap driver |
|---|---|---|
| USD 1.06 B (2025) | Mordor Intelligence | - |
| USD 1.40 B (2025) | Global Consultancy A | Includes ancillary site management tasks and uses blended ASP without phase weighting |
| USD 0.91 B (2023) | Industry Association B | Older base year and excludes digital-only recruitment spend |
| USD 10.19 B (2025) | Trade Journal C | Aggregates broader clinical support services and applies headline contract values without screen-fail adjustment |
The comparison shows that when scope creep or outdated baselines are removed, Mordor's disciplined variable selection and annual refresh provide a balanced, transparent starting point for decision makers.


Key Questions Answered in the Report
What is the current size of the clinical trial patient recruitment services market?
The market stands at USD 1.14 billion in 2026 and is projected to reach USD 1.66 billion by 2031, reflecting a 7.78% CAGR over 2026-2031.
Which phase of clinical development accounts for the highest spending on patient recruitment?
Phase III trials lead, holding 45.74% of the 2025 clinical trial patient recruitment services market share.
Why are diversity requirements shaping recruitment strategies?
FDA guidance now obliges sponsors to file demographic enrollment targets, driving demand for outreach methods that engage underrepresented groups and fueling growth in the clinical trial patient recruitment services market.
How is AI improving recruitment timelines?
Predictive analytics can cut enrollment cycles by 10-15% and identify optimal investigator sites, translating into six-month savings on overall development schedules.
Which geographic region is growing fastest?
Asia-Pacific shows the highest 9.44% CAGR, driven by streamlined approvals and robust investment in decentralized trial infrastructure.
What competitive moves are reshaping the market?
Large CROs are acquiring technology innovators, exemplified by ICON’s USD 12 billion takeover of PRA Health Sciences, while retail pharmacies and AI start-ups are entering to diversify service models.
Page last updated on:


