Clinical Trials Support Services Market Size and Share
Market Overview
| Study Period | 2020 - 2031 |
|---|---|
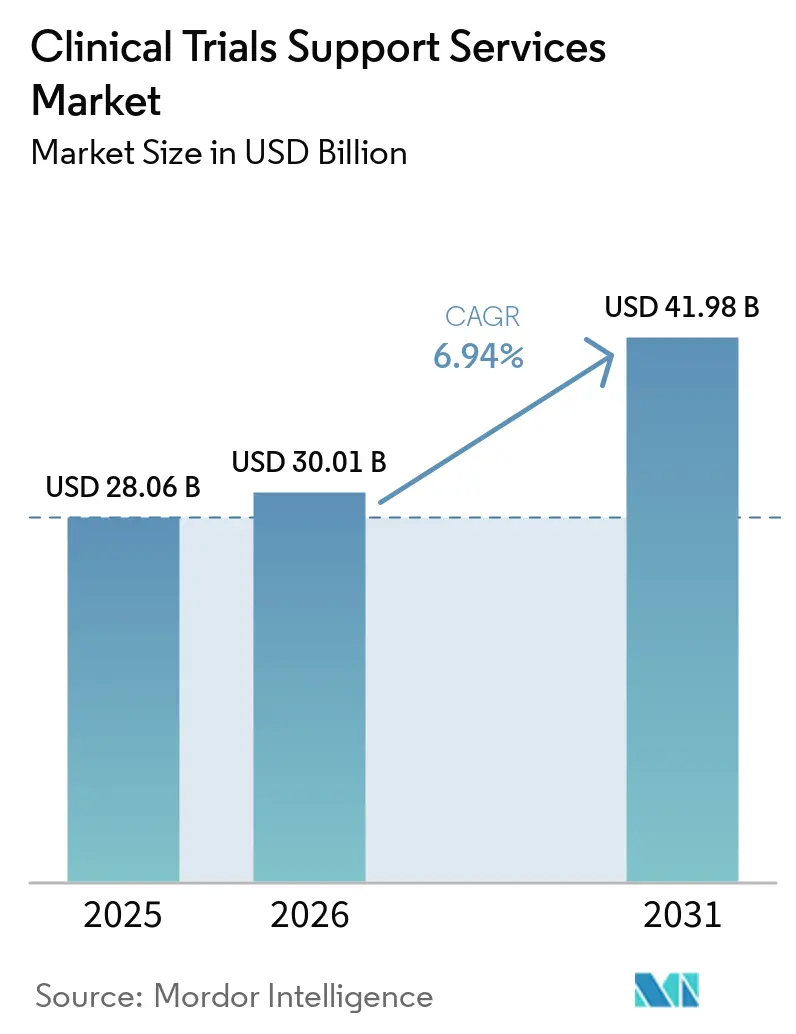
| Market Size (2026) | USD 30.01 Billion |
| Market Size (2031) | USD 41.98 Billion |
| Growth Rate (2026 - 2031) | 6.94% CAGR |
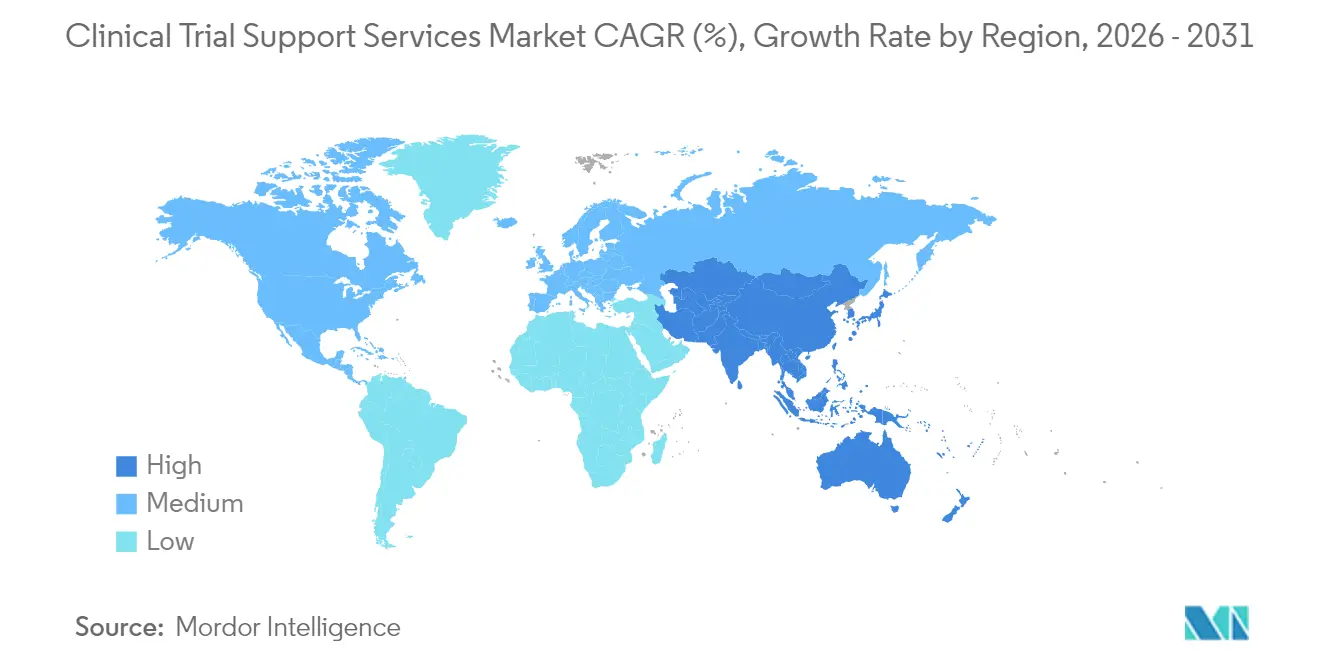
| Fastest Growing Market | Asia Pacific |
| Largest Market | North America |
| Market Concentration | Medium |
Major Players *Disclaimer: Major Players sorted in no particular order Image © Mordor Intelligence. Reuse requires attribution under CC BY 4.0. | |
Clinical Trials Support Services Market Analysis by Mordor Intelligence
The clinical trial support services market size is expected to grow from USD 28.06 billion in 2025 to USD 30.01 billion in 2026 and is forecast to reach USD 41.98 billion by 2031 at 6.94% CAGR over 2026-2031. Expansion is driven by growing R&D pipelines, rising demand for specialized outsourcing models, and wider adoption of artificial intelligence that shortens patient enrollment timelines. Sponsors are placing greater emphasis on end-to-end partners capable of harmonizing data privacy, supply-chain integrity, and real-world evidence generation. Regulatory initiatives such as the updated CONSORT 2025 guideline are increasing transparency requirements, which favors providers with integrated quality systems. Emerging-market participation is reshaping clinical operations, and a wave of acquisitions is giving larger vendors scale advantages in complex therapeutic areas such as oncology.
Key Report Takeaways
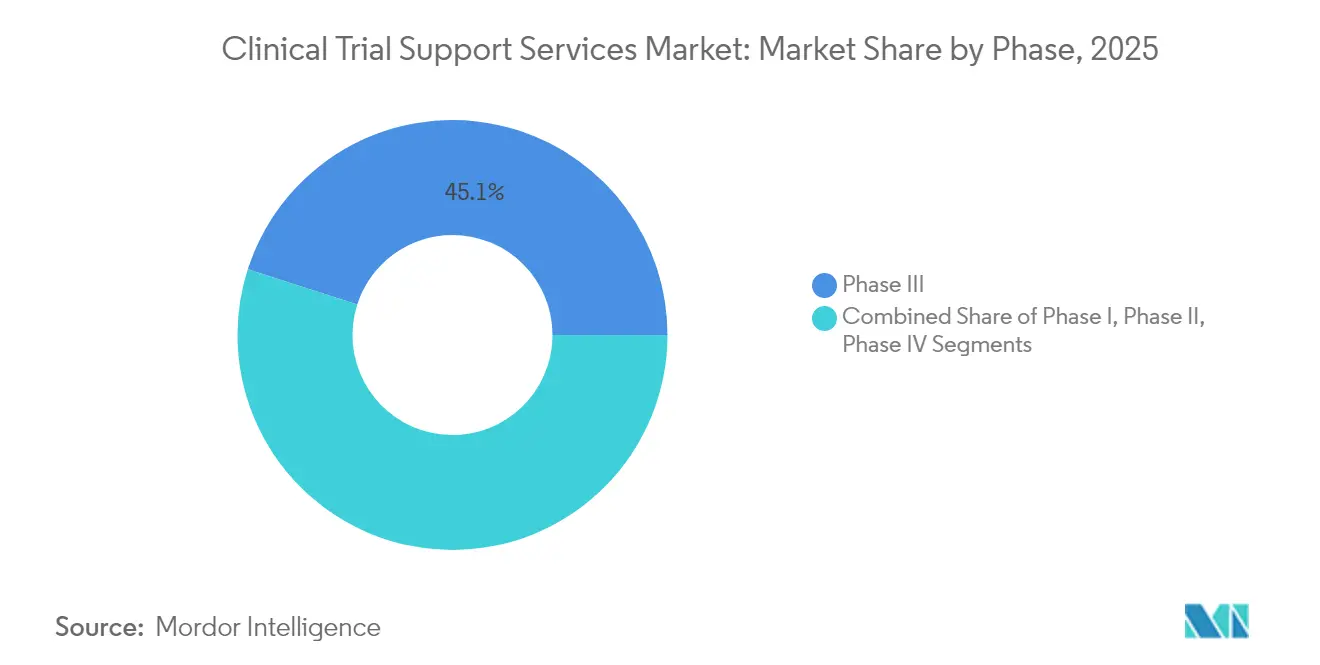
- By phase, phase III held 45.06% of clinical trial support services market share in 2025, while Phase I posted the fastest 8.86% CAGR through 2031.
- By service type, patient recruitment and retention accounted for 28.21% of the clinical trial support services market size in 2025; regulatory and consulting services are projected to expand at a 10.02% CAGR to 2031.
- By end user, pharmaceutical companies led with 48.35% revenue share in 2025 whereas biotechnology companies record the highest 9.88% CAGR through 2031.
- By therapeutic area, oncology commanded 32.08% of revenue in 2025, but immunology and autoimmune studies are forecast to grow at an 10.78% CAGR to 2031.
- By geography, North America held 38.25% of revenue in 2025; Asia-Pacific is advancing at an 11.12% CAGR through 2031.
Note: Market size and forecast figures in this report are generated using Mordor Intelligence’s proprietary estimation framework, updated with the latest available data and insights as of 2026.
Global Clinical Trials Support Services Market Trends and Insights
Drivers Impact Analysis*
| Driver | (~) % Impact on CAGR Forecast | Geographic Relevance | Impact Timeline |
|---|---|---|---|
| Outsourcing Shift Among Pharma & Biotech Toward Full-Service Providers | +1.8% | Global, with concentration in North America & Europe | Medium term (2-4 years) |
| Expansion Of Clinical Trials Into Cost-Efficient Emerging Markets | +1.2% | Asia-Pacific core, spill-over to Latin America & MEA | Long term (≥ 4 years) |
| Growing R&D Expenditure In Innovative Therapeutics & Vaccines | +1.5% | Global, led by US & China | Short term (≤ 2 years) |
| Demand For Complex Biologics & Personalized Medicine Trials | +1.4% | North America & EU, expanding to Asia-Pacific | Medium term (2-4 years) |
| AI-Driven Patient Pre-Screening Accelerating Recruitment | +0.9% | Global, with early adoption in developed markets | Short term (≤ 2 years) |
| Blockchain-Based Traceability For Investigational Supply Chains | +0.4% | North America & EU regulatory focus | Long term (≥ 4 years) |
| Source: Mordor Intelligence | |||
Outsourcing Shift Among Pharma & Biotech Toward Full-Service Providers
Global drug sponsors are consolidating vendor lists to cut coordination gaps and boost accountability. Full-service partners combine protocol design, data management, and regulatory filing under a single contract, lowering cycle times and administrative overhead. Technology alliances—such as NVIDIA’s collaboration with IQVIA that embeds AI models into clinical workflows—help vendors automate site identification, electronic source review, and adverse-event detection. The approach is especially valuable for oncology and rare-disease programs, where multidisciplinary expertise and continuous data review are critical. Biotech firms, managing capital constraints and accelerated timelines, increasingly rely on these integrated offerings to convert early-stage assets into pivotal studies.
Expansion of Clinical Trials Into Cost-Efficient Emerging Markets
Sponsors achieve 40–60% cost relief by shifting activities to Asia-Pacific hubs while accessing treatment-naive populations that speed recruitment through clinical trial patient recruitment services. China’s 3SBio secured a USD 6 billion licensing deal that demonstrates the region’s growing sophistication in late-phase execution. National regulators, such as India’s CDSCO, continue to streamline approvals, trimming site-initiation lead times. Nonetheless, infrastructure gaps and investigator training remain success determinants for sustained regional momentum.
Growing R&D Expenditure in Innovative Therapeutics & Vaccines
United States drug spending climbed 10.2% to USD 805.9 billion in 2024 as biologics and specialty vaccines dominated pipelines[1]American Society of Health-System Pharmacists, “U.S. Drug Spending Up 10.2% in 2024, with Weight Loss Drugs Remaining Top Driver,” news.ashp.org. Large, multicountry studies illustrate the operational burden: Sanofi’s PCV21 vaccine program enrolls 7,700 participants across multiple continents, demanding robust supply-chain and data-collection support. Meanwhile, million-dollar gene therapies heighten the need for meticulous early-phase monitoring and cost-containment strategies.
Demand for Complex Biologics & Personalized Medicine Trials
Biologics require stringent cold-chain, specialized storage, and advanced biomarker analytics. CAR-T cells delivered durable two-year responses in systemic sclerosis, encouraging new immunology protocols that rely on adaptive trial designs. Precision medicine elevates the role of AI-driven patient-matching platforms and real-world data linkages, evidenced by the NIH’s USD 50 million autism analytics program. Service providers that meld advanced analytics with compliance-ready infrastructure gain a competitive edge.
Restraints Impact Analysis*
| Restraint | (~) % Impact on CAGR Forecast | Geographic Relevance | Impact Timeline |
|---|---|---|---|
| Stringent Data-Privacy Regulations (GDPR, HIPAA, Etc.) | -0.8% | EU & North America, expanding globally | Medium term (2-4 years) |
| Shortage Of Qualified Investigators & Accredited Trial Sites | -1.1% | Global, acute in emerging markets | Long term (≥ 4 years) |
| Escalating Energy Costs Impacting Cold-Chain Logistics | -0.6% | Global, severe in Europe | Short term (≤ 2 years) |
| Carbon-Footprint Scrutiny On Global Trial Logistics | -0.3% | EU-led, expanding to North America | Medium term (2-4 years) |
| Source: Mordor Intelligence | |||
Stringent Data-Privacy Regulations (GDPR, HIPAA, etc.)
Data-governance mandates add complexity and cost. A U.S. federal ruling that vacated sections of the HIPAA online-tracking guidance highlights ongoing uncertainty for digital recruitment tools[2]Deborah Gersh, “Federal Judge Vacates Key Points of HHS OCR HIPAA Online Tracking Technology Guidance,” Ropes & Gray, ropesgray.com. Multinational programs often divert 15–20% of budgets to compliance experts, secure hosting, and consent-management platforms. Forty-four percent of healthcare organizations struggle with data-governance reporting, amplifying the demand for specialized risk-management software.
Shortage of Qualified Investigators & Accredited Trial Sites
Site capacity is a global bottleneck. The U.S. Department of Defense faces provider shortages in Japan and Guam, mirroring broader constraints that lengthen start-up timelines[3]United States Government Accountability Office, “DOD Is Implementing Actions to Address Challenges with Accessing Health Care in Japan and Guam,” gao.gov. International Council for Harmonisation Good Clinical Practice certification is now a baseline for site personnel, yet many emerging-market professionals still require training. Competition from other healthcare sectors inflates investigator compensation and complicates site contracting.
*Our forecasts treat driver/restraint impacts as directional, not additive. The impact forecasts reflect baseline growth, mix effects, and variable interactions.
Segment Analysis
By Phase: Early-Stage Innovation Drives Growth
Phase III commanded the largest 45.06% revenue share in 2025, reflecting its pivotal role in proving safety and efficacy to regulators. These late-stage studies often involve thousands of participants, multiple geographic regions, and stringent data-integrity checks, demanding sophisticated monitoring and real-time analytics. Sponsors increasingly integrate adaptive design elements that allow modifications without compromising statistical validity. Despite its size, Phase III cost pressures motivate companies to optimize protocol designs and leverage risk-based monitoring to reduce on-site visits.
Phase I displays the fastest 8.86% CAGR through 2031 as venture-backed biotech firms push novel modalities into first-in-human trials. Gene therapy entrants such as BlackfinBio secured Food and Drug Administration clearance for Phase 1/2 hereditary spastic paraplegia study protocols that rely on advanced viral vectors and complex dose-escalation schemes. This surge requires service partners with expertise in pharmacokinetic modeling, sentinel dosing, and intensive safety surveillance. Adaptive seamless approaches that bridge Phase I and Phase II are gaining popularity, further blurring traditional phase definitions and heightening demand for flexible, technology-ready vendors.


By Service Type: Regulatory Expertise Commands Premium
Patient recruitment and retention dominated with 28.21% share of the clinical trial support services market size in 2025, highlighting persistent enrollment challenges. Vendors deploy AI tools to match patients, predict dropout risk, and tailor engagement content to improve adherence metrics. Regulatory and consulting services, growing at 10.02% CAGR, address global guidance shifts such as the FDA’s M13A bioequivalence framework, which deepens demand for dossier preparation and strategic advice. Providers with region-specific knowledge can accelerate approvals by aligning local documentation with international standards.
Logistics innovations also propel growth. Panasonic’s VIXELL container maintains deep-frozen temperatures for ten days without power, a vital feature for mRNA and cell-therapy shipments. Integrated manufacturing and packaging arrangements help sponsors mitigate supply-chain risks and ensure investigational product integrity across continents. Advanced bio-analytical labs expand assay offerings to accommodate companion diagnostics and multi-omics endpoints, strengthening end-to-end service propositions.
By End User: Biotech Sector Fuels Expansion
Biotechnology firms record the highest 9.88% CAGR through 2031 owing to their growing pipeline depth and limited in-house infrastructure. Funding rounds such as SpliceBio’s USD 135 million Series B illustrate capital inflows that propel outsourced demand. These sponsors seek partners who can compress timelines from investigational new drug submission to first-patient-in using digitized document exchange and centralized feasibility analytics. Pharmaceutical companies remain the largest customers, leveraging long-term master service agreements and global site networks to push large, multicenter programs.
Medical-device manufacturers rely more heavily on clinical evidence to satisfy stricter post-market surveillance in Europe. Their studies, though often smaller, still demand rigorous data capture and protocol adherence. Academic institutions contribute niche expertise, especially in rare diseases where patient access is limited. Contract research organizations sometimes subcontract specialty providers for imaging, centralized monitoring, or qualified person services to fill capability gaps, reinforcing a layered contracting ecosystem.

By Therapeutic Area: Immunology Emerges as Growth Leader
Oncology retained 32.08% of global revenue in 2025 because of its deep pipeline and sustained investor interest. Complex protocol designs that require genomic profiling and long follow-up periods bolster demand for end-to-end service models with advanced bio-informatics. Immunology and autoimmune trials, however, are on track for an 10.78% CAGR, fueled by breakthroughs such as deep B-cell depletion that achieves sustained remission without chronic immunosuppression. These studies often rely on adaptive endpoints and real-world data to demonstrate meaningful clinical benefit, creating new niches for analytics-driven service providers.
Cardiology programs leverage established imaging endpoints and strong site networks but must navigate shrinking reimbursement windows that pressure trial budgets. Neurology faces slower enrollment caused by stringent inclusion criteria and functional endpoint variability, prompting use of digital biomarkers and remote assessments. Infectious disease research remains robust as sponsors pursue long-acting regimens such as Gilead’s twice-yearly HIV therapy that necessitates extended pharmacokinetic monitoring. Rare-disease work continues to attract accelerated approval pathways, cementing the need for specialized statistical support and regulatory guidance.
Geography Analysis
Asia-Pacific is advancing at an 11.12% CAGR and is set to overtake traditional hubs by the end of the decade. Government incentives, large treatment-naive populations, and faster ethics approval processes attract first-in-human studies that previously defaulted to Western sites. Countries such as China build high-throughput phase-I units capable of managing complex biologics, and technology firms in Japan deliver tailored AI agents that reduce data-entry workloads for investigators.
North America still accounts for the largest 38.25% clinical trial support services market share, supported by the Food and Drug Administration’s structured feedback mechanisms and high investigator density. Yet the region wrestles with escalating wage inflation and burnout among site staff. Resource constraints at the FDA raise concerns that application review timelines could lengthen, potentially slowing study starts and prompting sponsors to diversify geography.
Europe is respected for rigorous scientific standards and access to specialist investigators, but General Data Protection Regulation compliance complexity and elevated energy costs pressure budgets, especially for ultra-low-temperature logistics. South America and the Middle East & Africa contribute a growing share of phase II and phase III enrollment, aided by bilingual investigators, improving infrastructure, and cost savings. Long-term success in these regions will depend on sustained investments in site accreditation, cyber-secure data platforms, and region-specific patient-engagement strategies.

Competitive Landscape
Industry consolidation continues as major providers look for scale and technology depth. BioNTech’s USD 1.25 billion acquisition of CureVac expands an mRNA platform that feeds proprietary oncology studies and attracts external manufacturing contracts, illustrating vertical integration benefits. Vendors integrate digital ecosystems that connect electronic trial master files, electronic patient-reported outcomes, and centralized monitoring dashboards, lowering manual reconciliation labor.
Partnerships with technology multinationals create new service standards. NVIDIA supplies accelerated computing to simulate molecular interactions and run predictive enrollment models, enabling contract research organizations to position themselves as data-science partners rather than transactional vendors. Within therapeutic niches, boutique providers that specialize in cell and gene therapy logistics or decentralized trial wearables cultivate high-margin service lines despite their small size.
Process validation, quality-by-design documentation, and continuous manufacturing oversight gain importance as regulators require lifecycle-long evidence rather than point-in-time audits. The International Society for Pharmaceutical Engineering underscores this shift in its process-validation good-practice guide, pushing service firms to invest in quality-management platforms and cross-functional talent. Competition thus hinges on both technical breadth and the ability to assure regulators of data integrity and product-handling excellence.
Clinical Trials Support Services Industry Leaders
F. Hoffmann-La Roche Ltd.
Eli Lilly and Company
Novo Nordisk A/S
IQVIA Holdings Inc.
Laboratory Corporation of America Holdings (Labcorp)
- *Disclaimer: Major Players sorted in no particular order

Recent Industry Developments
- June 2025: BioNTech acquired CureVac for USD 1.25 billion to enhance its mRNA oncology pipeline while retaining CureVac’s Tübingen research operations.
- June 2025: NVIDIA broadened healthcare collaborations with Novo Nordisk and DCAI, deploying the Gefion supercomputer to power AI drug-discovery simulations and clinical development workflows.


Research Methodology Framework and Report Scope
Market Definitions and Key Coverage
Our study defines the clinical trial support services market as the paid, trial-specific services from patient recruitment and site management through assay development, storage, packaging, and regulatory consulting, procured by pharmaceutical, biotech, device, and CRO sponsors to run Phases I-IV and post-marketing studies. According to Mordor Intelligence, the market was worth USD 28.06 billion in 2025.
Pure software licensing (e.g., CTMS platforms) and large-scale commercial drug manufacturing fall outside this scope.
Segmentation Overview
- By Phase
- Phase I
- Phase II
- Phase III
- Phase IV / Post-marketing
- By Service Type
- Clinical Trial Site Management
- Patient Recruitment & Retention
- Assay Development & Bio-analytical Testing
- Contract Manufacturing & Packaging
- Storage & Distribution
- Regulatory & Consulting Services
- Commercialization Support
- Other Services
- By End User
- Pharmaceutical Companies
- Biotechnology Companies
- Medical Device Manufacturers
- Contract Research Organizations (CROs)
- Academic & Research Institutes
- By Therapeutic Area
- Oncology
- Cardiology
- Neurology
- Infectious Diseases
- Immunology & Autoimmune
- Other Indications
- Geography
- North America
- United States
- Canada
- Mexico
- Europe
- Germany
- United Kingdom
- France
- Italy
- Spain
- Rest of Europe
- Asia-Pacific
- China
- Japan
- India
- South Korea
- Australia
- Rest of Asia-Pacific
- Middle East and Africa
- GCC
- South Africa
- Rest of Middle East and Africa
- South America
- Brazil
- Argentina
- Rest of South America
- North America
Detailed Research Methodology and Data Validation
Primary Research
Mordor analysts interviewed CRO pricing leads, clinical supply managers, and site coordinators across North America, Europe, and key Asia-Pacific hubs. These conversations validated typical outsourcing ratios, recent average selling prices, and emerging demand drivers such as hybrid trial protocols, filling gaps that desk work alone could not bridge.
Desk Research
We grounded the model in open datasets that track real trial activity, such as ClinicalTrials.gov, the WHO-ICTRP portal, and EMA's EudraCT, which reveal yearly starts by phase and geography. Public filings, 10-Ks, and investor decks from leading CROs provide revenue splits that map back to distinct service buckets. Trade associations, PhRMA, EFPIA, IFPMA, and DIA supply R&D spend trends, while customs and shipment statistics from UN Comtrade clarify investigational product flows. Complementary insight comes from peer-reviewed journals on decentralized trial uptake, FDA and MHRA guidance notes, and paid archives (D&B Hoovers, Dow Jones Factiva) that verify company-level service revenues. The listed sources are illustrative; many other publications informed data checks and narrative framing.
Market-Sizing & Forecasting
A top-down and bottom-up hybrid was used. We first rebuilt the global demand pool from annual interventional trial counts by phase, multiplied by average outsourced spend per patient and typical enrollment sizes. Results were then cross-checked with sampled CRO service revenues and channel checks. Variables like R&D outlays, oncology pipeline size, DCT penetration rates, mean IMP shipment weight, and average recruitment cycle time inform the base year and feed a multivariate regression that projects value through 2030. Where bottom-up samples under-represented smaller regions, proportional shares were inferred from trial-site density patterns before final triangulation.
Data Validation & Update Cycle
Each draft model passes variance checks against independent metrics, followed by peer review. Reports refresh annually, with interim corrections when material events, major M&A or regulatory shifts, move the market. Just before release, an analyst re-runs key datasets so clients receive the latest view.
Why Mordor's Clinical Trials Support Services Baseline Commands Trust
Published figures often diverge because firms apply different service mixes, currency bases, and refresh cadences. Our disciplined scope alignment, explicit exclusion of pure software revenues, and yearly trial-count anchoring keep Mordor's baseline stable yet responsive.
Benchmark comparison
| Market Size | Anonymized source | Primary gap driver |
|---|---|---|
| USD 28.06 bn | Mordor Intelligence | - |
| USD 25.62 bn | Global Consultancy A | Uses 2024 exchange rates and omits assay development revenues |
| USD 27.09 bn | Industry Journal B | Counts only outsourced spend in North America and Europe |
These contrasts show that once differing scopes and geographic filters are removed, Mordor's balanced, transparent baseline remains the most dependable starting point for strategic planning.


Key Questions Answered in the Report
What is the current value of the clinical trial support services market?
The market is valued at USD 30.01 billion in 2026 and is projected to reach USD 41.98 billion by 2031.
Which phase of clinical development commands the largest spending on support services?
Phase III accounts for 45.06% of total spending because of its scale and regulatory significance.
Why is Asia-Pacific growing faster than other regions?
Cost advantages, large patient pools, and streamlined regulatory reforms drive an 11.12% CAGR in Asia-Pacific.
What service category is expanding the quickest?
Regulatory and consulting services are growing at a 10.02% CAGR owing to increasingly complex global approval requirements.
How are data-privacy rules affecting clinical trial outsourcing?
GDPR and HIPAA compliance can add up to 20% to trial budgets, favoring providers with advanced governance frameworks.
Which therapeutic field shows the strongest growth outlook?
Immunology and autoimmune indications are forecast to grow at an 10.78% CAGR, supported by breakthroughs such as CAR-T therapies.
Page last updated on:


