Oncology Clinical Trials Market Size and Share
Market Overview
| Study Period | 2020 - 2031 |
|---|---|
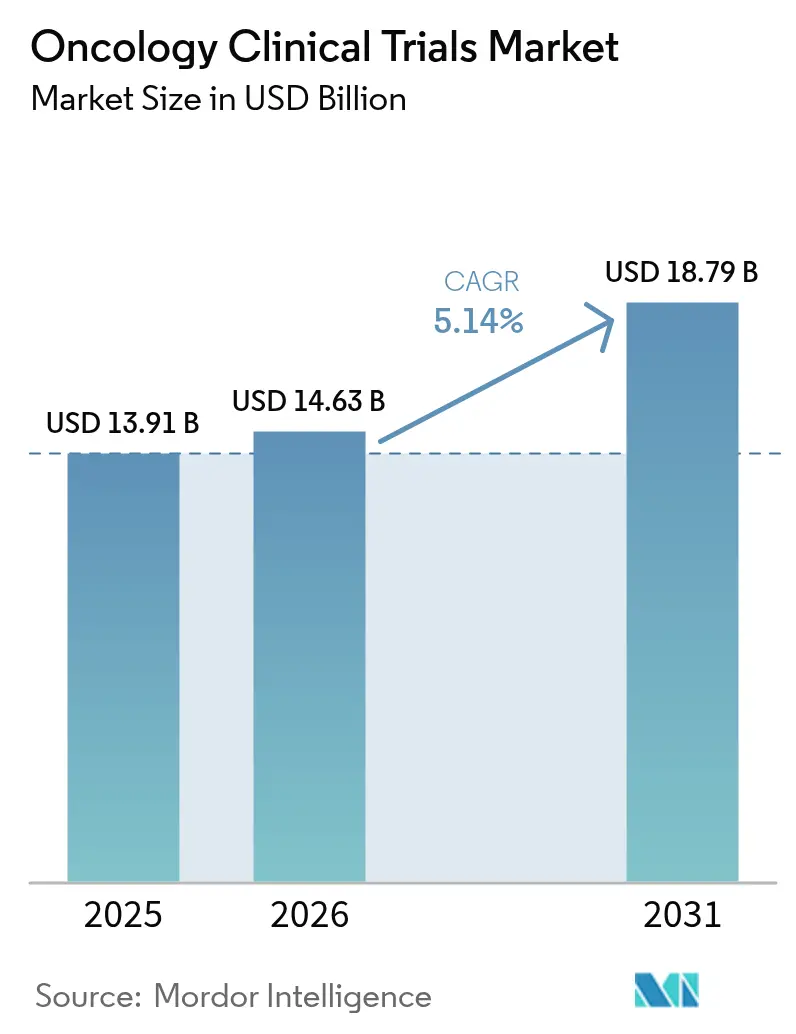
| Market Size (2026) | USD 14.63 Billion |
| Market Size (2031) | USD 18.79 Billion |
| Growth Rate (2026 - 2031) | 5.14% CAGR |
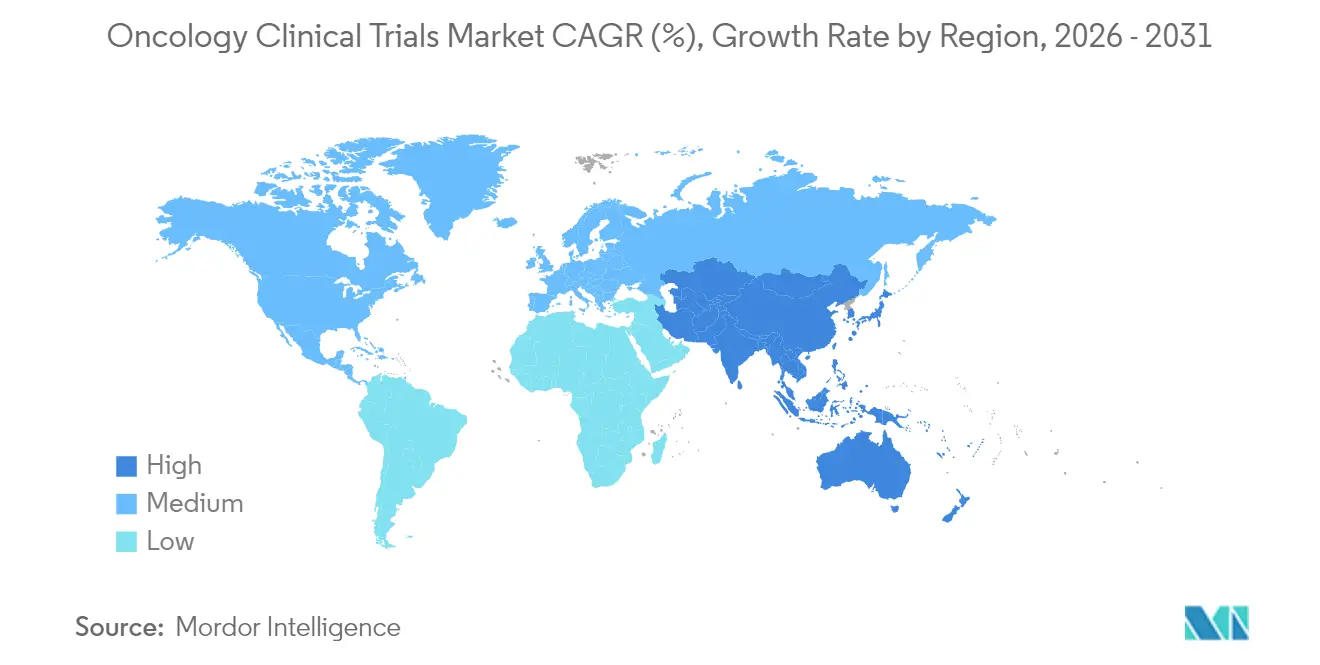
| Fastest Growing Market | Asia-Pacific |
| Largest Market | North America |
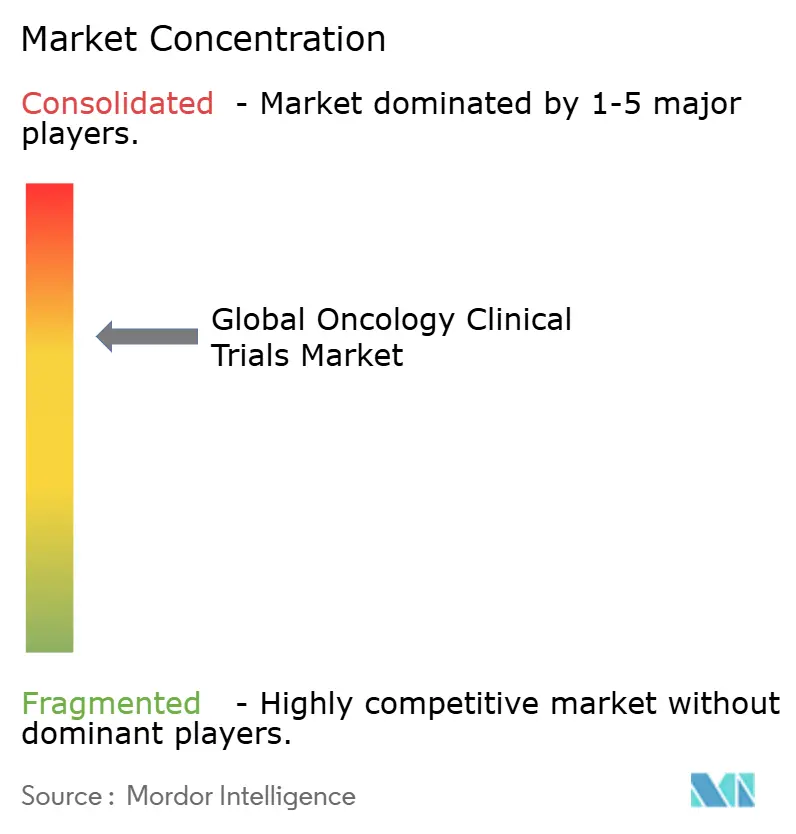
| Market Concentration | Medium |
Major Players *Disclaimer: Major Players sorted in no particular order Image © Mordor Intelligence. Reuse requires attribution under CC BY 4.0. | |
Oncology Clinical Trials Market Analysis by Mordor Intelligence
The oncology clinical trials market size was valued at USD 13.91 billion in 2025 and estimated to grow from USD 14.63 billion in 2026 to reach USD 18.79 billion by 2031, at a CAGR of 5.14% during the forecast period (2026-2031). This sustained expansion reflects the steady rise in global cancer incidence, the growing influence of precision-medicine protocols, and continued regulatory willingness to fast-track transformative therapies. Pharmaceutical and biotechnology companies keep allocating the largest share of their R&D budgets to oncology, and their demand for multi-regional studies is encouraging trial-site expansion in Asia-Pacific. At the same time, technology-enabled patient matching and hybrid evidence protocols are easing long-standing recruitment bottlenecks while cutting data-collection burdens. Competitive intensity remains moderate as the leading nine CROs command roughly 60% of total revenue, yet smaller providers retain room for differentiation through cell-and-gene-therapy or decentralized-trial specialization.
Key Report Takeaways
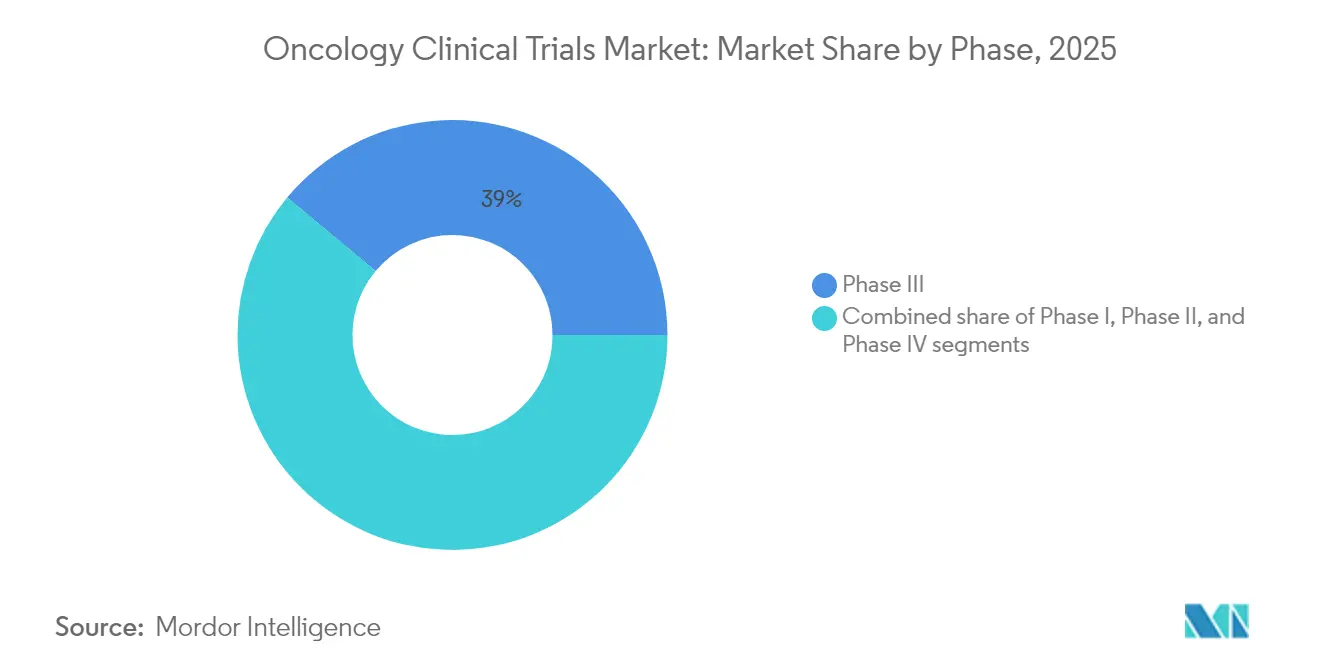
- By phase, Phase III dominated with 38.96% of oncology clinical trials market share in 2025, whereas Phase I is forecast to grow fastest at a 7.52% CAGR through 2031.
- By study design, treatment/interventional trials held 72.10% revenue share in 2025; observational studies are set to expand at a 6.74% CAGR to 2031.
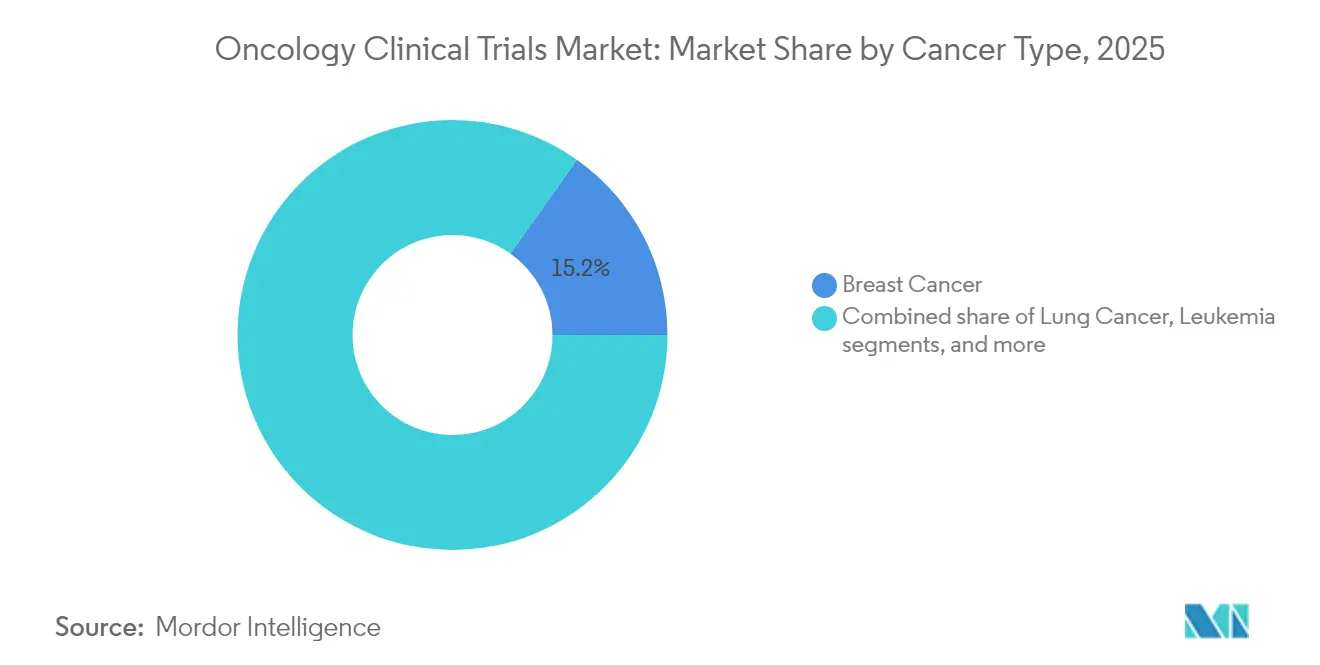
- By cancer type, breast cancer accounted for 15.18% of the oncology clinical trials market size in 2025, while prostate cancer postings lead growth at 7.90% CAGR.
- By therapeutic modality, immunotherapy led with 33.65% revenue share in 2025; cell-and-gene therapy is projected to accelerate at an 7.63% CAGR through 2031.
- By geography, North America held 46.12% of global revenue in 2025; Asia-Pacific is advancing fastest at a 6.31% CAGR to 2031.
Note: Market size and forecast figures in this report are generated using Mordor Intelligence’s proprietary estimation framework, updated with the latest available data and insights as of 2026.
Global Oncology Clinical Trials Market Trends and Insights
Driver Impact Analysis*
| Driver | % Impact on CAGR Forecast | Geographic Relevance | Impact Timeline |
|---|---|---|---|
| Rising global cancer incidence & prevalence | +1.2% | Highest in Asia-Pacific and other emerging markets | Long term (≥ 4 years) |
| Increasing pharma & biotech oncology-R&D spend | +1.0% | North America & Europe; expanding to Asia-Pacific | Medium term (2-4 years) |
| Fast-track regulatory pathways (Breakthrough, PRIME, etc.) | +0.8% | North America & EU; spill-over to Asia-Pacific | Short term (≤ 2 years) |
| Precision-medicine & biomarker-driven therapy momentum | +0.9% | Advanced markets worldwide | Medium term (2-4 years) |
| Expansion of trial sites in emerging-market secondary hospitals | +0.7% | Asia-Pacific core; Latin America & Eastern Europe | Long term (≥ 4 years) |
| Real-world-data integration shaping hybrid evidence protocols | +0.6% | North America & EU leading; global adoption following | Medium term (2-4 years) |
| Source: Mordor Intelligence | |||
Rising Global Cancer Incidence & Prevalence
Cancer cases are projected to surpass 35 million annually by 2050, placing persistent demand on the oncology clinical trials market[1]G.-M. Li et al., “Global Cancer Burden and Trends,” Cell, cell.com. Aging populations in developed economies and lifestyle shifts in emerging markets are reshaping epidemiology, while biomarker-defined subgroups fragment patient pools into smaller cohorts that need targeted recruitment tactics. China’s large treatment-naïve populations now attract both domestic and multinational sponsors; local cancer registries are becoming essential for biomarker-stratified enrollment. CROs able to integrate registry data with real-time algorithms gain a clear competitive edge. The resulting rise in multi-regional trials supports broader regulatory submissions and improves data diversity.
Increasing Pharma & Biotech Oncology-R&D Spend
Leading drug makers directed 40–50% of their 2024 development budgets toward oncology programs, seeking premium-priced launches and combination portfolios. AstraZeneca’s strategic target of USD 80 billion revenue by 2030 underscores its oncology focus. Venture funding for oncology start-ups broke records in 2024, yet policy moves such as the Inflation Reduction Act are sharpening project selection toward first-in-class or best-in-class assets. Platform technologies—especially antibody-drug conjugates and cell therapies—require high upfront capital but promise repeatable indications, pushing sponsors into deeper alliances with specialty biotechs. Those collaborations share risk, accelerate technology transfer, and broaden therapeutic exploration.
Fast-Track Regulatory Pathways (Breakthrough, PRIME, etc.)
The FDA’s breakthrough therapy designation trims median development timelines by roughly 3.2 years compared with standard routes, and initiatives such as Project Pragmatica promote leaner eligibility and data-collection frameworks[2]U.S. Food and Drug Administration, “Project Pragmatica,” fda.gov. The European Medicines Agency delivers similar acceleration through its PRIME program, offering iterative scientific advice and rapid assessment. Sponsors increasingly design Phase I–II studies to generate breakthrough-level data, with success rates for designated drugs nearing 85% at final approval. In response, trial protocols emphasize adaptive designs and surrogate endpoints that can validate early signals without compromising statistical rigor. This emphasis on expedited pathways is now viewed as essential to maintain competitive launch windows.
Precision-Medicine & Biomarker-Driven Therapy Momentum
More than 70% of the oncology drugs cleared in 2024 required companion diagnostics or biomarker stratification, confirming precision medicine as the new standard. Advances in next-generation sequencing and liquid biopsy facilitate real-time monitoring, improving safety assessment while strengthening therapeutic accuracy. The FDA’s tissue-agnostic approvals for pembrolizumab based on PD-L1 reinforce broad regulatory acceptance of biomarker-guided approaches. AI platforms such as PRISM and TrialMatchAI deliver 92% accuracy in matching patients with protocols by parsing electronic health-record variables against complex inclusion criteria. Organizations capable of merging genomic data with AI-driven screening unlock faster enrollment and higher probability-of-success metrics.
Restraints Impact Analysis*
| Restraints Impact Analysis | (~) % Impact on CAGR Forecast | Geographic Relevance | Impact Timeline |
|---|---|---|---|
| Stringent, complex eligibility criteria slow recruitment | −0.8% | Global; particularly acute in niche cancer subtypes | Short term (≤ 2 years) |
| Escalating trial costs and operational burden | −0.6% | North America & Europe; spreading globally | Medium term (2-4 years) |
| Patient-pool saturation from overlapping competing studies | −0.5% | Urban academic hubs in high-trial-density regions | Medium term (2-4 years) |
| Cross-border data-privacy laws complicate multi-region trials | −0.4% | EU (GDPR), China CSL, emerging stricter regimes worldwide | Long term (≥ 4 years) |
| Source: Mordor Intelligence | |||
Stringent, Complex Eligibility Criteria Slow Recruitment
Only 17.0% of oncology patients qualify for trials under legacy inclusion rules, while 56.0% have no local study options. Research confirms that removing three common exclusion factors can double eligible populations without undermining safety. Precision protocols requiring multiple genetic alterations further narrow pools to segments representing fewer than 5% of patients. The Clinical Trials Transformation Initiative lists patient identification as the chief recruitment hurdle, escalating the need for AI-powered screening tools. Regulators now encourage broader eligibility, yet site adoption remains uneven, prolonging startup timelines and boosting per-patient costs.
Escalating Trial Costs and Operational Burden
Median Phase III study spend climbed to USD 36.58 million in 2024—30% above 2018—after protocol procedures rose 67% from 2009-2020. Trial start delays jumped to 21.8%, further inflating budgets. Complexity expands as hybrid data capture, decentralized visits, and patient-reported outcomes become routine, demanding robust infrastructure and specialized staffing. Meanwhile, the likelihood of approval for drugs entering trials in 2011-2020 slipped to 7.9%, intensifying margin pressure. Sponsors are deploying AI design tools and decentralized platforms to contain costs, yet uptake varies widely across organizations, highlighting persistent gaps in digital capability.
*Our forecasts treat driver/restraint impacts as directional, not additive. The impact forecasts reflect baseline growth, mix effects, and variable interactions.
Segment Analysis
By Phase: Early-Stage Innovation Drives Growth
Phase III trials held 38.96% of 2025 revenue, confirming their financial weight in the oncology clinical trials market. Sponsors allocate significant capital to these pivotal studies because regulatory approvals and reimbursement are directly tied to Phase III success rates. At the other end, Phase I volumes are rising at a 7.52% CAGR as novel modalities enter first-in-human pipelines earlier. Adaptive platform formats help developers test multiple candidates and dosing regimens concurrently, trimming timelines and heightening portfolio optionality. START’s new Shanghai Phase I center—China’s first to align with major agency standards—illustrates how geographic diversification supports regional filings and access to naïve populations.
Global demand for early-stage capacity also drives CRO expansion into oncology-focused incubators and translational-medicine hubs. Biomarker selection in Phase I improves downstream efficiency by filtering non-responders early, lifting compound survival odds. Phase II studies serve as inflection points where efficacy proof can justify breakthrough designations and investor commitments. Post-approval Phase IV trials are now essential for real-world safety surveillance, a requirement that increasingly includes decentralized follow-up and digital symptom tracking.


By Design: Real-World Evidence Reshapes Trial Architecture
Treatment/interventional models commanded 72.10% of total revenue in 2025, emphasizing their central role in validating clinical benefit. Regulatory authorities still regard randomized controlled trials as the highest evidentiary standard, especially for curative-intent indications. Even so, the 6.74% CAGR forecast for observational studies underscores mounting interest in real-world evidence to complement controlled endpoints. The FDA’s Real-World Evidence Program provides a formal regulatory framework, encouraging hybrid designs that blend randomization with pragmatic data capture.
Decentralized clinical trials expand reach to rural and mobility-constrained patients, cutting travel barriers and enriching recruitment pools. Electronic PRO platforms such as eSyM improve symptom surveillance and reduce acute care utilization. Pragmatic designs championed by Project Pragmatica limit data fields to those essential for decision-making, curbing operational overhead. As sponsors fine-tune site selection algorithms, protocol customization can align with region-specific standard-of-care benchmarks, thereby reducing deviations and boosting retention.
By Cancer Type: Prostate Cancer Emerges as Growth Leader
Breast cancer retained 15.18% of 2025 revenue, reflecting its continued prominence within the oncology clinical trials market. Multiple biomarker subtypes—HER2-positive, triple-negative, ER-positive—create ongoing need for combination regimens and maintenance strategies. Prostate cancer, however, is tracking an 7.90% CAGR through 2031, fueled by PARP inhibitor add-ons, PSMA-targeted radioligands, and advanced imaging-guided interventions. Lung cancer remains vibrant, especially EGFR-mutant nonsmall-cell assays evaluating antibody-drug conjugates and bispecific antibodies.
Tumor-agnostic approvals accelerate basket trials in indications defined by molecular drivers rather than anatomical origin. For instance, HER3-DXd delivered promising responses across colorectal, biliary, and head-and-neck settings. Liquid biopsy adoption allows real-time ctDNA tracking to flag minimal residual disease and emerging resistance mechanisms, supporting adaptive protocol amendments without interrupting enrollment.
By Therapeutic Modality: Cell and Gene Therapy Accelerates
Immunotherapies led revenue at 33.65% in 2025, anchored by checkpoint inhibitor maintenance in multiple tumor types. Nonetheless, cell-and-gene therapies are advancing at an 7.63% CAGR and represent the fastest-growing slice of the oncology clinical trials market. CAR-T platforms such as satri-cel have now entered solid-tumor testing phases, broadening their addressable population. Antibody-drug conjugates benefit from linker-payload advances, enabling higher potency while mitigating off-target toxicity.
Manufacturing complexity for autologous cell therapies shifts site selection toward regions with cryogenic logistics capacity and regulatory familiarity. Sponsors invest in cloud-based chain-of-identity systems to satisfy agency traceability demands. Combination regimens pairing checkpoint inhibitors with cellular therapies aim to overcome tumor micro-environment resistance, adding layers of trial complexity but promising transformational efficacy gains.
Geography Analysis
North America retained industry leadership with 46.12% revenue in 2025, supported by the FDA’s flexible fast-track mechanisms and robust payer infrastructure. Academic centers furnish deep expertise in molecular oncology, enabling intricate adaptive protocols. Yet policy debates on drug-pricing reform and potential HHS budget constraints introduce strategic uncertainty that could temper new-trial volume. Sponsors respond by prioritizing high-value assets and emphasizing surrogate endpoints to secure quicker returns.
Asia-Pacific is the fastest-growing territory, progressing at a 6.31% CAGR to 2031. China accounted for 26.5% of new global trial starts in 2024 after slashing review timelines from 265 to 65 days, making it the prime destination for large-scale, treatment-naïve enrollment. India’s streamlined 2019 rules offer similar efficiency, and oncology-specific clusters in Hyderabad and Bengaluru provide specialized Phase I infrastructure. Regional governments fund local genomic initiatives, expanding the precision-medicine ecosystem and improving trial readiness.
Europe maintains a vibrant oncology clinical trials market through EMA harmonization and strong academic–industry synergy. GDPR demands sophisticated data-privacy compliance, prompting sponsors to adopt federated-data architectures that anonymize personal health information at the source. Eastern Europe joins Latin America and the Middle East as emerging secondary hubs; lower per-patient costs and faster enrollment appeal to cost-sensitive sponsors, even if infrastructure variability still requires targeted site mentorship. Decentralized technologies mitigate cross-border logistics by bringing remote visits, eConsent, and home health-nursing to diverse settings.

Competitive Landscape
Moderate consolidation defines the oncology clinical trials market: the top nine CROs control roughly 60% of global revenue, giving large biopharma ample partner choice while pressuring midsize providers to specialize or merge. IQVIA reported USD 3.829 billion in Q1 2025 revenue with a contracted backlog of USD 31.5 billion, underscoring scale-driven bargaining power. Parexel, ICON, and Syneos Health are leveraging artificial-intelligence investment to sharpen study-startup and enrollment projections. Smaller specialists such as Worldwide Clinical Trials focus on cell-and-gene-therapy manufacturing know-how to defend margin.
Technology adoption is now the primary competitive differentiator. AI-enabled patient-matching systems achieve 92% precision in aligning candidate profiles with protocol rules, compressing screening cycles and de-risking recruitment. CROs partner with digital-health companies such as Medable to embed decentralized trial toolkits, integrating ePRO, tele-visit, and home-nursing modules. M&A momentum remains brisk: palleos healthcare’s merger with OCT Clinical expanded European reach and therapeutic breadth, pointing to renewed interest in regional-expertise roll-ups.
Therapeutic-area depth also shapes market positioning. Providers with dedicated immuno-oncology, radiopharmaceutical, or cellular-therapy units secure premium budgets as sponsors pursue novel modalities. Conversely, CROs lacking molecular pathology or viral-vector manufacturing capabilities risk relegation to less complex indications. Talent scarcity in biostatistics, regulatory affairs, and quality assurance continues to tighten labor markets, making retention strategies and professional-development programs central to sustaining delivery standards.
Oncology Clinical Trials Industry Leaders
IQVIA
Parexel International
ICON plc
Syneos Health
Labcorp Drug Development
- *Disclaimer: Major Players sorted in no particular order

Recent Industry Developments
- June 2025: Charles River Laboratories expanded in-vitro oncology services and launched Apollo for CRADL, a cloud platform that streamlines discovery workflows Charles River.
- June 2025: START and OneOncology partnered to build early-phase trial sites across the United States, improving patient access to experimental therapies Clinical Trials Arena.
- May 2025: Medable rolled out an integrated oncology trial platform aimed at cutting logistical hurdles through digital engagement Pharmafile.
- March 2025: AstraZeneca acquired Fusion Pharmaceuticals for USD 2 billion to fortify its radioconjugate pipeline HIT Consultant.
- February 2025: Merck entered an exclusive global license for LM-299, an anti-PD-1/VEGF bispecific antibody from LaNova Medicines, diversifying its immunotherapy arsenal Merck.


Research Methodology Framework and Report Scope
Market Definitions and Key Coverage
Our study defines the oncology clinical trials market as the aggregate sponsor spend flowing into regulated Phase I-IV studies that evaluate investigational or repurposed anticancer therapeutics in humans. Spend covers site fees, CRO fees, patient-related costs, biomarker and imaging assessments, and regulatory submissions.
Scope exclusion: purely in-silico simulation studies and long-term post-marketing registries are outside the baseline.
Segmentation Overview
- By Phase
- Phase I
- Phase II
- Phase III
- Phase IV
- By Design
- Treatment / Interventional Studies
- Observational Studies
- By Cancer Type
- Lung Cancer
- Breast Cancer
- Colorectal Cancer
- Leukemia
- Prostate Cancer
- Other Cancers
- By Therapeutic Modality
- Immunotherapy
- Targeted Therapy
- Chemotherapy
- Cell & Gene Therapy
- Other Therapeutic Modalities
- Geography
- North America
- United States
- Canada
- Mexico
- Europe
- Germany
- United Kingdom
- France
- Italy
- Spain
- Rest of Europe
- Asia-Pacific
- China
- Japan
- India
- Australia
- South Korea
- Rest of Asia-Pacific
- Middle East & Africa
- GCC
- South Africa
- Rest of Middle East & Africa
- South America
- Brazil
- Argentina
- Rest of South America
- North America
Detailed Research Methodology and Data Validation
Primary Research
Analysts interview medical oncologists, CRO budgeting heads, trial operations managers, and regulators across North America, Europe, and Asia-Pacific. These discussions clarify real-world screen-fail rates, biomarker testing costs, and regional patient stipend norms, closing gaps left by desk research.
Desk Research
We start with publicly available fundamentals-trial-registry datasets (ClinicalTrials.gov, EU-CTR), national cancer statistics (SEER, GLOBOCAN), FDA and EMA fast-track approvals, and trade-association briefs such as ACTA and PhRMA. Cost inputs are cross-checked against academic meta-analyses in JAMA Oncology and BMJ Open, while company 10-Ks, investor decks, and select Dow Jones Factiva news help refine sponsor mix and protocol attrition assumptions. Our analysts also tap D&B Hoovers for CRO revenue splits and Questel for oncology-focused patent velocity. This list is illustrative, not exhaustive.
Market-Sizing & Forecasting
We anchor a top-down model that rebuilds annual spend from active protocol counts by phase and geography, multiplied by average patients per protocol and median cost per patient. Bottom-up checks, sampled CRO fee schedules, site capacity audits, and average selling price times volume for key lab tests calibrate totals before finalization. Key variables include global new cancer cases, active oncology protocol starts, average enrollment duration, median per-patient direct cost, proportion of immunotherapy trials, and FDA Breakthrough designations. Forecasts use a multivariate regression that links spend growth to cancer incidence trends, R&D intensity indices, and fast-track approval momentum, adjusted through scenario analysis when primary experts flag step changes.
Data Validation & Update Cycle
Results pass variance tests versus historical spend, registry growth, and CRO revenue disclosures. Senior reviewers interrogate anomalies, and any material market event triggers a rapid model refresh. Reports are rebuilt annually, with an analyst performing a fresh sense check just before delivery.
Why Our Oncology Clinical Trials Baseline Commands Reliability
Published figures often diverge because analysts pick different cost baskets, treat hybrid decentralized trials inconsistently, or project enrollment curves with one-size-fits-all multipliers.
Key gap drivers include the inclusion of support services such as imaging or data management in some scopes, varying attrition assumptions, differing refresh cadences, and unvalidated phase-mix projections. For instance, a 2024 estimate from a global consultancy reached USD 17.52 billion by bundling diagnostic imaging spend, while a trade journal's 2023 figure of USD 13.71 billion applied straight-line growth to registry counts. A 2024 industry association view at USD 13.60 billion relied solely on registered trials without spend normalization.
Benchmark comparison
| Market Size | Anonymized source | Primary gap driver |
|---|---|---|
| USD 13.91 billion (2025) | Mordor Intelligence | - |
| USD 17.52 billion (2024) | Global Consultancy A | Bundles diagnostic imaging and support services; limited primary validation |
| USD 13.71 billion (2023) | Trade Journal B | Linear extrapolation; excludes early termination attrition |
| USD 13.60 billion (2024) | Industry Association C | Counts trials, not spend; no cost per patient weighting |
Taken together, the comparison shows that Mordor's disciplined selection of spend components, live phase mix tracking, and yearly refresh delivers a balanced, transparent baseline that decision-makers can retrace and stress test with confidence.


Key Questions Answered in the Report
What is the current value of the oncology clinical trials market?
The oncology clinical trials market stands at USD 14.63 billion in 2026 and is on track to reach USD 18.79 billion by 2031.
Which geographic region is expanding fastest?
Asia-Pacific leads growth with a forecast 6.31% CAGR, propelled by regulatory acceleration in China and India and access to treatment-naïve populations.
Why are Phase I trials gaining momentum?
Early-stage innovation, adaptive platform protocols, and growth in cell-and-gene therapy pipelines are pushing Phase I volumes to a 7.52% CAGR.
How significant are real-world evidence studies?
Observational and hybrid designs are expanding at a 6.74% CAGR as regulators increasingly accept real-world data for safety and effectiveness decisions.
What operational challenges remain most pressing?
Escalating Phase III costs averaging USD 36.58 million and stringent eligibility criteria that limit patient access continue to strain timelines and budgets.
Which therapeutic modality shows the fastest growth?
Cell-and-gene therapy commands the highest CAGR at 7.63%, aided by breakthroughs in CAR-T and gene-edited platforms that broaden solid-tumor applications.
Page last updated on:


