Clinical Trial Supply Market Size and Share
Market Overview
| Study Period | 2020 - 2031 |
|---|---|
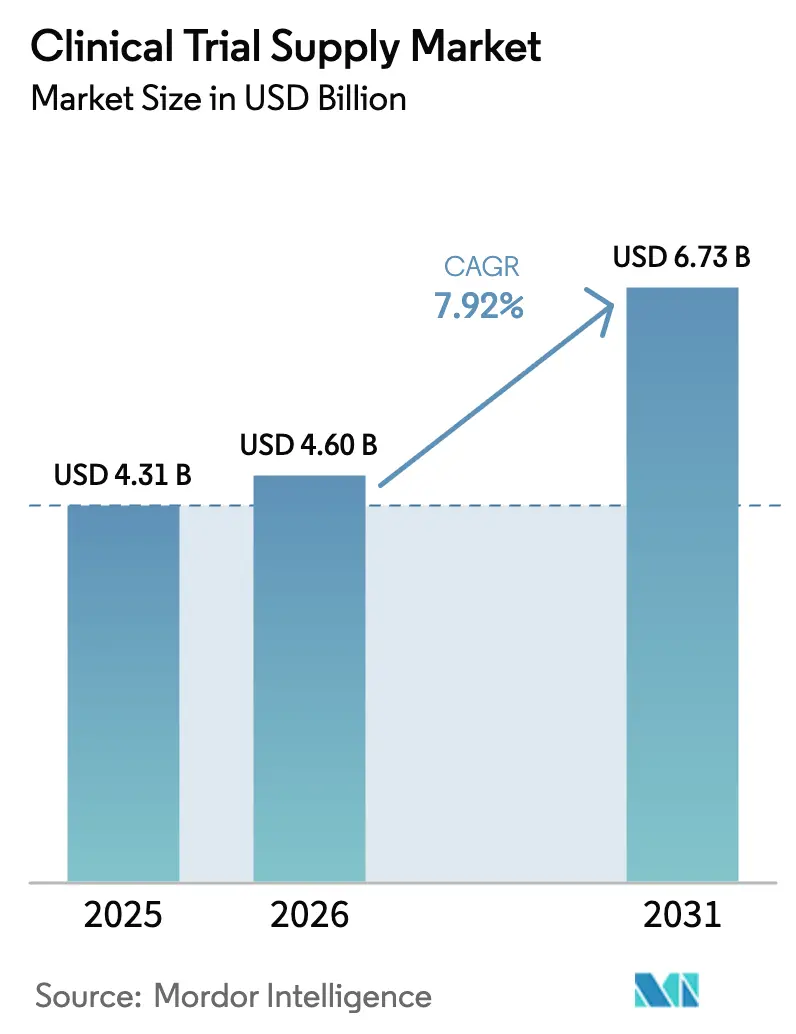
| Market Size (2026) | USD 4.60 Billion |
| Market Size (2031) | USD 6.73 Billion |
| Growth Rate (2026 - 2031) | 7.92% CAGR |
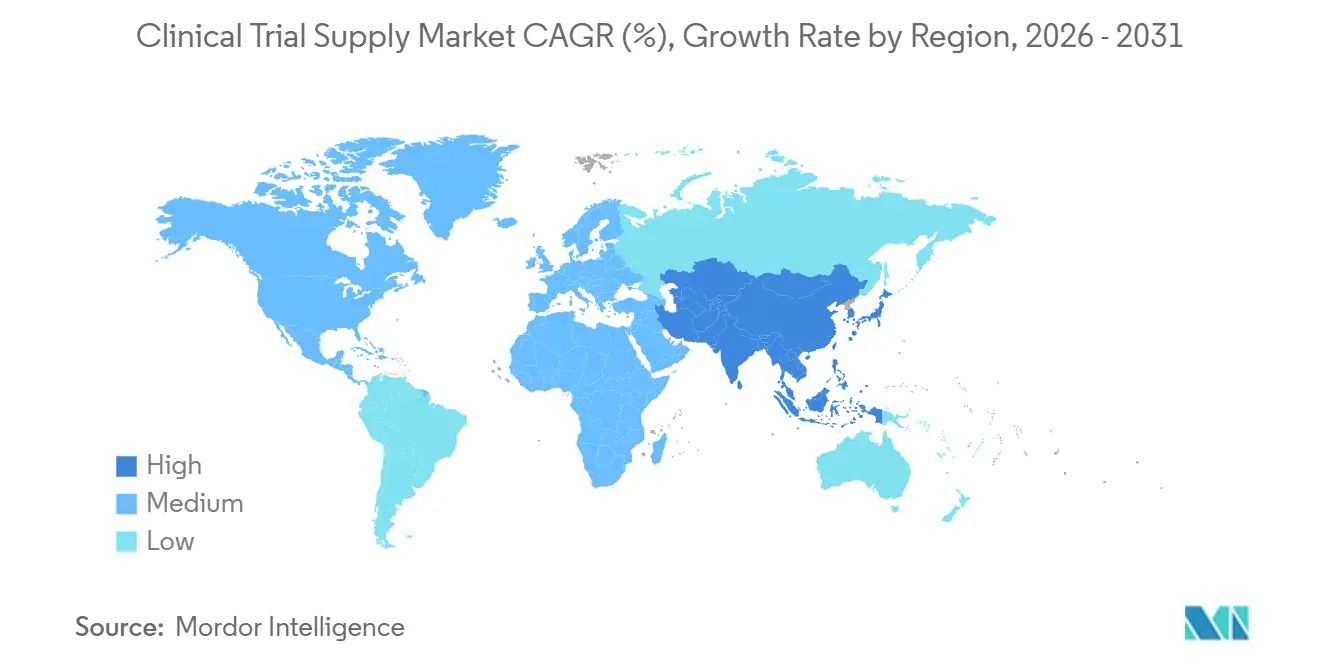
| Fastest Growing Market | Asia-Pacific |
| Largest Market | North America |
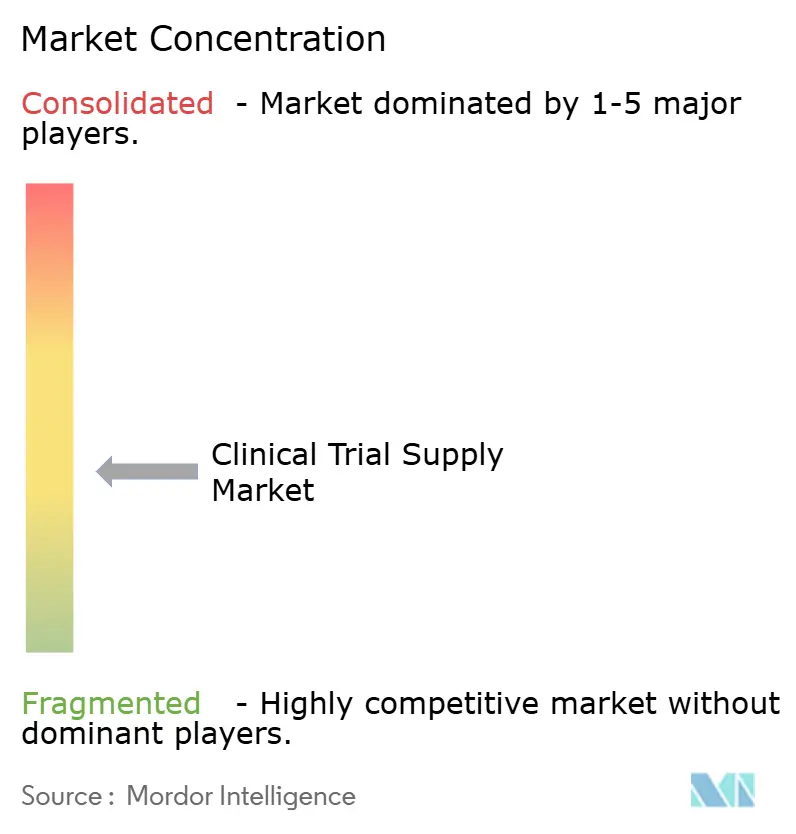
| Market Concentration | Medium |
Major Players *Disclaimer: Major Players sorted in no particular order Image © Mordor Intelligence. Reuse requires attribution under CC BY 4.0. | |
Clinical Trial Supply Market Analysis by Mordor Intelligence
The Clinical Trial Supply Market size was valued at USD 4.31 billion in 2025 and is estimated to grow from USD 4.60 billion in 2026 to reach USD 6.73 billion by 2031, at a CAGR of 7.92% during the forecast period (2026-2031).
Rising sponsor demand for end-to-end outsourcing, a surge in multicountry Phase III protocols, and wider adoption of decentralized designs are shortening study cycles, intensifying the need for integrated logistics partners, and widening the revenue pool for value-added services. Comparator sourcing is becoming more complex as regulators tighten equivalency rules, while reusable cold-chain containers aligned with ISO 21973 are improving sustainability credentials and lowering excursion risk. Growth also reflects the steady migration of temperature-sensitive biologics into mid- and late-stage pipelines, a trend that favors providers with cryogenic capacity and real-time inventory visibility. Competitive differentiation now hinges on AI-driven demand forecasting, blockchain-enabled chain-of-custody, and cyber-secure interactive response technology, each of which reduces waste, prevents kit misallocation, and protects trial continuity.
Key Report Takeaways
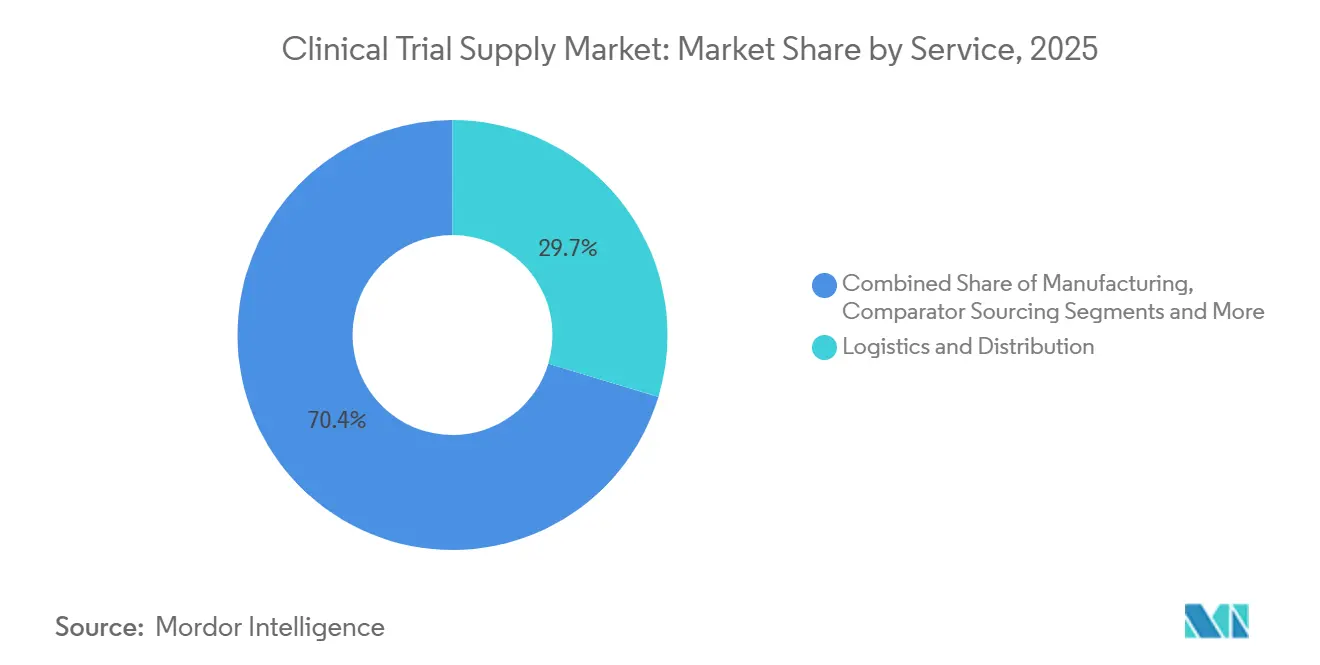
- By service, logistics and distribution led with 29.65% revenue share in 2025, while manufacturing services are forecast to expand at a 9.32% CAGR through 2031.
- By phase, Phase III commanded 41.24% of volume in 2025, whereas Phase II is projected to grow at 10.72% annually over 2026-2031.
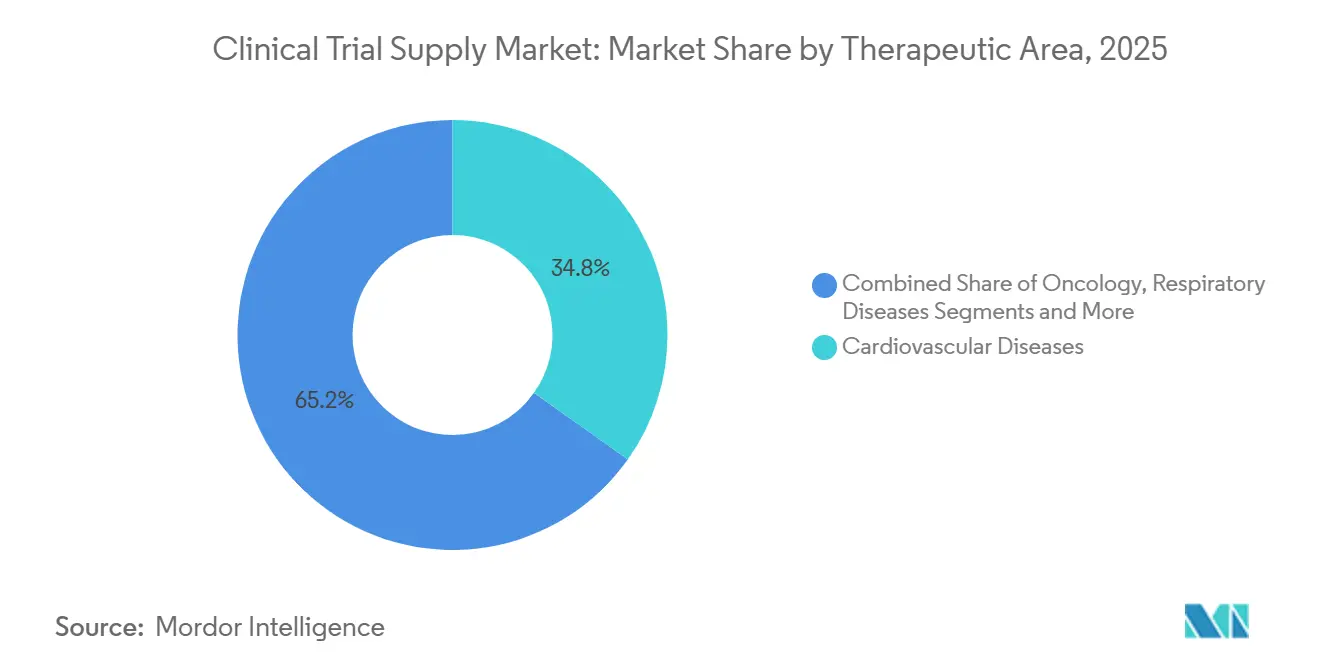
- By therapeutic area, cardiovascular disease accounted for 34.82% of demand in 2025, while oncology is advancing at a 12.64% CAGR to 2031.
- By end user, pharmaceutical companies represented 44.14% of spend in 2025, yet biologics and biotech firms are rising at a 10.41% CAGR through 2031.
- By geography, North America captured 35.77% of revenue in 2025, whereas Asia-Pacific is set to expand at a 9.44% CAGR over the forecast horizon.
Note: Market size and forecast figures in this report are generated using Mordor Intelligence’s proprietary estimation framework, updated with the latest available data and insights as of 2026.
Global Clinical Trial Supply Market Trends and Insights
Drivers Impact Analysis*
| Driver | (~) % Impact on CAGR Forecast | Geographic Relevance | Impact Timeline |
|---|---|---|---|
| Increasing Volume of Phase III Multicountry Trials | +1.8% | Global, concentrated in North America, EU, APAC | Medium term (2-4 years) |
| Expansion of Decentralized & Direct-To-Patient Logistics Models | +1.5% | North America and EU lead; APAC adoption accelerating | Short term (≤2 years) |
| Growth in Temperature-Sensitive Biologics & ATMP Pipelines | +1.4% | Global; strongest in North America and EU | Long term (≥4 years) |
| AI-Driven Demand Forecasting Reducing Overage & Waste | +0.9% | Global; early adopters in North America and Western Europe | Medium term (2-4 years) |
| Tariff-Driven Near-Shoring of Packaging and Depot Networks | +0.7% | North America and EU; spillover to Mexico and Eastern Europe | Medium term (2-4 years) |
| Sustainability & ESG Mandates Driving Reusable, Low-Carbon Packaging | +0.6% | EU leading; North America and APAC following | Long term (≥4 years) |
| Source: Mordor Intelligence | |||
Increasing Volume of Phase III Multicountry Trials
Final FDA guidance on electronic common technical document (eCTD) submissions, issued in January 2025, has cut duplicate paperwork and shortened review cycles by roughly 15%.[1]U.S. Food and Drug Administration Staff, “Guidance for Industry: Electronic Common Technical Document (eCTD) Specification,” U.S. Food and Drug Administration, fda.gov Sponsors now consolidate packaging and labeling in regional hubs to manage divergent language and artwork needs while still keeping end-to-end inventory visibility through cloud-based randomization and trial supply management platforms. Oncology and rare-disease programs frequently span 20-plus countries, pushing demand for logistics partners skilled at cross-border comparator sourcing. The EMA’s Clinical Trials Information System, operational since early 2025, lets a single application cover all 27 EU member states, further amplifying the need for scale and harmonized quality processes.[2]European Medicines Agency Staff, “Clinical Trials Information System (CTIS) Overview,” European Medicines Agency, ema.europa.eu These shifts enlarge shipment volumes, increase depot touchpoints, and elevate revenue opportunities across the clinical trial supply market.
Expansion of Decentralized & Direct-To-Patient Logistics Models
May 2024 FDA guidance formally endorsed home delivery of investigational products under rigorous risk controls, accelerating deployment of direct-to-patient models.[3]U.S. Food and Drug Administration Staff, “Decentralized Clinical Trials for Drugs, Biological Products, and Devices,” U.S. Food and Drug Administration, fda.gov Sponsors report 30% faster enrollment and 25% lower screen-failure rates when travel burdens drop, leading to earlier submissions and faster commercialization. Couriers now offer ambient, refrigerated, and frozen lanes with GPS tracking and electronic proof of delivery, while blockchain logs ensure immutable audit trails compliant with 21 CFR Part 11 and EU Annex 11. Adoption has been strongest in chronic cardiovascular, respiratory, and central-nervous-system trials whose treatments lend themselves to home administration. As a result, last-mile expertise is becoming a premium service line within the clinical trial supply market.
Growth in Temperature-Sensitive Biologics & ATMP Pipelines
The EMA cleared eight new cell and gene therapies in 2025, each requiring cryogenic storage between −80 °C and −196 °C and real-time batch tracing from leukapheresis to infusion. Liquid-nitrogen dry shippers that meet ISO 21973 standards are replacing compressor-based units, eliminating power dependence during long-haul moves. Developers are also siting fill-finish lines closer to major hospitals to cut vein-to-vein times; 60% of cell-therapy firms plan regional plants within 500 km of sites by 2028. These requirements spur investment in small-batch packaging gear, modular cleanrooms, and high-integrity monitoring systems, widening the addressable revenue pool for providers that can master ultra-cold chain orchestration.
AI-Driven Demand Forecasting Reducing Overage & Waste
Machine-learning models that continuously ingest enrollment curves, site activation data, and dropout trends trimmed excess inventory 22% across 45 Phase III oncology studies in a 2025 analysis. Automated algorithms trigger just-in-time manufacturing and dynamic depot replenishment, lowering write-offs and freeing working capital. Regulators encourage such analytics; FDA adaptive-design guidance highlights predictive tools as a route to resource efficiency and lower environmental impact. Providers embedding these platforms gain a competitive edge, translating technology adoption directly into market-share gains within the clinical trial supply market.
Restraints Impact Analysis*
| Restraint | (~) % Impact on CAGR Forecast | Geographic Relevance | Impact Timeline |
|---|---|---|---|
| Rising Cross-Border Regulatory Divergence Inflating Compliance Costs | −0.8% | Global; acute in APAC and Middle East & Africa | Medium term (2-4 years) |
| Persistent Temperature-Excursion Losses in Emerging Markets | −0.6% | APAC (ex-Japan), Middle East & Africa, South America | Short term (≤2 years) |
| Skilled-Labor Shortages in GMP Packaging & QA Functions | −0.5% | North America and Western Europe | Medium term (2-4 years) |
| Cyber-Security Risks to IRT / RTSM Platforms | −0.4% | Global; highest exposure in North America and EU | Short term (≤2 years) |
| Source: Mordor Intelligence | |||
Rising Cross-Border Regulatory Divergence Inflating Compliance Costs
China’s NMPA began pre-approval audits of overseas packaging plants in June 2024, adding 8-12 weeks to study start-up timelines. Brazil’s ANVISA followed in March 2025 with rules demanding local-formulation comparators, forcing sponsors to run duplicate supply chains. A 2025 multi-sponsor survey found regulatory compliance costs for a 15-country Phase III trial had climbed 19% since 2022, eroding margins and stretching project calendars. Maintaining multiple labeling versions and quality-control tests drains resources across the clinical trial supply market.
Persistent Temperature-Excursion Losses in Emerging Markets
Power outages, customs delays, and last-mile gaps continue to trigger product spoilage. A 2024 PLOS Medicine study covering 1,200 shipments into sub-Saharan Africa and Southeast Asia found 11% breached protocol temperature limits. Sponsors now pre-position backup stock and add real-time data loggers, lifting per-patient supply costs 15-20%. India’s CDSCO draft guidance, released in 2025, mandates uninterruptible power supplies for site pharmacies, but implementation lags in rural regions.
*Our forecasts treat driver/restraint impacts as directional, not additive. The impact forecasts reflect baseline growth, mix effects, and variable interactions.
Segment Analysis
By Service: Manufacturing Momentum as Sponsors Outsource Fill-Finish
Manufacturing, while smaller in absolute value than logistics, is projected to outpace the overall clinical trial supply market with a 9.32% CAGR through 2031, reflecting deeper reliance on contract development and manufacturing organizations for fill-finish, lyophilization, and comparator procurement. In 2025 logistics and distribution retained 29.65% of revenue, underscoring the sector’s foundational role in moving investigational medicinal products between global nodes. Packaging, labeling, and blinding remain indispensable, particularly for double-blind cardiovascular and CNS studies, and automation is reducing release-cycle times. Storage and retention track overall growth as regulators stretch stability obligations. Supply-chain forecasting services are carving a new niche by cutting overage; a 2025 European case study logged a 22% inventory reduction, spotlighting AI as a differentiator.
The comparator sourcing is poised for premium pricing because regulators now insist that reference batches match local formulations, especially in Latin America. The rise of cell and gene therapies is accelerating demand for cryogenic fill-finish and just-in-time packaging close to infusion centers. Providers earning ISO 13485 alongside GMP enjoy an edge when supporting drug-device combination trials, extending their influence within the clinical trial supply market size envelope.


By Phase: Adaptive Phase II Designs Accelerate Growth
Phase III dominated 41.24% of 2025 value due to large patient cohorts and long study durations, yet Phase II is forecast to post a 10.72% CAGR to 2031, the highest among phases, as adaptive enrichment strategies compress development timelines. The FDA’s Project Optimus mandates explorations of multiple dose levels in oncology Phase II trials, multiplying SKU counts and requiring flexible depots. Bioavailability and bioequivalence remain niche but stable, serving generic entrants. Phase I’s modest volumes stem from tight cohort sizes and on-site manufacturing. Phase IV studies, tied to post-marketing safety, are expanding gradually, ensuring sustained if slower demand.
Adaptive designs often demand mid-study drug transfer between arms, a capability best served by providers with real-time visibility into site inventory. As a result, logistics partners offering granular tracking and rapid resupply are winning new Phase II contracts and broadening their clinical trial supply market share.
By Therapeutic Area: Oncology Leads Double-Digit Expansion
Cardiovascular trials held the largest 34.82% slice of 2025 clinical trial supply market size, propelled by global Phase III programs testing GLP-1 receptor agonists and SGLT2 inhibitors. Oncology, however, is the fastest-growing at a 12.64% CAGR, driven by CAR-T, antibody-drug conjugates, and bispecific antibodies that all need ultra-cold chain support. Respiratory studies benefit from inhaled biologics that demand moisture-protected packaging, while CNS and mental-health trials face controlled-substance security hurdles.
Rare-disease trials, though small in patient count, incur outsized logistics spend because patients are geographically dispersed and often treated via compassionate-use pathways, raising per-patient costs 3-4 times above cardiovascular norm. EMA PRIME and FDA orphan-drug incentives promise continued pipeline flow, creating steady, high-margin micro-contracts for nimble providers.
By End User: Biotech Firms Outpace Pharma Incumbents
Pharmaceutical majors contributed 44.14% of 2025 revenue, reflecting their broad late-stage portfolios, but biologics and biotech companies are projected to grow at 10.41% CAGR through 2031, fueled by mRNA, gene-therapy, and cell-therapy programs requiring specialized logistics. Contract research organizations and contract development and manufacturing organizations are integrating packaging and direct-to-patient services, offering sponsors one-stop solutions. Medical-device firms, while a smaller slice, increasingly run combination-product trials that necessitate dual GMP and ISO 13485 compliance.
Venture funding has armed emerging biotech with capital yet not infrastructure; consequently, they outsource everything from depot management to temperature-controlled last-mile delivery. Providers able to bundle IRT, patient-engagement apps, and DTP logistics under a single agreement are capturing a rising share of biotech spend, reinforcing the growth trajectory of the clinical trial supply market.
Geography Analysis
North America generated 35.77% of 2025 revenue, anchored by dense site networks, mature depots, and pioneering FDA decentralized-trial guidance that accelerates direct-to-patient pilots in oncology and rare diseases. Canada and Mexico benefit from near-shoring; 40% of U.S. sponsors shifted some packaging to Mexico by 2025 to offset tariff risk. Labor shortages in GMP packaging and quality assurance inflate costs and lengthen timelines, particularly in Mid-Atlantic and Midwest hubs, prompting automation investments.
Asia-Pacific is projected to post a 9.44% CAGR to 2031, the fastest regional climb. China’s conditional-approval pathway and India’s expansion of GMP-certified facilities pull late-stage studies eastward. Japan aligned eCTD rules with ICH M8 in 2025, allowing seamless global dossiers. South Korea and Australia capture cardiovascular and metabolic trials via co-funding incentives. Nevertheless, cold-chain gaps in Southeast Asia keep excursion rates high; 11% of shipments breached temperature limits in a 2024 study.
Europe leverages the EMA’s centralized application system to streamline multicountry studies and remains a powerhouse for large cardiovascular and respiratory trials. Spain and Italy are winning share because of lower per-patient costs, while Germany, France, and the U.K. retain leadership in complex oncology protocols. The Middle East is building temperature-controlled hubs in Dubai and Riyadh, positioning the Gulf as a springboard into North Africa. South America’s contribution is smaller, yet Brazil and Argentina offer genetically diverse populations and cost advantages, making them attractive for large Phase III cardiovascular programs despite comparator-sourcing hurdles under ANVISA’s 2025 rules.

Competitive Landscape
Large contract development and manufacturing organizations are buying specialist logistics firms to offer OEM-to-patient services under master agreements; a 2024 deal added cryogenic fill-finish to a global CRO’s portfolio. Technology is redefining differentiation: AI forecasting, blockchain chain-of-custody platforms, and ISO 27001-certified IRT are now standard bid requirements. One U.S. startup launched a marketplace in 2025 connecting sponsors directly with couriers and packagers, cutting costs by 18% and illustrating how software can disintermediate legacy networks.
Sustainability is a new battleground. EU Scope 3 reporting pushes sponsors to quantify emissions, directing contracts toward providers with reusable shippers and carbon-offset programs. Meanwhile, ISO 21973-certified reusable containers are becoming table stakes, with early adopters able to show 40-50% emission cuts per lane. The wave of oncology and rare-disease trials demanding cryogenic handling is propelling investment in liquid-nitrogen shippers, sensors, and emergency-response protocols.
Cyber-security now ranks alongside quality and cost in RFP scoring after the 2025 ransomware incident. Providers are hardening defenses with real-time intrusion detection and dedicated security operation centers, adding overhead yet also creating a premium tier of secure service offerings. Across the clinical trial supply market, competition thus pivots on integrated, tech-enabled, and sustainable capabilities rather than pure geographic reach.
Clinical Trial Supply Industry Leaders
Thermo Fisher Scientific
Catalent
Almac Group
Marken (UPS Healthcare)
PCI Pharma Services
- *Disclaimer: Major Players sorted in no particular order

Recent Industry Developments
- February 2026: Valinor Discovery and Renew Biotechnologies launched a collaboration to assemble the largest clinical multi-omics dataset for neurological disorders, supporting next-generation therapeutic prediction.
- January 2026: ImmunityBio partnered with Biopharma and Cigalah to commercialize ANKTIVA® in Saudi Arabia ahead of a phased MENA rollout.
- January 2026: Janux Therapeutics signed an exclusive license with Bristol Myers Squibb to co-develop a novel tumor-activated therapeutic targeting a validated solid-tumor antigen.


Research Methodology Framework and Report Scope
Market Definitions and Key Coverage
Mordor Intelligence defines the clinical trial supply market as the value of services that manufacture investigational product, package and label study medication, store and distribute materials (including validated cold-chain), and manage comparator or ancillary sourcing for Phase I through Phase IV trials worldwide.
Scope exclusion: routine hospital logistics for already-approved commercial drugs are not counted.
Segmentation Overview
- By Service
- Logistics & Distribution
- Storage & Retention
- Packaging, Labelling & Blinding
- Manufacturing
- Comparator Sourcing
- Supply-Chain Management / Forecasting
- By Phase
- Bioavailability / Bioequivalence
- Phase I
- Phase II
- Phase III
- Phase IV / Post-Marketing
- By Therapeutic Area
- Cardiovascular Diseases
- Oncology
- Respiratory Diseases
- CNS & Mental Disorders
- Infectious Diseases
- Rare & Orphan Disorders
- By End User
- Pharmaceutical Companies
- Biologics / Biotech Companies
- Contract Research Organisations (CROs & CDMOs)
- Medical-Device Companies
- By Geography
- North America
- United States
- Canada
- Mexico
- Europe
- Germany
- France
- United Kingdom
- Italy
- Spain
- Rest of Europe
- Asia-Pacific
- China
- Japan
- India
- South Korea
- Australia
- Rest of Asia-Pacific
- Middle East & Africa
- GCC
- South Africa
- Rest of Middle East & Africa
- South America
- Brazil
- Argentina
- Rest of South America
- North America
Detailed Research Methodology and Data Validation
Primary Research
Mordor analysts interviewed supply-chain directors at contract packagers, clinical research organizations, and carrier depots across North America, Europe, and Asia Pacific. Dialogues validated typical kit quantities, wastage norms, and price uplift for biologics, filling several data gaps left by public sources.
Desk Research
We mapped the universe of active studies through public registries such as ClinicalTrials.gov, the EU Clinical Trials Register, WHO ICTRP, and Health Canada's database, and then linked shipment volumes using customs statistics from UN Comtrade and the Pharmaceutical Logistics Network. Trade journals and company filings added cost benchmarks, while D&B Hoovers and Dow Jones Factiva supplied financial clues on leading vendors. These illustrate, not exhaust, the secondary sources consulted.
The registries reveal how many trials start or close each year, whereas port data clarifies temperature-controlled traffic patterns. Together, they give our desk team firm guardrails before moving to fieldwork.
Market-Sizing & Forecasting
A top-down model begins with yearly global trial starts, splits them by phase and molecule class, and multiplies by mean supply spend per site; sampled supplier roll-ups and channel checks anchor the bottom-up sense check. Key inputs include average sites per trial, share of biologic protocols that need cold chain, median shipment weight per patient, inflation-adjusted packaging cost, and regulatory inspection frequency, all of which move the baseline. A multivariate regression, informed by expert consensus, projects these drivers through 2030. Where bottom-up tallies diverge, we weight the more verifiable series and iterate until variance stays within five percent.
Data Validation & Update Cycle
Outputs run through anomaly flags and peer review, after which senior analysts sign off. Reports refresh every twelve months, with interim revisions when material events, regulatory, macro, or disaster, shift supply volumes.
Why Mordor's Clinical Trial Supply Baseline Commands Dependability
Published estimates often diverge because firms use different service baskets, pricing ladders, and refresh cadences.
Key gap drivers here include inclusion of broader commercial logistics by some publishers, use of pre-COVID cost multipliers, and untested volume assumptions for decentralised trials, whereas Mordor limits scope to investigational flows and re-grounds unit costs each update.
Benchmark comparison
| Market Size | Anonymized source | Primary gap driver |
|---|---|---|
| USD 2.92 B | Mordor Intelligence | - |
| USD 5.34 B | Global Consultancy A | Bundles ancillary patient kits and medical-device consumables, applies single inflation factor across phases |
| USD 4.29 B | Trade Journal B | Rolls forward pandemic spending spike, lacks primary interviews to recalibrate comparator sourcing share |
These contrasts show that our disciplined scope setting, live primary validations, and annual recalibration give decision-makers a balanced, transparent baseline they can reproduce and defend.


Key Questions Answered in the Report
How fast is the clinical trial supply market growing?
It is projected to expand at a 7.92% CAGR from 2026 to 2031, rising from USD 4.60 billion to USD 6.73 billion.
Which service line is growing the quickest?
Manufacturing services, particularly outsourced fill-finish and comparator sourcing, are forecast to grow at 9.32% CAGR through 2031.
Why is oncology driving demand for clinical supplies?
CAR-T, antibody-drug conjugate, and bispecific programs require ultra-cold chain handling and patient-specific manufacturing, pushing logistics complexity and spend.
What makes Asia-Pacific appealing for sponsors?
Conditional approvals in China, expanding GMP capacity in India, and harmonized eCTD rules in Japan cut timelines and cost, supporting a 9.44% regional CAGR.
How are providers addressing sustainability mandates?
Leading vendors deploy ISO 21973-certified reusable shippers and offer carbon-offset programs, helping sponsors meet EU Scope 3 reporting requirements.
Page last updated on:


