
Cleanroom Technology Market Size and Share
Market Overview
| Study Period | 2020 - 2031 |
|---|---|
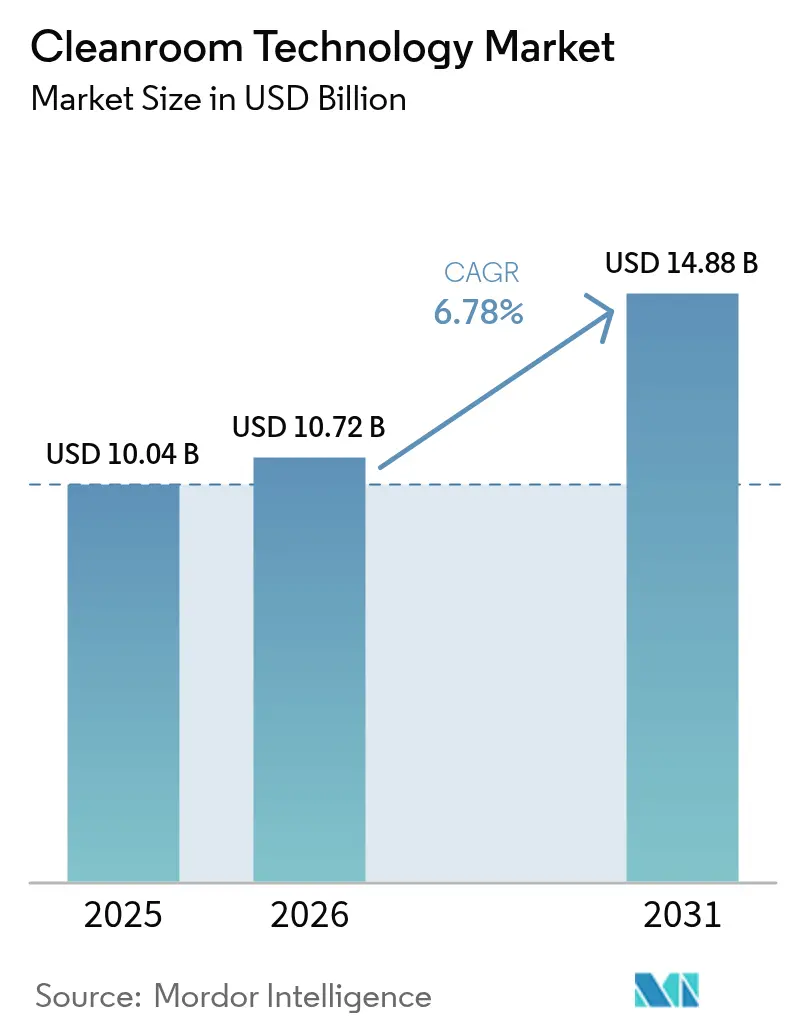
| Market Size (2026) | USD 10.72 Billion |
| Market Size (2031) | USD 14.88 Billion |
| Growth Rate (2026 - 2031) | 6.78 % |
| Fastest Growing Market | Asia Pacific |
| Largest Market | North America |
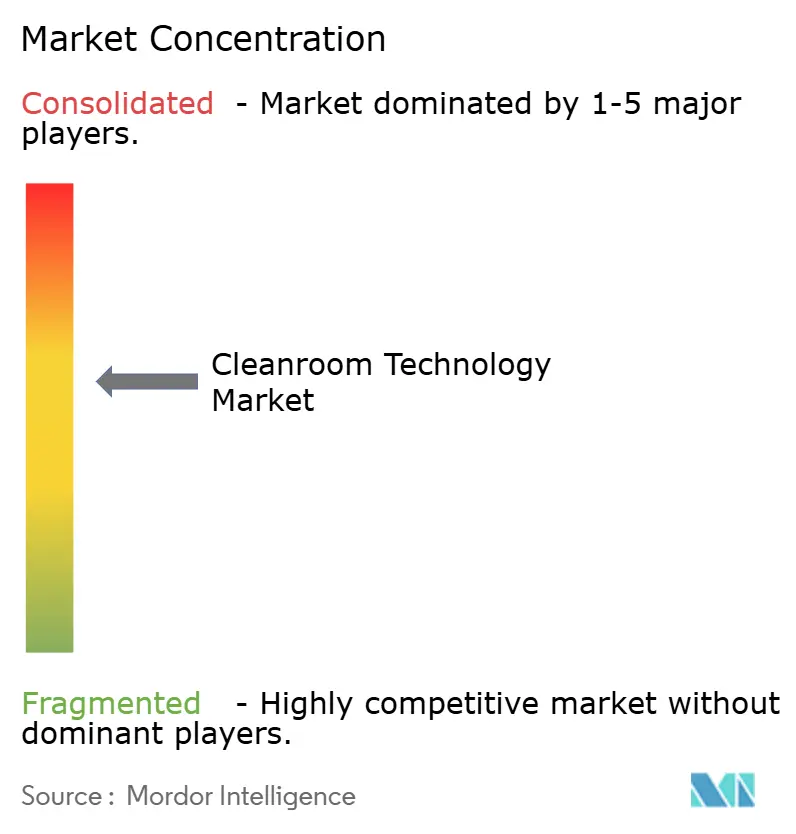
| Market Concentration | Medium |
Major Players
*Disclaimer: Major Players sorted in no particular order Image © Mordor Intelligence. Reuse requires attribution under CC BY 4.0. |
|
Cleanroom Technology Market Analysis by Mordor Intelligence
The cleanroom technology market size was valued at USD 10.04 billion in 2025 and estimated to grow from USD 10.72 billion in 2026 to reach USD 14.88 billion by 2031, at a CAGR of 6.78% during the forecast period (2026-2031). Sustained semiconductor capacity expansion, accelerated cell and gene therapy build-outs, and rising battery gigafactory investments underpin this steady advance. United States CHIPS Act grants, European Union medical-device regulations, and Asia-Pacific silicon-carbide wafer programs collectively widen the customer base and elevate specification levels. At the same time, filter-media redesign triggered by PFAS restrictions and a shortage of ISO-certified installers temper near-term growth in some regions. Suppliers that deliver modular, energy-efficient, and rapidly deployable systems continue to out-perform the overall cleanroom technology market. [1]
Key Report Takeaways
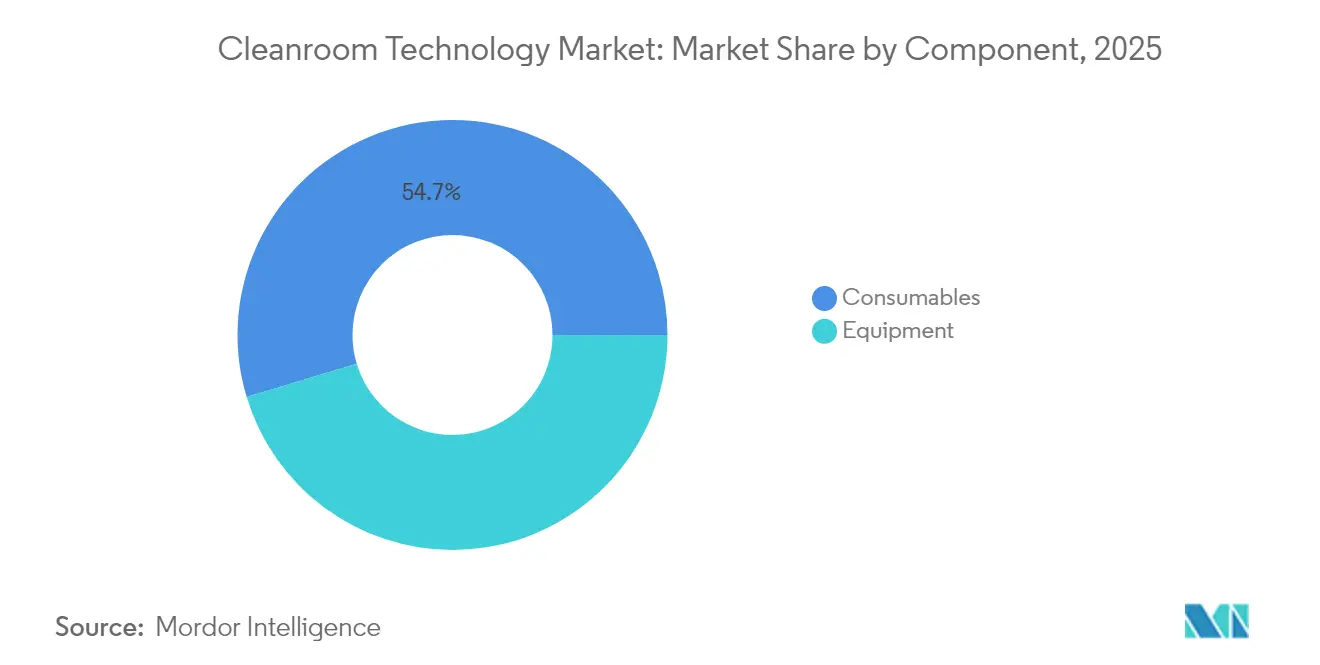
- By component, consumables led with 54.66% of the cleanroom technology market share in 2025, while equipment is projected to expand at a 7.18% CAGR to 2031.
- By construction type, modular hardwall solutions accounted for 56.20% of the cleanroom technology market size in 2025 and mobile or portable systems are advancing at an 7.74% CAGR through 2031.
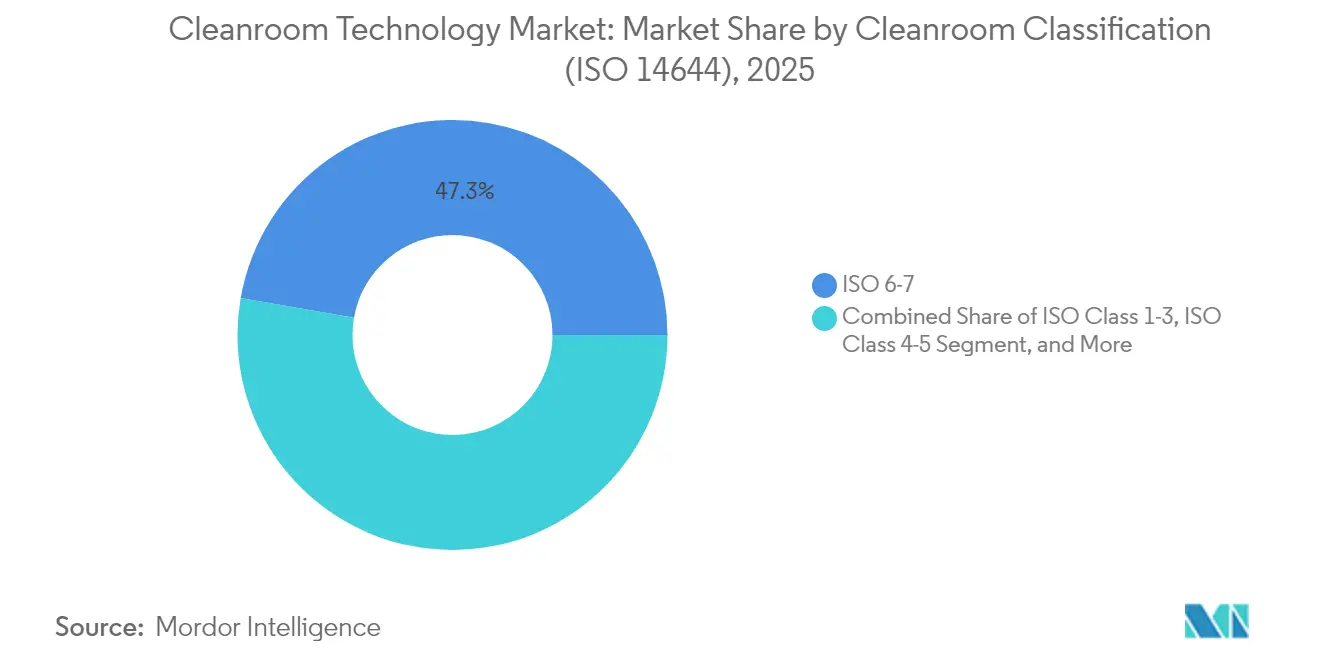
- By cleanroom classification, ISO 6-7 suites held 47.25% of the cleanroom technology market size in 2025; ISO 1-3 environments post the fastest 8.05% CAGR over 2026-2031.
- By end-user, pharmaceutical manufacturing represented 41.85% of the cleanroom technology market share in 2025, whereas semiconductor fabrication records the highest 8.28% CAGR during the forecast.
- By geography, North America captured 33.62% of the cleanroom technology market share in 2025; Asia-Pacific registers the strongest 7.32% CAGR to 2031.
Note: Market size and forecast figures in this report are generated using Mordor Intelligence’s proprietary estimation framework, updated with the latest available data and insights as of 2026.
Market Trends and Insights
Drivers Impact Analysis of Cleanroom Technology Market*
| Driver | (~) % Impact on CAGR Forecast | Geographic Relevance | Impact Timeline |
|---|---|---|---|
| EU cell and gene-therapy capacity expansion | +1.20% | Europe, spillover to North America | Medium term (2-4 years) |
| CHIPS Act semiconductor fabs adding >3 million sq ft ISO 4 space | +1.80% | North America, supply chain effects global | Medium term (2-4 years) |
| Expansion of SiC wafer and advanced-packaging lines | +1.50% | Asia-Pacific core, global auto supply chain | Long term (≥ 4 years) |
| EU-MDR retrofit requirement for device SMEs | +0.90% | Europe, export markets | Short term (≤ 2 years) |
| Post-COVID negative-pressure hospital wards | +0.70% | Global, developed health systems | Medium term (2-4 years) |
| Ultra-dry Li-ion gigafactories (<1% RH) | +1.00% | China, Europe, North America | Long term (≥ 4 years) |
| Source: Mordor Intelligence | |||
Cell and Gene Therapy Manufacturing Drives Modular Cleanroom Innovation
Multiple European facilities reached operational status in 2025, each requiring ISO 5-7 modular suites for living-medicine production. Novartis brought its fully automated viral-vector site in Slovenia online, part of a EUR 3.5 billion (USD 4.09 billion) national program, while Roche opened a EUR 90 million (USD 105.18 million) gene-therapy development center in Germany. Both projects emphasize flexible, pre-engineered layouts that shorten validation cycles and ease future scale-ups. National funding schemes accelerate order flow across the cleanroom technology market.
CHIPS Act-Funded Semiconductor Expansion Accelerates Infrastructure Demand
The USD 53 billion CHIPS and Science Act ignited an unprecedented wave of United States fab construction. Eighteen new plants broke ground in 2025, each demanding ISO 4 or tighter rooms with sub-0.1 µm control. TSMC’s Arizona complex alone plans six fabs, illustrating how megaproject footprints translate directly into thousands of square metres of controlled environment. Domestic tooling suppliers and filter makers report multi-year backlogs, lifting the cleanroom technology market.
Silicon Carbide Wafer Processing Demands Ultra-Precision Environments
China, Taiwan, and South Korea accelerate silicon-carbide capacity to serve electric-vehicle inverters and fast-charging modules. Sub-micron cleanliness paired with strict temperature stability prevents defect formation during high-temperature crystal growth. The niche pushes demand for ISO 3-4 bays, precision HVAC, and abrasion-resistant floor systems, giving premium-grade providers an opportunity to secure long-term contracts. [2]
EU-MDR Compliance Creates Retrofit Demand Surge
Medical-device SMEs must upgrade to ISO 7 suites by 2027 under the European Union’s regulation. Retrofit projects often involve legacy buildings where ceiling height, airflow pathways, and waste-handling require redesign. Vendors able to deliver turnkey modules with built-in monitoring meet compressed timelines and quality-system evidence requirements, thereby capturing share across the cleanroom technology market.
Restraints Impact Analysis of Cleanroom Technology Market*
| Restraint | ( ~ ) % Impact on CAGR Forecast | Geographic Relevance | Impact Timeline |
|---|---|---|---|
| Cost inflation for HEPA/ULPA media from PFAS phase-out | -0.80% | Global, immediate in US and EU | Short term (≤ 2 years) |
| North American shortage of ISO-certified installers | -1.20% | North America, global spillover | Medium term (2-4 years) |
| Energy-intensive HVAC under EU-ETS Phase IV carbon pricing | -0.60% | Europe, global competitive impact | Long term (≥ 4 years) |
| Semiconductor down-cycles deferring ISO 1-3 projects | -0.90% | Global, cyclical chip markets | Short term (≤ 2 years) |
| Source: Mordor Intelligence | |||
PFAS Regulations Drive Filter Media Cost Inflation
The U.S. EPA set 4 ppt drinking-water limits for PFOA and PFOS, prompting a phased withdrawal of fluorinated binder and sealant chemistries common in HEPA and ULPA media. Manufacturers now validate alternative polymers while absorbing re-tooling expenses that flow into component pricing. For buyers, quarterly filter quotes increased by double digits in early 2025, tightening operating budgets across the cleanroom technology market. [3]
Skilled Labor Shortage Delays Critical Infrastructure Projects
Semiconductor megaprojects require thousands of tradespeople versed in contamination-control protocols. A limited pool of ISO-certified technicians pushes project schedules beyond six months and raises overtime premiums. Builders respond by expanding apprenticeship programs and sourcing crews from Europe and Asia, yet constraints persist and slow cleanroom technology market revenue recognition.
*Our forecasts treat driver/restraint impacts as directional, not additive. The impact forecasts reflect baseline growth, mix effects, and variable interactions.
Cleanroom Technology Market Segment Analysis
By Component:
Equipment Advances Outpace Recurring ConsumablesThe equipment segment is projected to grow at 7.18% CAGR through 2031, outstripping the consumables category that nonetheless held a 54.66% slice of the cleanroom technology market in 2025. Energy-efficient fan-filter units and digitally monitored HVAC systems lead capital spending as fabs and therapy sites target lower operating costs and streamlined compliance reporting. Modular wall panels with factory-integrated cabling reduce onsite contamination risks while trimming installation time.
Desiccator cabinets engineered for battery-cell drying below 1% relative humidity, along with AI-enabled vacuum pumps that detect molecular contamination in real time, demonstrate how value migrates to intelligent hardware. Consumables still post steady volume gains as new square footage comes online, yet margin pressure from PFAS-related material changes shifts profit pools toward high-specification equipment providers.

By Construction Type:
Modular Solutions Extend Lead Through FlexibilityModular hardwall rooms controlled 56.20% of the cleanroom technology market in 2025, helped by proven structural integrity and simplified regulatory validation. Mobile or portable designs record an 7.74% CAGR as semiconductor, space, and contract-manufacturing users seek temporary capacity. These pre-engineered pods typically cut project schedules by 60% compared with stick-built spaces, an advantage when grant milestones or product launch dates loom.
Traditional stick-built suites remain relevant where complex utilities integration is essential. Rigid-wall rooms serve aerospace and defense programs requiring vibration dampening and electromagnetic shielding. Firms increasingly weigh lifecycle carbon footprints, and reusable modular frames align with corporate sustainability targets, reinforcing the shift in share within the cleanroom technology market.
By Cleanroom Classification:
Ultra-Clean ISO 1-3 Rooms Capture Premium GrowthISO 6-7 facilities accounted for 47.25% of the cleanroom technology market size in 2025 due to broad pharmaceutical and device production needs. Advanced semiconductor nodes, quantum research, and nanomaterial development push ISO 1-3 demand, expanding at an 8.05% CAGR through 2031. Creating such spaces costs up to 20 times more per square foot than ISO 8-9 rooms because of air-change rates exceeding 600 per hour and triple-stage filtration arrays.
Operators mitigate energy intensity through variable-speed drives, low-pressure drop diffusers, and predictive HVAC maintenance. Tiered classification within the same facility balances capex: ISO 1-3 bays handle lithography or crystal growth, while support areas operate at ISO 6-7. This zoning approach optimizes total cleanroom technology market spend yet still elevates average specification levels industry-wide.
By End-User:
Semiconductor Fabrication Leads Growth While Pharma Holds ScalePharmaceutical manufacturing possessed 41.85% of 2025 revenue, anchored by sterile-product guidelines and biologics expansion. Semiconductor fabs, stimulated by domestic incentive packages and AI chip demand, deliver an 8.28% CAGR, making them the fastest-growing user segment. Cell and gene therapy suites represent a hybrid, sharing pharmaceutical sterility needs with flexible modular layouts usually seen in electronics.
Hospitals adopt ISO-classified rooms for compounding and isolation spaces, a post-pandemic shift that raises healthcare’s share incrementally. Battery-cell makers specify ultra-dry modules integrated with dehumidification systems achieving dew-points below -40 °C, thereby adding a fresh revenue stream to the cleanroom technology market.
Geography Analysis
North America Cleanroom Technology Market
North America held 33.62% of 2025 revenue on the back of CHIPS Act megaprojects and an extensive biologics pipeline. The region continues to commission new ISO 4 and tighter suites through 2028, though installer shortages slow some timelines. Canada and Mexico contribute via automotive electronics and sterile injectables plants but remain secondary in scale.
Europe Cleanroom Technology Market
Europe follows, propelled by EU-MDR retrofit activity and a surge in gene-therapy capacity across Germany, Slovenia, and the United Kingdom. Carbon-pricing under EU-ETS Phase IV incentivizes energy recovery systems and low-velocity airflow designs, pushing vendors to refine HVAC efficiency. Eastern European countries market cost-competitive labor for modular-room assembly, attracting investment in contract manufacturing.
APAC Cleanroom Technology Market
Asia-Pacific displays the highest 7.32% CAGR, driven by China’s USD 100 billion 300 mm fab pipeline, Taiwan’s USD 75 billion advanced-node program, and South Korea’s USD 81 billion capacity expansion. Wide-bandgap semiconductor programs, battery-cell gigafactories, and vaccine manufacturing hubs expand addressable demand. India’s first leading-edge fab in Sanand entered validation in mid-2025, signalling broader regional adoption of high-specification suites. Other emerging markets in Southeast Asia leverage electronics assembly migration to bolster local cleanroom capacity.

Regulatory Landscape
Cleanroom technology suppliers and end users align qualification and operations to the ISO 14644 series, with recent updates widening control expectations beyond particle counts. ISO published ISO 14644-13:2026 (cleaning of surfaces to achieve defined particle and chemical concentration levels) and ISO 14644-15:2026 (assessment of chemical airborne cleanliness suitability of equipment and materials used in controlled environments), both of which increase the documentation burden on OEMs, installers, and facility operators through tighter verification of surface and airborne chemical cleanliness.
Sector-specific rules also affect equipment selection and facility design. In semiconductors, the US EPA updated 40 CFR Part 63 Subpart BBBBB in March 2026 for hazardous air pollutant emission standards in semiconductor manufacturing, reinforcing requirements that interact with exhaust, abatement, and process-tool integration in high-spec fabs. For space and aerospace contamination control, ECSS issued ECSS-Q-ST-70-01C Rev.1 in October 2025, updating cleanliness and contamination-control expectations for space projects and ground systems, which feeds into validation protocols for clean assembly environments and related monitoring systems.
Value Chain Analysis
The cleanroom technology value chain starts with raw and engineered inputs (filter media, sealants, plastics, stainless steel, sensor electronics, and control software), feeding component manufacturing for HEPA/ULPA filters, fan-filter units, HVAC subsystems, modular panels, and monitoring instruments, before distribution to engineering and installation partners. Standards and operating practices influence downstream service demand, and the 2025 publication of ISO 14644-5:2025 (Operations) raises emphasis on disciplined operating and maintenance programs, strengthening the role of validation, certification, and ongoing monitoring providers alongside equipment vendors.
Project delivery is increasingly coordinated through turnkey EPC and specialist cleanroom contractors that integrate utilities and contamination-control infrastructure, then hand over to end users for qualification and ramp. Semiconductor programs amplify this integration need because ISO Class 1-5 environments tie to photolithography, etch, and deposition tool requirements, while common bottlenecks include power availability, ultra-pure water, and long lead times for specialized HVAC and cleanroom equipment. India illustrates the emerging-hub dynamic: Tata Electronics engaged Malaysia-based IAQ Group to design and install a turnkey cleanroom for its 300 mm Dholera fab, and Micron advanced cleanroom validation for Phase 1 of its ATMP facility in Sanand with milestones re-timed toward late 2025, supporting a broader shift toward regionalized sourcing and on-the-ground installation capacity.
Competitive Landscape
Industry consolidation continues as major engineering groups acquire specialist installers and component suppliers. Exyte’s purchase of Kinetics Group widened turnkey service coverage for high-tech facilities, while Thermo Fisher Scientific integrated Solventum’s purification unit to deepen life-science filtration portfolios. Ingersoll Rand’s acquisition of ILC Dover expanded single-use systems alongside containment solutions.
Technology differentiation centers on sustainability. New fan-filter units claim 30% lower energy draw, and AI-driven airflow balancing reduces oversupply while preserving ISO class. Firms such as G-CON and Germfree collaborate on fully automated modular lines that blend robotics, IoT sensors, and real-time quality analytics. Suppliers with robust intellectual-property estates and multi-regional fabrication plants capture a premium when bidding on large semiconductor or therapy projects.
Barriers to entry remain high because clients demand proven compliance histories and comprehensive liability coverage. Established players secure multiyear framework agreements with leading chipmakers and biopharma groups, raising switching costs. Niche opportunities persist in autonomous disinfection robots and ultra-dry battery rooms, yet scale advantages favor incumbents in the broader cleanroom technology market.
Cleanroom Technology Industry Leaders
-
Azbil Corporation
-
DuPont de Nemours Inc.
-
Kimberly-Clark Corporation
-
Camfil AB
-
Taikisha Ltd.
- *Disclaimer: Major Players sorted in no particular order
Cleanroom Technology Market Companies Covered in this Report
- Azbil Corporation
- DuPont de Nemours Inc.
- Kimberly-Clark Corporation
- Camfil AB
- Taikisha Ltd.
- Ardmac Ltd.
- Terra Universal Inc.
- Clean Air Products Inc.
- Labconco Corporation
- Ansell Limited
- Illinois Tool Works Inc. (Texwipe)
- Berkshire Corporation
- ABN Cleanroom Technology NV
- Bouygues Energies and Services
- Skan AG
- Simplex Isolation Systems
- 3M Company
- Connect 2 Cleanrooms Ltd.
- Guardtech Cleanrooms Ltd.
Market Opportunities and Future Outlook
Semiconductor capacity additions and upgrades are creating whitespace for high-spec cleanroom build-outs, retrofit packages, and consumables scale-up, especially where advanced packaging, silicon photonics, and AI-memory production drive denser toolsets and stricter contamination control. In July 2026, Micron broke ground on a new 300,000 sq ft cleanroom at its Hiroshima, Japan facility, and Tower Semiconductor announced a USD 3 billion dual-track expansion in Japan that includes repurposing the Arai facility for 300 mm silicon photonics and building a new fab adjacent to its Uozu operations. These moves translate into demand for modular, rapidly deployable cleanroom structures, precision HVAC, and high-performance filtration aligned with tighter process windows.
Operational and materials compliance is also creating opportunities for suppliers that package hardware with validation-ready procedures and monitoring, as ISO 14644-13:2026 and ISO 14644-15:2026 add guidance on surface cleaning effectiveness and chemical airborne cleanliness suitability of equipment and materials. At the same time, energy-intensive HVAC under carbon-pricing regimes and PFAS-driven redesign of filter media shift procurement toward lower-pressure-drop filtration, smarter airflow control, and traceable material sets, creating room for differentiated OEMs and installers to shorten qualification cycles and simplify evidence generation across regulated pharma, medical devices, and advanced electronics facilities.
Recent Industry Developments in Cleanroom Technology Market
- July 2026: Tower Semiconductor announced a USD 3 billion dual-track expansion in Japan, including repurposing the Arai facility for 300 mm silicon photonics and constructing a new fab adjacent to its Uozu facilities. The program increases demand for high-spec cleanroom build-outs, filtration, and precision HVAC as silicon photonics and 300 mm manufacturing require tighter contamination control and tool-dense layouts.
- April 2026: DuPont launched Liveo Pharma TPE Overmolded Assemblies for pharma and biopharma applications, targeting reduced contamination risk and fewer manual assembly steps in fluid transfer and processing. The launch supports cleanroom operators pursuing more standardized, contamination-resistant consumables and components that simplify handling and validation in upstream and downstream workflows.
- October 2024: DuPont expanded photoresist manufacturing capacity at its Sasakami site in Japan, adding capability for advanced semiconductor materials. Higher local availability of critical lithography chemicals supports regional fab ramps and can accelerate demand for ISO 1-3 and ISO 4-5 cleanroom environments that control molecular and particle contamination around photoresist storage, dispense, and process-tool operations.
Cleanroom Technology Market Report Scope and Research Methodology
Market Definition and Coverage
For this study, the cleanroom technology market covers products used to build, equip, and operate controlled environments where airborne particles, microbes, temperature, humidity, and pressure are managed to defined cleanliness standards.
Scope exclusions: We exclude general building HVAC used for non-controlled areas and non-cleanroom facility services that are not tied to ISO 14644 or GMP grade compliance.
Segments Covered in This Report
-
By Component
-
Equipment
- Cleanroom Air Showers
- HVAC Systems
- Laminar Air-flow Cabinets
- HEPA/ULPA Filters
- Desiccator Cabinets
- Fan-Filter Units
- Modular Cleanroom Structures
-
Consumables
- Apparel
- Gloves
- Wipes
- Disinfectants and Cleaning Chemicals
- Vacuum Systems
- Adhesive Mats
-
Equipment
-
By Construction Type
- Standard Stick-Built Cleanrooms
- Modular Hardwall Cleanrooms
- Modular Softwall Cleanrooms
- Rigid-wall Cleanrooms
- Mobile/Portable Cleanrooms
-
By Cleanroom Classification (ISO 14644)
- ISO Class 1-3
- ISO Class 4-5
- ISO Class 6-7
- ISO Class 8-9
-
By End-User
- Pharmaceutical Manufacturing
- Biotechnology R&D and Production
- Medical Device Manufacturing
- Hospitals and Healthcare Facilities
- Semiconductor Fabrication
- Micro-electronics and Optics
- Food and Beverage Processing
- Aerospace and Defense
- Automotive and Battery Manufacturing
- Other End-users
-
By Geography
-
North America
- United States
- Canada
- Mexico
-
Europe
- Germany
- United Kingdom
- France
- Italy
- Spain
- Netherlands
- Rest of Europe
-
Asia-Pacific
- China
- Japan
- India
- South Korea
- South East Asia
- Taiwan
- Rest of Asia-Pacific
-
South America
- Brazil
- Rest of South America
-
Middle East
- Gulf Cooperation Council Countries
- Turkey
- Rest of Middle East
-
Africa
- South Africa
- Rest of Africa
-
North America
Data Sources, Market Sizing, and Validation
Desk Research
Desk research was used to set the factual base for the model and to avoid making assumptions that do not match what is happening in regulated manufacturing and labs. We referenced public standards and compliance guidance to anchor what qualifies as a cleanroom and what drives technology choices, then used trade and macro indicators to understand demand cycles.
Common inputs came from sources such as ISO 14644 documentation, FDA and EMA GMP guidance, US Census Bureau and Eurostat industrial data, UN Comtrade trade statistics for filtration and related equipment categories, and peer-reviewed journals that discuss contamination control and aseptic practices. We also reviewed company filings, product catalogs, investor presentations, association publications, and reputed press to triangulate pricing logic, adoption signals, and capacity additions. Where needed, we relied on paid subscriptions for company financials and intelligence, patent databases, and shipment-level trade databases. The desk sources listed here are illustrative only, and additional public and paid references were used for cross-checks and clarification.
Primary Interviews and Surveys
Primary work focused on confirming how cleanroom projects and recurring consumables are actually purchased, specified, and replaced across pharma, biotech, medical device, semiconductor, and advanced battery end users. We spoke with a mix of manufacturers, integrators, distributors, and facility-side stakeholders across APAC, EMEA, and the Americas to validate demand indicators, typical upgrade cycles, and the practical split between equipment, consumables, and build-out activity.
Distribution of primary research fieldwork respondents
| Company type | Respondent position | Region |
|---|---|---|
| Top tier: 35% | CXOs: 12% | APAC: 49% |
| Mid tier: 50% | Functional/Unit leaders: 36% | EMEA: 29% |
| Smaller Players: 15% | Managers: 52% | Americas: 22% |
Market-Sizing & Forecasting
Sizing starts with a top-down build where end-user expansion and compliance-driven retrofits are converted into a demand pool for cleanroom equipment and recurring consumables. In practice, capacity additions in pharmaceuticals and biotech manufacturing, semiconductor fab and packaging investments, and new battery gigafactory announcements were translated into expected cleanroom area build-outs and associated technology requirements, then matched to typical replacement rates for filters and consumables.
To keep the totals realistic, we corroborated them with selective bottom-up checks, such as sampling average selling prices for major equipment items, applying volume ranges by cleanroom class, and rolling up a limited set of supplier and channel feedback to adjust for gaps. Key inputs used in the model include cleanroom classification mix (ISO classes and GMP grades), filtration and airflow intensity assumptions, project lead times for modular versus stick-built rooms, consumables run-rate per operating cleanroom area, and regional construction and labor constraints that can shift delivery timing.
Forecasts were built using scenario analysis. The base case follows the most consistent outlook shared in interviews for regulated manufacturing expansions, while alternative cases stress-test delays in capital projects and changes in compliance enforcement. Where bottom-up signals were incomplete for smaller local providers, we handled gaps through calibrated shares based on observed project density and distributor coverage in each region.
Data Validation & Update Cycle
Outputs were checked against independent signals, including public announcements of new controlled manufacturing lines, trade flows for core filtration-related categories, and observed pricing bands from catalogs and buyer feedback. When large variances appeared, we revisited assumptions and triggered follow-up calls to confirm whether the change came from scope, timing, or a real shift in demand.
Before sign-off, the model goes through multi-step analyst review, where calculations are rechecked and regional splits are tested for consistency with known investment hotspots. The report is refreshed annually, and interim updates are made when material events occur, such as major capacity announcements, regulation changes, or supply constraints that can move short-term demand.
Mordor Intelligence's Cleanroom Technology Market Sizing Compared With Other Published Estimates
It is common to see different market sizes for cleanroom technology because teams do not always count the same set of items, and they often use different base years and project timing assumptions. Differences also show up when one estimate leans more on construction-heavy project values, while another stays closer to equipment and recurring consumables.
By tracking replacement cycles for filtration and consumables alongside new build-out triggers, then reconciling those inputs with regional installation capacity, Mordor Intelligence keeps the 2025 total tied to what operating cleanrooms typically consume and what new sites can realistically deliver within the year.
Benchmark comparison
| Source | Market Size | Gaps in Research Methodology |
|---|---|---|
| Mordor Intelligence | USD 10.04 B (2025) | |
| Global Consultancy A | USD 8.12 B (2025) | Uses a narrower 2025 value that appears more conservative on project timing and may undercount parts of the build-out and validation-related equipment attached to new controlled facilities, which reduces the near-term total. |
| Industry Publisher B | USD 8.59 B (2025) | Includes construction and maintenance framing, but the 2025 total can shift based on what is treated as cleanroom-specific services versus general facility work, and on how multi-year projects are recognized into a single year. |
Overall, the spread is explained by scope boundaries and timing, especially around whether build-out activity and recurring consumables are treated with the same replacement and utilization logic. Using transparent drivers like cleanroom class mix, replacement rates, and realistic delivery constraints makes the final number easier to trace and repeat in updates.
Key Questions Answered in the Report
What is the current value of the cleanroom technology market?
The market reached USD 10.72 billion in 2026 and is on track to hit USD 14.88 billion by 2031 at a 6.78% CAGR.
Which segment grows fastest within the cleanroom technology market?
Semiconductor fabrication registers the highest 8.28% CAGR through 2031, spurred by CHIPS Act funding and AI chip demand.
Why are modular cleanrooms gaining popularity?
Modular hardwall and mobile suites cut installation time by up to 60% and align with sustainability goals through reusable structures and lower material waste.
How do PFAS regulations affect cleanroom operations?
Phase-outs of fluorinated materials drive double-digit cost increases for HEPA and ULPA filters, raising consumables budgets in the short term.
Which region leads cleanroom technology market growth?
Asia-Pacific records a 7.32% CAGR to 2031, propelled by large semiconductor and battery-manufacturing investments in China, Taiwan, and South Korea.
What classification level sees the strongest demand uptick?
ISO 1-3 rooms for advanced semiconductor nodes and quantum research show the fastest 8.05% CAGR due to their ultra-low particle thresholds.