Cleanroom Lighting Market Size and Share
Market Overview
| Study Period | 2020 - 2031 |
|---|---|
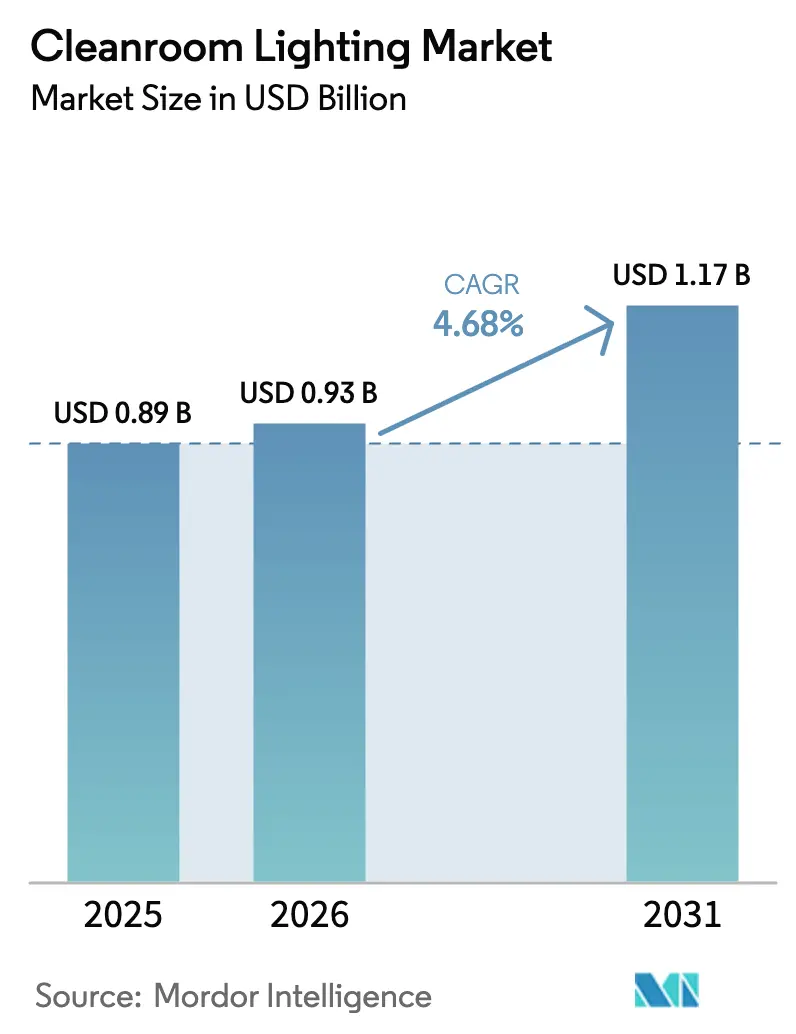
| Market Size (2026) | USD 0.93 Billion |
| Market Size (2031) | USD 1.17 Billion |
| Growth Rate (2026 - 2031) | 4.68% CAGR |
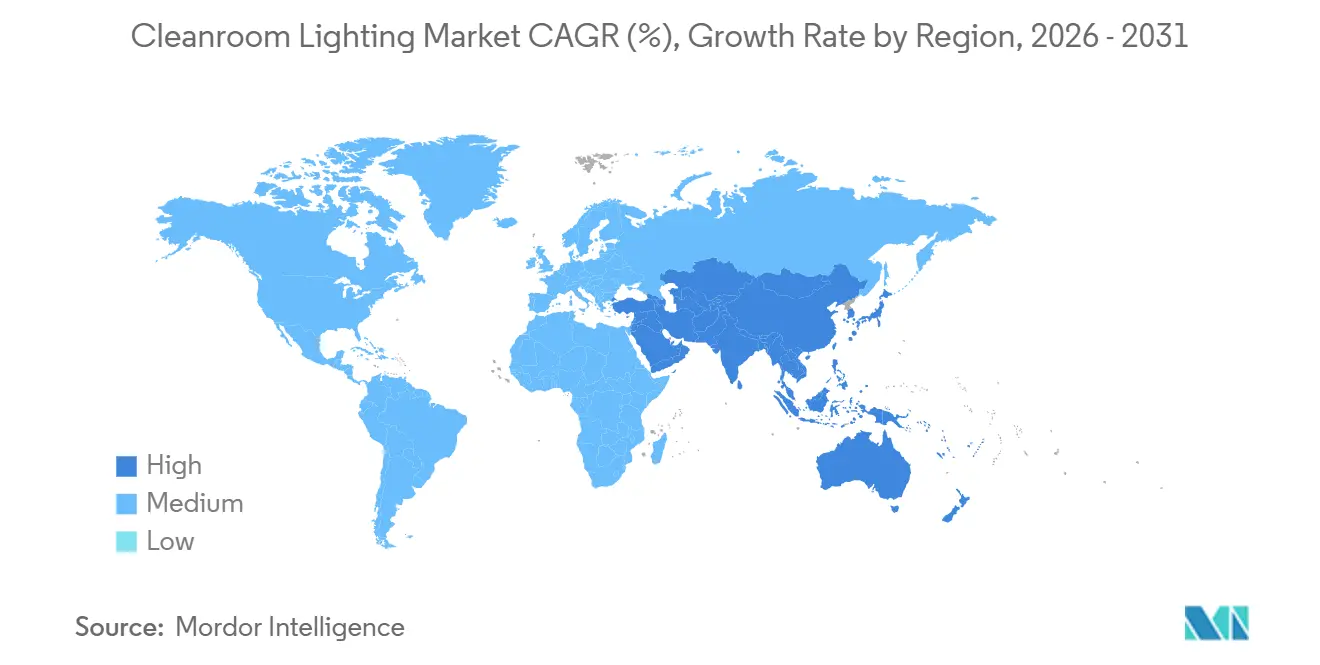
| Fastest Growing Market | Middle East |
| Largest Market | Asia Pacific |
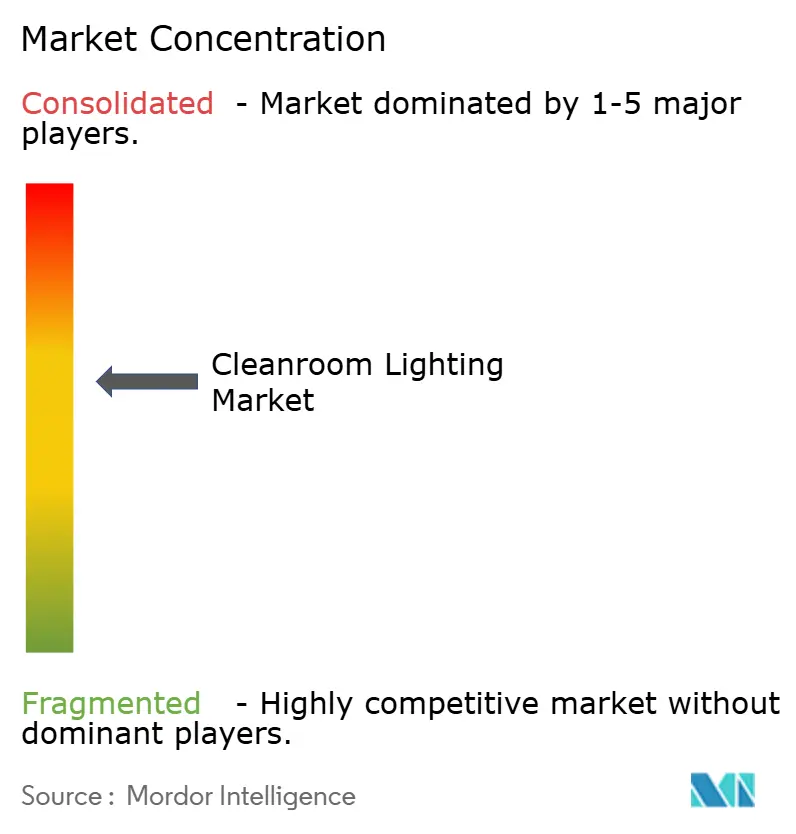
| Market Concentration | Medium |
Major Players *Disclaimer: Major Players sorted in no particular order Image © Mordor Intelligence. Reuse requires attribution under CC BY 4.0. | |
Cleanroom Lighting Market Analysis by Mordor Intelligence
The cleanroom lighting market size is projected to be USD 0.89 billion in 2025, USD 0.93 billion in 2026, and reach USD 1.17 billion by 2031, growing at a CAGR of 4.68% from 2026 to 2031. Semiconductor subsidy programs in East Asia, European Union Annex 1 enforcement, and the United States biologics boom are driving rapid retrofits from fluorescent to sealed LED systems. Suppliers are responding with tunable-white, UV-C, and Li-Fi-ready luminaires that meet ISO 14644‐1 particulate limits while improving operator safety and energy efficiency. High-speed food packaging lines, battery plants, and hospital infection-control upgrades are widening the application base beyond traditional semiconductor and pharma hubs. However, fixture bill-of-materials costs remain exposed to volatile aluminum and polycarbonate prices, and the scarcity of ATEX- or IECEx-certified models continues to lengthen procurement cycles in solvent-handling zones.
Key Report Takeaways
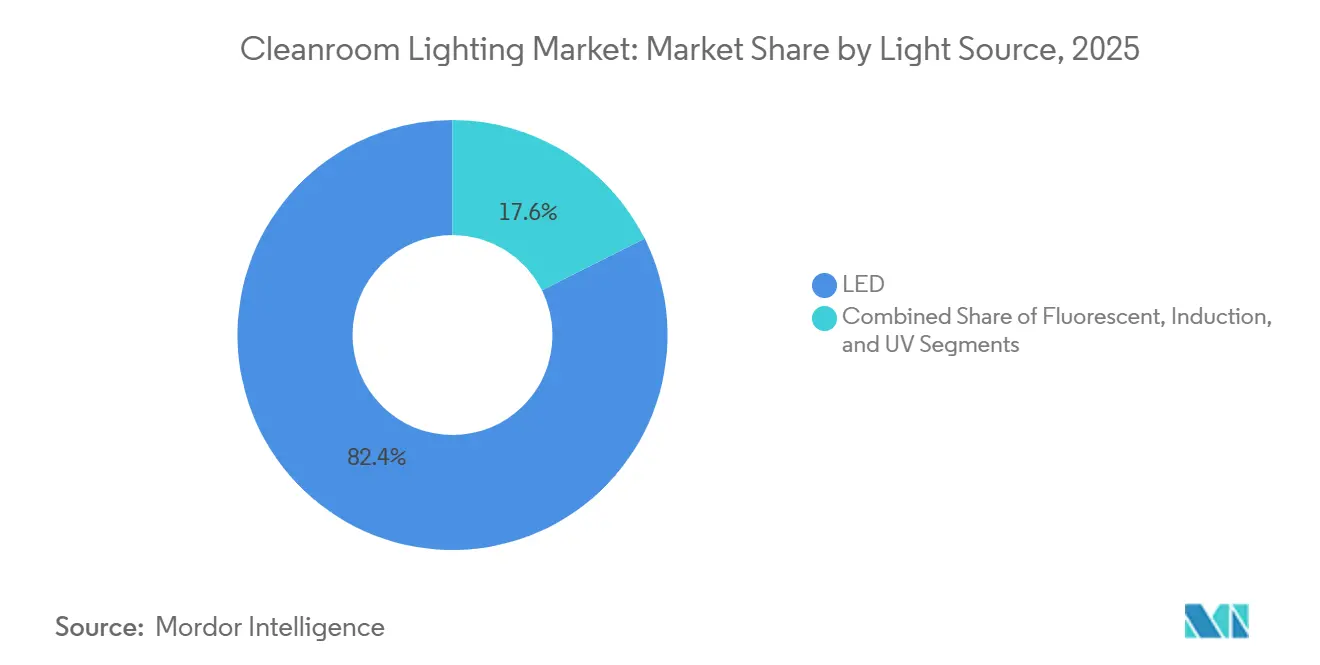
- By light source, LEDs led with 82.40% revenue share in 2025, while ultraviolet variants are forecast to expand at a 4.99% CAGR through 2031.
- By fixture design, panel and troffer units captured 47.80% of shipments in 2025; hazardous-location enclosures are projected to grow at 7.12% CAGR to 2031.
- By mounting type, recessed systems held 54.60% share in 2025, whereas pendant fixtures are set to advance at a 6.34% CAGR over the same period.
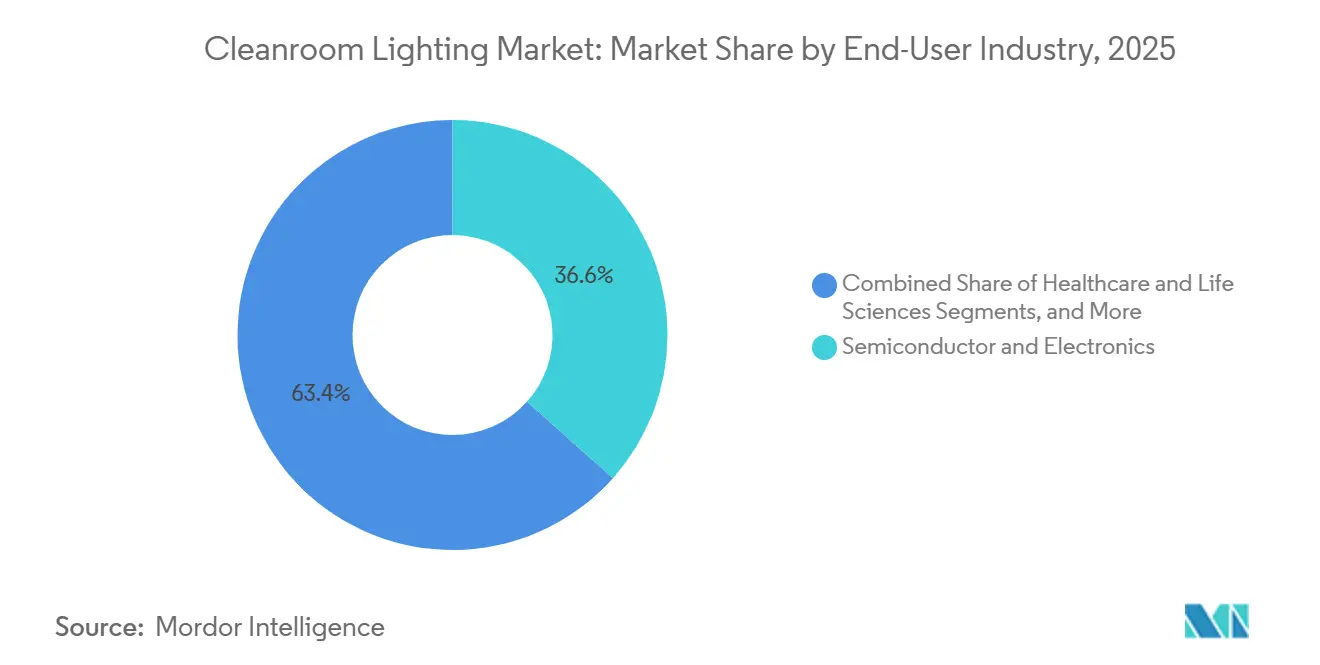
- By end-user, semiconductor and electronics accounted for 36.60% of 2025 revenue, yet food and beverage processing is anticipated to post the fastest 8.40% CAGR to 2031.
- By sales channel, direct OEM agreements represented 42.10% of 2025 spend, while system integrators are expected to grow at a 7.10% CAGR as smart-building convergence accelerates.
- By geography, Asia-Pacific secured 41.50% of global 2025 revenue, whereas the Middle East is projected to record the highest 7.30% CAGR to 2031.
Note: Market size and forecast figures in this report are generated using Mordor Intelligence’s proprietary estimation framework, updated with the latest available data and insights as of January 2026.
Global Cleanroom Lighting Market Trends and Insights
Drivers Impact Analysis*
| Expansion of 300 mm semiconductor fabs in East Asia requiring ISO Class 1 luminaires | +1.2% | Asia-Pacific core, spillover to North America | Medium term (2-4 years) |
|---|---|---|---|
| Increasing GMP and ISO 14644 compliance pressure on European pharma manufacturers | +0.9% | Europe, North America | Short term (≤ 2 years) |
| Growth of biologics and cell-therapy facilities in North America demanding flicker-free sealed LEDs | +0.8% | North America, Europe | Medium term (2-4 years) |
| EU EcoDesign-2023 retrofit mandates accelerating LED replacement of legacy fluorescent fixtures | +0.7% | Europe, spillover to Middle East and Africa | Short term (≤ 2 years) |
| Uptake of UV-C-integrated luminaires for infection control in Gulf Cooperation Council hospitals | +0.5% | Middle East, Asia-Pacific | Long term (≥ 4 years) |
| High-speed food and beverage packaging lines in South America needing IP65 shatter-proof lighting | +0.4% | South America, Asia-Pacific | Medium term (2-4 years) |
| Expansion of 300 mm semiconductor fabs in East Asia requiring ISO Class 1 luminaires | +1.2% | Asia-Pacific core, spillover to North America | Medium term (2-4 years) |
| Source: Mordor Intelligence | |||
Expansion Of 300 mm Semiconductor Fabs In East Asia Requiring ISO Class 1 Luminaires
East Asian chipmakers broke ground on multiple 300 millimeter lines in 2025, each engineered for ISO Class 1 or 2 contamination thresholds that prohibit visible ballast housings and mandate fully sealed, low-outgassing LED panels.[1]Source: tsmc.com Fluorescent troffers, prone to phosphor dust and frequent lamp changes, were removed from semiconductor approved-vendor lists, shifting specification toward solid-state modules rated for 50,000 operating hours. Subsidy clauses under the CHIPS and European Chips Acts extended these cleanroom lighting standards to new fabs in Arizona, Ohio, and Dresden, broadening demand beyond Asia. Fixture suppliers raised cleanroom production capacity in Malaysia and Vietnam to shorten lead times from 18 to 10 weeks. As 2-nanometer gate-all-around processes ramp, the cleanroom lighting market will increasingly bundle Li-Fi or PoE interfaces to support RF-sensitive photolithography bays.
Increasing GMP And ISO 14644 Compliance Pressure On European Pharma Manufacturers
Full enforcement of EU Annex 1 in 2025 triggered an estimated EUR 1.8 billion (USD 1.96 billion) retrofit wave across German, French, and Italian sterile-drug plants, with auditors rejecting fixtures that lacked third-party particulate-shedding reports. Stainless-steel-housed LED panels rated IP65 became the default, displacing retrofit kits that preserved fluorescent troffer frames. The United Kingdom mirrored these requirements despite Brexit, forcing contract manufacturers that serve EU clients to align with the same luminaire test dossiers. Suppliers now offer pre-filled validation packs containing ISO 14644, IEC 60598, and EN 60529 certifications to shorten qualification cycles by 30%. Ongoing regulatory harmonization with the United States Pharmacopoeia is expected to propagate identical lighting specifications to North American fill-finish suites.
Growth Of Biologics And Cell-Therapy Facilities In North America Demanding Flicker-Free Sealed LEDs
The United States FDA cleared 16 cell and gene therapies in 2025, pushing contract development and manufacturing organizations to add 1.2 million square feet of ISO Class 7 and 8 suites. To avoid photodegradation of riboflavin-sensitized viral vectors, project teams specified LED drivers with <1% ripple, in line with IEEE 1789-2015 recommendations.[2]IEEE Standards Association, “IEEE 1789-2015 Recommended Practices,” standards.ieee.org Lonza and Catalent disclosed a combined USD 1.65 billion in expansions during 2025, each listing flicker-free luminaires as a critical utility to maintain licensure. Suppliers noted an 8% bill-of-materials premium for low-ripple drivers, yet buyers accepted the cost to avoid separate power-conditioning hardware. As autologous therapies move toward point-of-care manufacturing, demand for sealed, portable lighting carts is emerging, further enlarging the addressable cleanroom lighting market.
EU EcoDesign-2023 Retrofit Mandates Accelerating LED Replacement Of Legacy Fluorescent Fixtures
The September 2023 phase-out of T8 and T5 lamps eliminated most fluorescent options for industrial buyers, exhausting stockpiles by mid-2025 and causing a sharp pivot to LED panels.[3]European Commission, “Regulation 2019/2020 on Ecodesign Requirements,” ec.europa.eu Energy agencies reported 50%–60% electricity cuts after conversions, translating to sub-18-month paybacks in German and Danish pharmaceutical estates. Although retrofit kits initially captured one-third of demand, ISO 14644 auditors increasingly favored monolithic sealed panels that avoid ceiling-plane seams, reducing retrofit kit share to 20% by late-2025. LightingEurope forecasts that, by 2027, every new EU cleanroom project will specify edge-lit LED panels with integral DALI-2 drivers and minimum efficacy of 140 lumens per watt.
Restraints Impact Analysis*
| Volatile aluminium and polycarbonate prices inflating fixture BOMs | -0.6% | Global | Short term (≤ 2 years) |
|---|---|---|---|
| Scarcity of ATEX/IECEx-certified lights delaying Middle-East pharma projects | -0.4% | Middle East, Africa | Medium term (2-4 years) |
| Thermal-management limits of high-lumen LEDs in ISO Class 3 environments | -0.3% | Asia-Pacific, North America | Long term (≥ 4 years) |
| Shortage of skilled installers for sealed grid luminaires in Africa | -0.2% | Africa, Middle East | Medium term (2-4 years) |
| Volatile aluminium and polycarbonate prices inflating fixture BOMs | -0.6% | Global | Short term (≤ 2 years) |
| Source: Mordor Intelligence | |||
Volatile Aluminium And Polycarbonate Prices Inflating Fixture BOMs
London Metal Exchange aluminum averaged USD 2,485 per metric ton in 2025, and a 14% spike in polycarbonate compounded pressure on luminaire housings and diffusers. Manufacturers absorbed roughly half the rise, narrowing gross margins by up to 3 percentage points. Contractors responded by inserting escalation clauses into 12- to 24-month bids, while some vendors trialed steel housings with corrosion-resistant coatings to cut aluminum usage. Nevertheless, heavier steel frames elevate shipping and ceiling load, tempering adoption.
Scarcity Of ATEX/IECEx-Certified Lights Delaying Middle-East Pharma Projects
Saudi and UAE localization programs now mandate Zone 1-rated fixtures in solvent areas, yet fewer than 15 luminaires worldwide hold dual ATEX and IECEx approvals. Lead times stretch 26-32 weeks, and premiums run 40%–60% above standard cleanroom panels, pushing a USD 450 million sterile-injectables project in Riyadh six months off schedule. European vendors with existing certificates, such as Glamox and Waldmann, win by default but strain regional budgets. Gulf authorities are funding local certification labs to cut approval cycles in half, which could ease this restraint after 2027.
*Our forecasts treat driver/restraint impacts as directional, not additive. The impact forecasts reflect baseline growth, mix effects, and variable interactions.
Segment Analysis
By Light Source: LED Durability Reinforces Market Leadership
LED modules accounted for 82.40% of 2025 revenue, reflecting their 50,000–70,000 hour lifetimes that eliminate disruptive lamp changes inside contamination-controlled zones. Ultraviolet emitters are the fastest-advancing type at 4.99% CAGR, driven by Gulf Cooperation Council hospitals that integrate UV-C for airborne pathogen control, while induction and residual fluorescent systems decline as phase-out deadlines approach.
Healthcare buyers increasingly specify tunable-white LEDs to align circadian cycles and cut operator fatigue, and suppliers are integrating dynamic drivers without breaching ISO 14644 ceilings. UV-C arrays present thermal challenges because efficacy drops at elevated junction temperatures; new dual-chamber housings isolate germicidal diodes to preserve both disinfection and illumination performance. The cleanroom lighting industry is also experimenting with Li-Fi chips embedded alongside visible LEDs to transmit data in RF-restricted wafer fabs.


By Fixture Design: Hazardous-Location Enclosures Accelerate
Panel and troffer designs dominated 47.80% of shipments in 2025 owing to their compatibility with modular ceilings and standardized 600 × 600 millimeter footprints. Hazardous-location fixtures show the highest 7.12% CAGR through 2031 as battery and solvent-handling lines require Zone 1 and Zone 21 safety.
Explosion-proof housings with tempered glass and stainless-steel clamps add 55%–70% cost over standard panels but remain unavoidable for ATEX compliance. Downlights face retreat in ISO Class 5 bays because recessed apertures disrupt laminar airflow, whereas surface-mount strips still appeal to budget-sensitive utility corridors. The cleanroom lighting market share of panel and troffer units is expected to erode marginally but will stay above 40% through 2031.
By Mounting Type: Pendant Solutions Optimize Airflow
Recessed fixtures held 54.60% of 2025 installations as fabs favored flush ceiling planes that simplify pressure balancing. Pendant systems are forecast to gain 6.34% CAGR, particularly in biologics suites where computational fluid dynamics models prove that lowering luminaires reduces turbulence around critical workbenches.
Pendant arms enable 15%–20% energy savings by positioning light close to tasks, yet seismic codes in California and Japan inflate installation labor. Surface-mount options remain common in food plants that value washdown access over ceiling aesthetics. Manufacturers have introduced quick-disconnect pendants to cut change-out time to under five minutes, a benefit in round-the-clock aseptic fill lines.
By End-User Industry: Food Processing Surges Past Legacy Leaders
Semiconductor and electronics maintained 36.60% revenue share in 2025 as 300 millimeter fabs proliferated, yet food and beverage facilities are poised for the fastest 8.40% CAGR on hygiene mandates for aseptic packaging.
South American meat exporters and Argentine dairies led 2025 retrofits, demanding IP65 shatter-proof lenses to avoid glass contamination. Hospitals and life-science labs accounted for roughly one-quarter of sales, and aerospace cleanrooms took 8% as satellite-assembly programs expanded. The cleanroom lighting market size for food-sector retrofits is projected to cross USD 200 million by 2031, narrowing the gap with the electronics segment.
By Sales Channel: Integrators Gain From Smart-Building Convergence
Direct OEM contracts delivered 42.10% of 2025 revenue because global pharma and chip firms negotiate multisite agreements for identical fixtures. System integrators will grow at 7.10% CAGR as BMS vendors embed DALI-2 and BACnet gateways that unify lighting, HVAC, and particle monitoring on one dashboard.
Distributors still move one-third of units, serving smaller upgrades that require immediate stock. Online procurement platforms are eroding distributor margins for commodity LED panels, but integrator expertise remains essential on hazardous-location projects where ATEX documentation and commissioning dominate the scope. The cleanroom lighting market share of integrators could reach 30% by 2031 if PoE and Li-Fi deployments accelerate.
Geography Analysis
Asia-Pacific generated 41.50% of global revenue in 2025 and is expected to maintain a mid-4% CAGR as China’s CNY 120 billion wafer-fab pipeline and South Korea’s high-bandwidth memory lines progress. Taiwan’s expansion into Kyushu, Japan, added 14,200 sealed LED panels in a single fab, illustrating the region’s appetite for ISO Class 3-rated luminaires. India’s PLI-backed API plants further widen demand, while Australia and New Zealand contribute hospital retrofits.
The Middle East is set for the fastest 7.30% CAGR through 2031, powered by Saudi national transformation and UAE Operation 300bn localization projects. A USD 680 million sterile-injectables site in King Abdullah Economic City ordered 6,800 ATEX-certified fixtures, and Julphar installed UV-C panels in its USD 320 million biologics plant. Turkey’s export-oriented pharma expansions add regional momentum, although installer shortages across Africa continue to delay site completions by up to one year.
North America and Europe each contributed close to 24% in 2025. Cell-therapy approvals in the United States spurred 1.2 million square feet of new suites, and Annex 1 deadlines drove EUR 3.4 billion (USD 3.70 billion) in German pharma upgrades, while Mexico’s nearshoring of electronics and EV supply chains is adding 23 new cleanrooms across Querétaro and Guanajuato. Furthermore, South America, at roughly 6%, is seeing brisk dairy and meat-processing retrofits.

Competitive Landscape
Five vendors held an estimated 38% combined 2025 revenue, indicating moderate fragmentation. Signify leverages its Philips CleanRoom portfolio and a 140-country channel, recently investing EUR 45 million (USD 48 million) to add 1.2 million fixtures of annual LED capacity in Malaysia. Eaton’s Crouse-Hinds division strengthened hazardous-location coverage by acquiring Clean Air Lighting, injecting 14 new DALI-2 models into its range.
Regional specialists maintain agility: Waldmann delivers custom dimensions within eight weeks, and LUG Light Factory tailors optics for European biotech niches. Chinese brands such as Shenzhen Sansi Lighting captured 18% of Asia-Pacific income by pricing 25% below Western averages, yet limited ATEX portfolios hamper Middle-East penetration. Emerging disruptors like pureLiFi demonstrated 224 Mbps Li-Fi panels at SEMICON Europa, courting fabs that ban RF radios.
White-space remains in retrofits, with roughly 420,000 fluorescent-lit cleanrooms worldwide translating to a USD 1.8 billion addressable pool. Thermal-management patents, including Glamox’s phase-change heat sink, target high-lumen ISO Class 3 zones where junction temperatures threaten lumen maintenance.
Cleanroom Lighting Industry Leaders
Signify Holding
Wipro Lighting
Crompton Greaves Consumer Electricals Ltd.
LUG Light Factory Sp. z o.o.
Eaton Corporation Inc
- *Disclaimer: Major Players sorted in no particular order

Recent Industry Developments
- January 2026: Signify allocated EUR 45 million (USD 48 million) to expand LED-module output in Klang, Malaysia, adding 280,000 square feet of ISO Class 5 assembly space, to be completed in Q3 2027.
- November 2025: Eaton closed the acquisition of Clean Air Lighting, folding IP66 pharmaceutical panels and a 120-person engineering team into Crouse-Hinds.
- September 2025: Cree Lighting won a USD 22 million contract for 18,400 UV-C panels at King Faisal Specialist Hospital’s 840-bed tower in Riyadh.
- July 2025: Waldmann introduced MEDILUX Pro dual-chamber UV-C luminaires at Achema 2025, achieving a 99.9% microbial reduction validated by Fraunhofer.


Global Cleanroom Lighting Market Report Scope
A cleanroom is an environment where the ingress or entry of airborne particulates is strictly controlled to prevent contamination. Cleanrooms also control variables like airflow, temperature, and humidity. They can be classified into different types based on the levels of contamination depending on the number of particles allowed in the space per cubic meter.
The Cleanroom Lighting Report is Segmented by Light Source (LED, Fluorescent, Induction, and UV), Fixture Design (Panel/Troffer, Wrap-Around/Strip, Downlights, and Hazardous-Location), Mounting Type (Recessed, Surface, and Pendant), End-User (Semiconductor, Healthcare, Food and Beverage, Research, and More), Sales Channel (Direct OEM, System Integrators, and Distributors), and Geography. Market Forecasts are in Value (USD).
| LED |
| Fluorescent |
| Induction |
| UV |
| Panel/Troffer |
| Wrap-Around/Strip |
| Downlights |
| Hazardous-Location Fixtures |
| Recessed |
| Surface |
| Pendant/Suspended |
| Semiconductor and Electronics |
| Healthcare and Life Sciences |
| Food and Beverage Processing |
| Research and Academic Laboratories |
| Aerospace and Defense |
| Automotive Paint and Battery Manufacturing |
| Other Industries |
| Direct OEM |
| System Integrators |
| Distributors |
| North America | United States | |
| Canada | ||
| Mexico | ||
| South America | Brazil | |
| Argentina | ||
| Rest of South America | ||
| Europe | Germany | |
| United Kingdom | ||
| France | ||
| Italy | ||
| Spain | ||
| Rest of Europe | ||
| Asia Pacific | China | |
| Japan | ||
| South Korea | ||
| India | ||
| Australia | ||
| New Zealand | ||
| Rest of Asia-Pacific | ||
| Middle East and Africa | Middle East | United Arab Emirates |
| Saudi Arabia | ||
| Turkey | ||
| Rest of Middle East | ||
| Africa | South Africa | |
| Nigeria | ||
| Kenya | ||
| Rest of Africa | ||
| By Light Source | LED | ||
| Fluorescent | |||
| Induction | |||
| UV | |||
| By Fixture Design/Form Factor | Panel/Troffer | ||
| Wrap-Around/Strip | |||
| Downlights | |||
| Hazardous-Location Fixtures | |||
| By Mounting Type | Recessed | ||
| Surface | |||
| Pendant/Suspended | |||
| By End-User Industry | Semiconductor and Electronics | ||
| Healthcare and Life Sciences | |||
| Food and Beverage Processing | |||
| Research and Academic Laboratories | |||
| Aerospace and Defense | |||
| Automotive Paint and Battery Manufacturing | |||
| Other Industries | |||
| By Sales Channel | Direct OEM | ||
| System Integrators | |||
| Distributors | |||
| By Geography | North America | United States | |
| Canada | |||
| Mexico | |||
| South America | Brazil | ||
| Argentina | |||
| Rest of South America | |||
| Europe | Germany | ||
| United Kingdom | |||
| France | |||
| Italy | |||
| Spain | |||
| Rest of Europe | |||
| Asia Pacific | China | ||
| Japan | |||
| South Korea | |||
| India | |||
| Australia | |||
| New Zealand | |||
| Rest of Asia-Pacific | |||
| Middle East and Africa | Middle East | United Arab Emirates | |
| Saudi Arabia | |||
| Turkey | |||
| Rest of Middle East | |||
| Africa | South Africa | ||
| Nigeria | |||
| Kenya | |||
| Rest of Africa | |||


Key Questions Answered in the Report
What is the projected value of the cleanroom lighting market in 2031?
It is forecast to reach USD 1.17 billion by 2031, growing at a 4.68% CAGR from 2026.
Which light source dominates current cleanroom installations?
LED technology led with 82.40% revenue share in 2025 thanks to long lifetimes and energy savings.
Which end-user segment is expanding the fastest?
Food and beverage processing is advancing at an 8.40% CAGR through 2031 as aseptic packaging lines proliferate.
Why are hazardous-location fixtures gaining traction?
Battery and solvent-handling zones require ATEX or IECEx certified luminaires, driving a 7.12% CAGR for this design.
Page last updated on:


