
Technology, Media and Telecom
5th MayPricing Strategy for Semiconductor Components
3 Min Read
The Ultrasonic Cleaning Market Report is Segmented by Product (Benchtop, Standalone, Multistage-2, and More), Power Output (Up To 250 W, 250-1000 W, 1000-5000 W, and More), Frequency Range (25-40 KHz (Low), 40-80 KHz (Mid), 80-120 KHz (High), and Above120 KHz (Megasonic)), End-User (Automotive, Healthcare and Medical Devices, Food and Beverage, and More), and Geography. The Market Forecasts are Provided in Terms of Value (USD).
Market Overview
| Study Period | 2020 - 2031 |
|---|---|
| Market Size (2026) | USD 1.66 Billion |
| Market Size (2031) | USD 2.11 Billion |
| Growth Rate (2026 - 2031) | 4.96 % CAGR |
| Fastest Growing Market | Asia Pacific |
| Largest Market | North America |
| Market Concentration | Medium |
Major Players *Disclaimer: Major Players sorted in no particular order. Image © Mordor Intelligence. Reuse requires attribution under CC BY 4.0. |
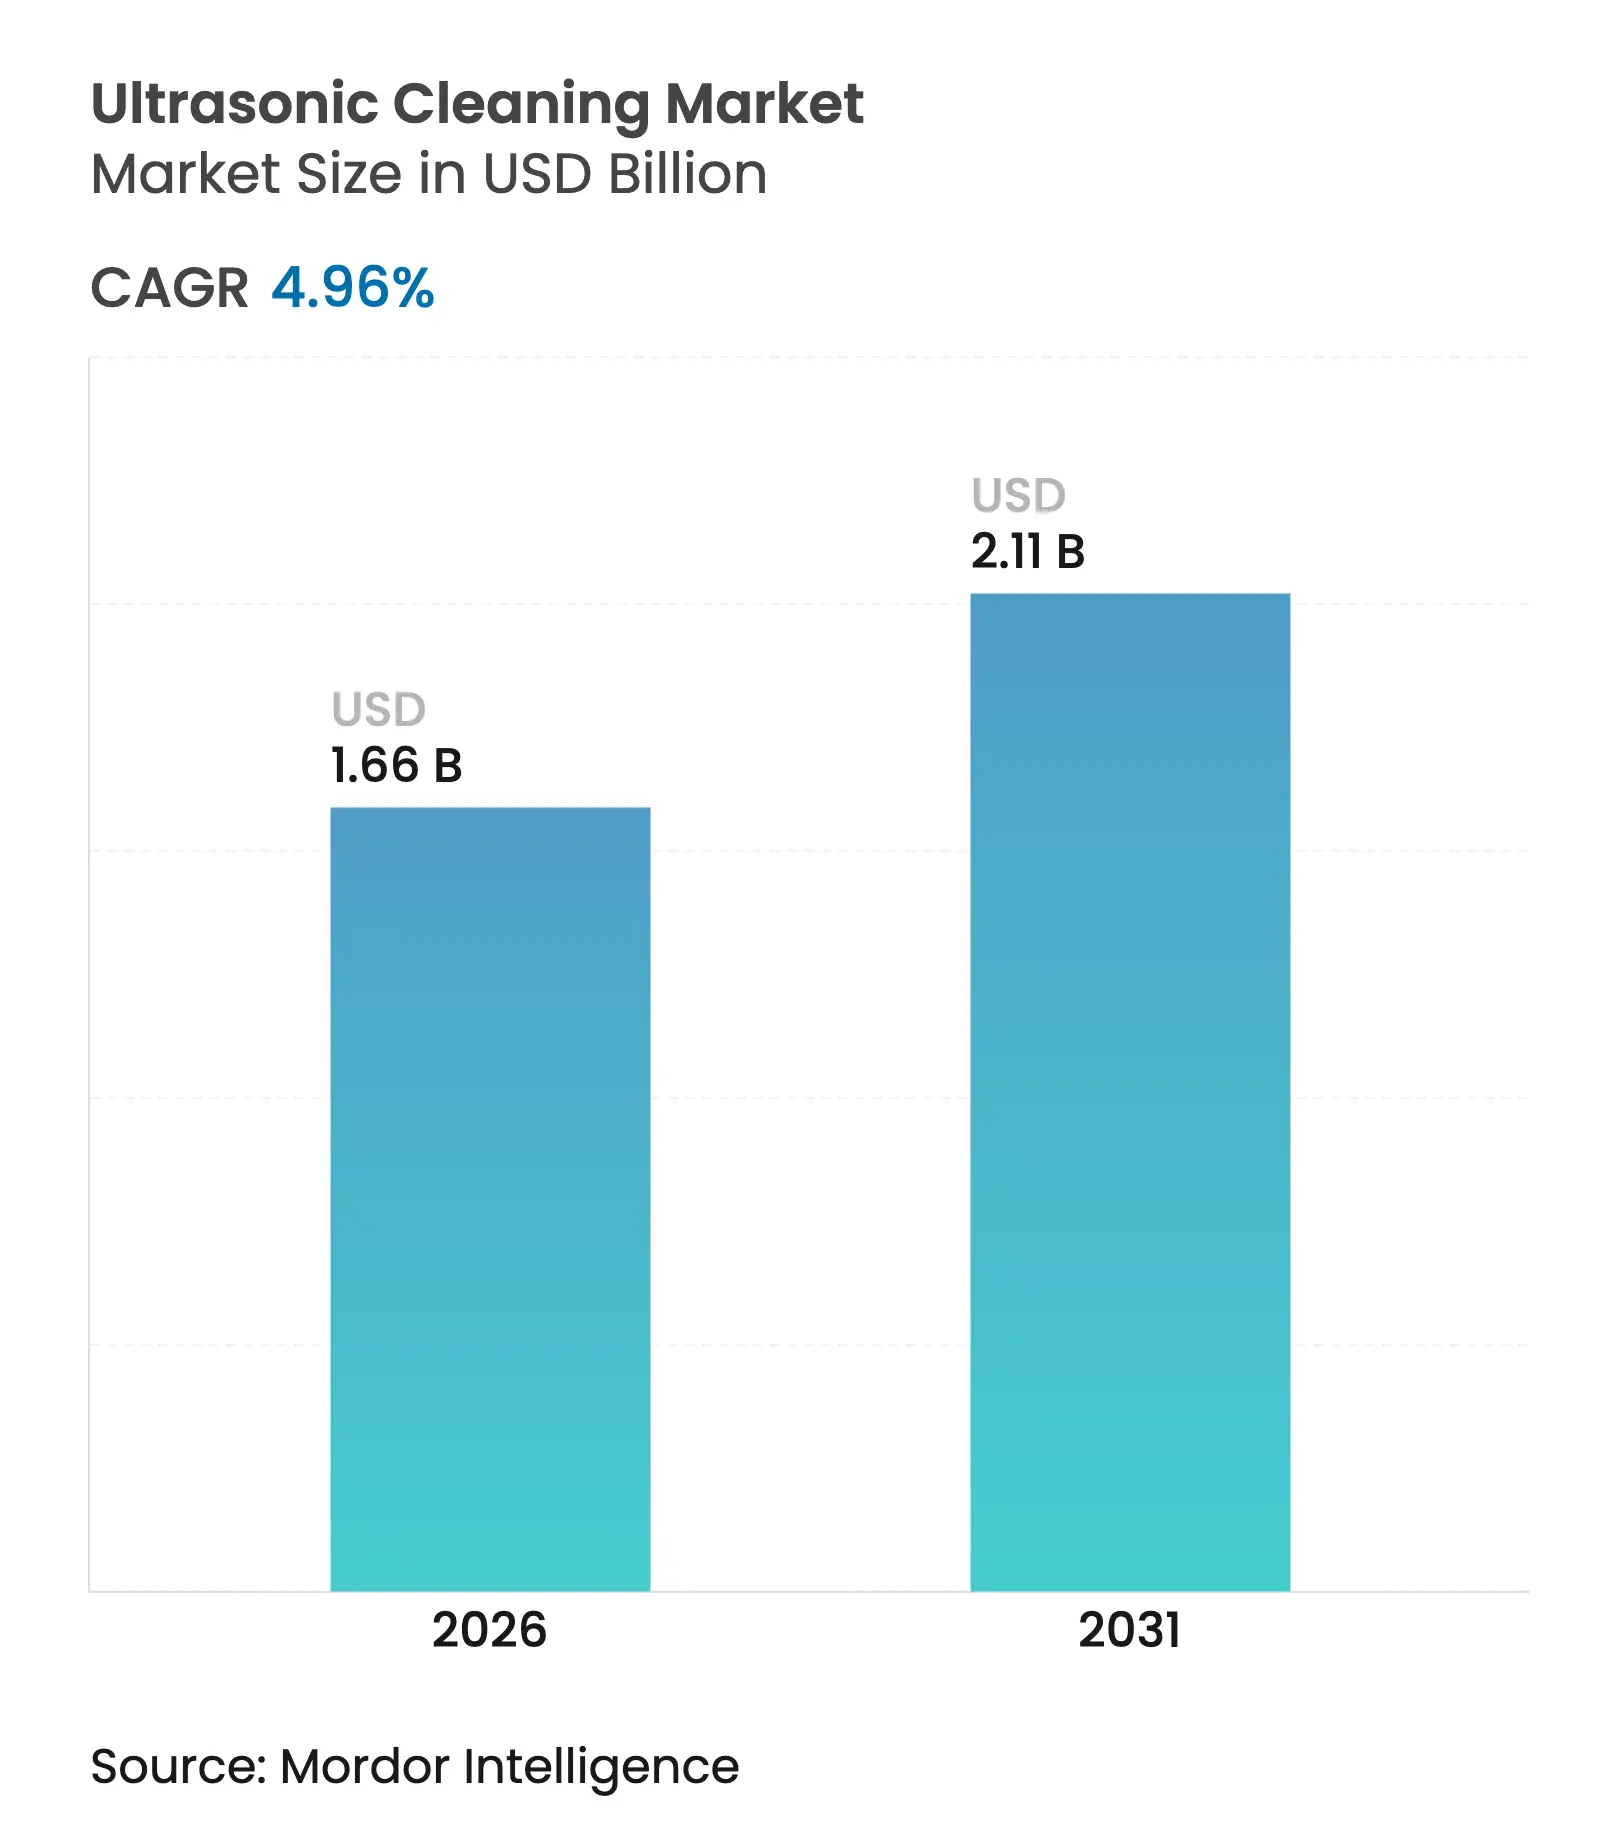
Ultrasonic cleaning market size in 2026 is estimated at USD 1.66 billion, growing from 2025 value of USD 1.58 billion with 2031 projections showing USD 2.11 billion, growing at 4.96% CAGR over 2026-2031. The upward trend stems from stricter contamination rules in semiconductors and medical devices, the rapid scale-up of EV battery lines, and expanding use of aqueous chemistries that meet environmental mandates. Growth is further catalyzed by Industry 4.0 initiatives that link cleaning units to plant-wide data platforms, enabling predictive maintenance and lower downtime. Makers of high-frequency systems are also benefiting from the miniaturization of consumer electronics, which demands sub-micron debris removal. At the same time, capital-intensive multistage systems are reshaping buying patterns, creating space for leasing models and service-based offerings that make advanced capabilities accessible to smaller manufacturers.
Key Report Takeaways
Note: Market size and forecast figures in this report are generated using Mordor Intelligence's proprietary estimation framework, updated with the latest available data and insights as of 2026.
Drivers Impact Analysis
| Driver | (~) % Impact on CAGR Forecast | Geographic Relevance | Impact Timeline | |||
|---|---|---|---|---|---|---|
Stringent contamination standards in
semiconductors & medical devices
Stringent contamination standards in
semiconductors & medical devices
| +1.3% | North America, Europe | Medium term (2-4 years) | (~) % Impact on CAGR Forecast:
+1.3%
| Geographic Relevance:
North America, Europe
| Impact Timeline:
Medium term (2-4 years)
|
EV-battery component cleaning demand
EV-battery component cleaning demand
| +1.0% | Asia Pacific | Medium term (2-4 years) | |||
REACH-driven shift to aqueous chemistry
REACH-driven shift to aqueous chemistry
| +0.8% | Europe | Long term (≥4 years) | |||
Miniaturization of consumer electronics
Miniaturization of consumer electronics
| +0.5% | Global | Medium term (2-4 years) | |||
Industry 4.0-enabled OEE gains
Industry 4.0-enabled OEE gains
| +0.8% | North America, Europe, Asia Pacific | Medium term (2-4 years) | |||
Post-pandemic infection-control in hospitals
Post-pandemic infection-control in hospitals
| +0.5% | Latin America | Short term (≤2 years) | |||
| Source: Mordor Intelligence | ||||||
Stringent Contamination Standards in Semiconductor & Medical Device Supply-Chains
Particle tolerances in chip fabs now sit in the nanometer range, making traditional spray or solvent approaches insufficient. Multi-frequency cleaners operating at 80–120 kHz remove 50 nm particles without damaging fragile wafers, which can otherwise cut yield by 15%.[1]Semiconductor Engineering staff, “An Innovative Hybrid Cleaning Approach for Contaminant Removal in Semiconductor Packaging,” Semiconductor Engineering, semiengineering.com The U.S. Food and Drug Administration’s tighter guidance has similarly lifted ultrasonic installations at medical-device plants by 35% since 2024, driving convergence toward platforms that support several frequencies in a single tank for mixed device portfolios.
Surge in EV-Battery Component Manufacturing Requiring Precision Cleaning
Electrode foils, casings, and tabs demand residue-free surfaces to secure weld quality and battery safety. Integrated cleaning-and-welding cells exemplified by Emerson’s GMX-20 series prepare parts immediately ahead of ultrasonic welds, shortening cycle time and ensuring bond consistency.[2]Emerson Electric Co., “EV Battery Assembly,” emerson.com Partnerships such as Schneider Electric–Liminal now bundle ultrasound inspection with cleaning, highlighting the move toward closed-loop quality verification.
REACH-Driven Shift to Aqueous Chemistry in EU Industrial Plants
Solvent restrictions under REACH have pushed manufacturers to adopt water-based formulations that amplify cavitation while cutting volatile organic compound emissions. Cleaner vendors now supply tailored chemistries that meet both performance and compliance goals, strengthening the regulatory case for ultrasonic adoption. Global multinationals are standardizing these processes across plants, extending the EU’s influence well beyond its borders.
Miniaturization of Consumer Electronics Demanding Sub-Micron Debris Removal
Camera modules, micro-speakers, and MEMS sensors feature voids too narrow for sprays or brushes. High-frequency and megasonic systems create smaller cavitation bubbles that navigate tight pathways, protecting delicate coatings while achieving full particulate removal. Selection guides now match geometry and soil type to optimal frequency, turning frequency choice into a design parameter rather than a catalog specification.[3]Tovatech editorial team, “Laboratory Sonicator Guide: Applications, Benefits, and Equipment,” tovatech.com
Restraints Impact Analysis
| Restraint | (~) % Impact on CAGR Forecast | Geographic Relevance | Impact Timeline | |||
|---|---|---|---|---|---|---|
High capex of multistage (>USD 100 k)
systems
High capex of multistage (>USD 100 k)
systems
| -0.8% | Global | Medium term (2-4 years) |
(~) % Impact on CAGR Forecast
:
-0.8%
|
Geographic Relevance
:
Global
|
Impact Timeline
:
Medium term (2-4 years)
|
Cavitation-related damage risk in aerospace
composites
Cavitation-related damage risk in aerospace
composites
| -0.5% | North America, Europe | Short term (≤2 years) | |||
Need for pre-wash on heavy grease loads
Need for pre-wash on heavy grease loads
| -0.3% | Global | Short term (≤2 years) | |||
Fragmented frequency and power standards
Fragmented frequency and power standards
| -0.3% | Global | Medium term (2-4 years) | |||
| Source: Mordor Intelligence | ||||||
High Capex of Multistage Systems Limiting SME Adoption
Fully automated lines costing USD 100 000–300 000 can strain SME budgets, prompting outsourcing or reduced cleaning scope. Equipment makers are countering with leasing and pay-per-use models, while a secondary market for refurbished units gains traction. Even with the price hurdle, demand for multistage units is projected to grow from USD 1.03 billion in 2025 to USD 1.50 billion by 2031 as manufacturers seek throughput gains.
Cavitation-Related Damage Concerns in Aerospace Composites
Carbon-fiber reinforced polymers risk micro-cracks when exposed to aggressive cavitation. Trials show megasonic cleaning above 1 MHz removes 98% of particles yet keeps surface pitting minimal. [4]Chu C-L, Lu T-Y, and Fuh Y-K, “Suitability of Ultrasonic and Megasonic Cleaning of Nanoscale Patterns,” researchgate.net Nonetheless, aerospace primes require extensive validation, pushing suppliers to add power-modulation features that temper acoustic stress during cleaning cycles.
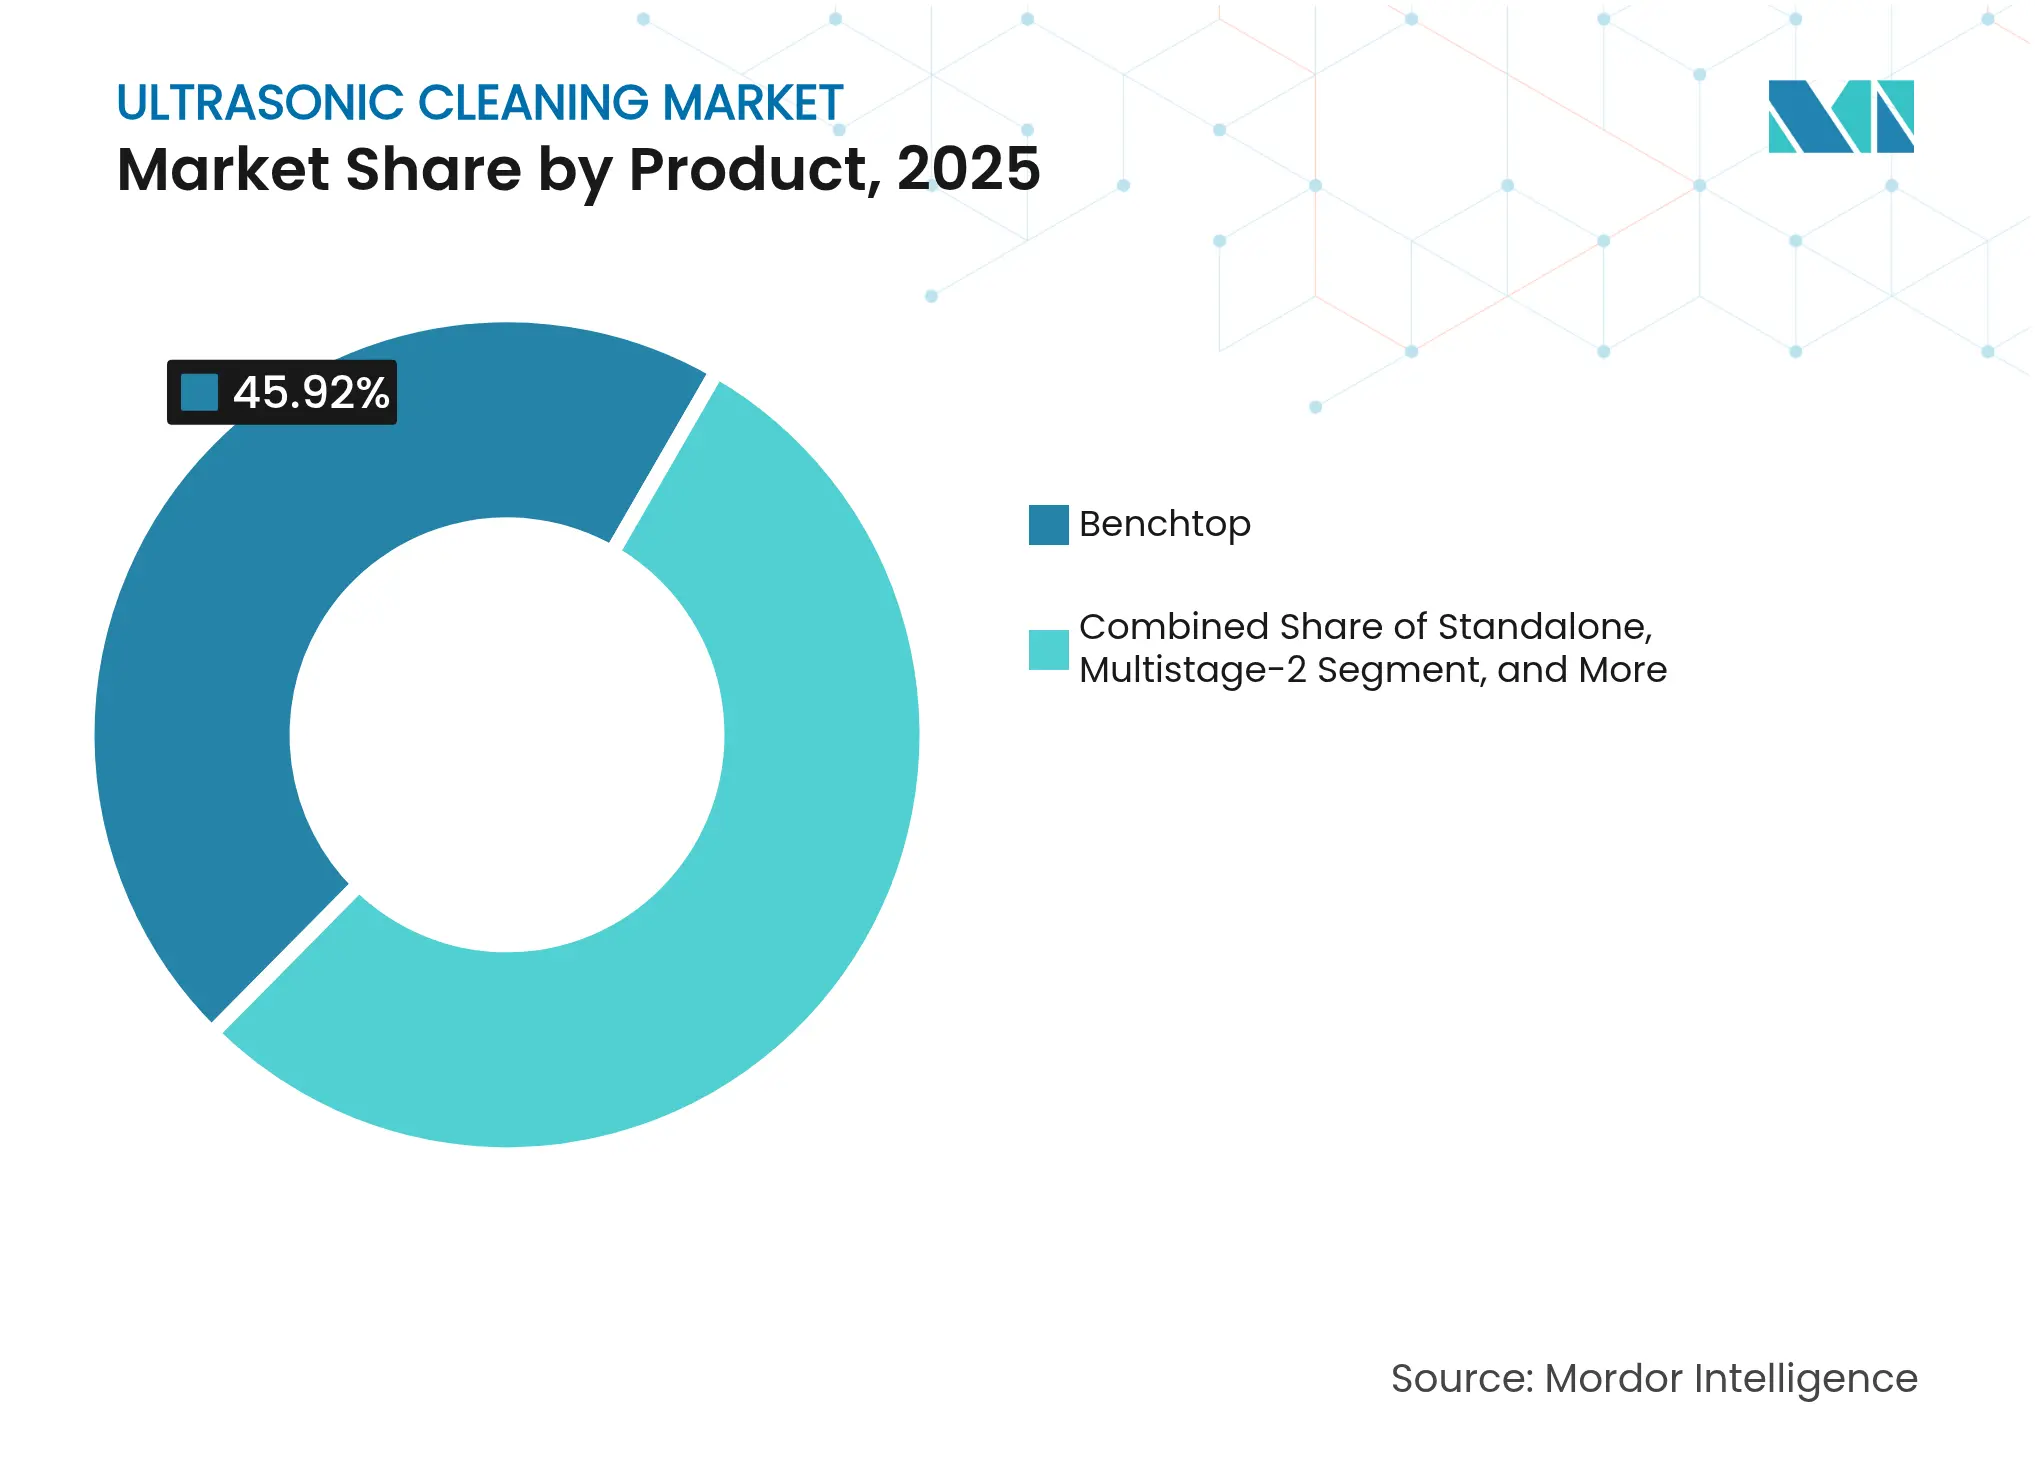
By Product: Benchtop Dominates, Multistage Accelerates
Benchtop units held 45.92% of ultrasonic cleaning market share in 2025, making them the default choice for clinics, repair shops, and on-site maintenance cells. Digital timers, memory presets, and compact footprints drive widespread use, while recent models add USB data export, aligning small units with broader quality-record mandates. Multistage installations, though a smaller slice of the ultrasonic cleaning market size, are scaling at 7.02% CAGR on the back of lights-out manufacturing trends. Their integrated wash, rinse, and dry stages shorten handling time, lift first-pass yield, and support consistent audit trails.
Demand for immersible transducers is growing among plants that retrofit legacy tanks; these plug-and-play modules span 300–2500 W and adapt to irregular tank shapes. Conveyorized lines, the smallest segment by volume, play a pivotal role in electronics and automotive clusters where continuous flow aligns directly with takt time. The market now values Ethernet connectivity and support for OPC UA even at mid-tier price points, underscoring the pivot from stand-alone devices to networked assets.
Note: Segment shares of all individual segments available upon report purchase
By Power Output: Mid-Range Dominates, High-Power Surge
The 1000–5000 W bracket accounted for 33.62% of ultrasonic cleaning market share in 2025 because it balances cavitation vigor against energy cost. These units serve medical instruments, hydraulic parts, and tooling inserts with equal ease, reducing the need for multiple power classes on the factory floor. Systems above 10 000 W represent the fastest-growing slice at 7.38% CAGR. They clean large engine blocks and aerospace fixtures in single passes and now feature variable-power drives that throttle output to suit load density, trimming peak current draw.
Entry-level ranges below 250 W remain staples in analytical labs and watch repair, prized for quiet operation and low heat generation. Between 5000 W and 10 000 W, vendors now tout application calculators that factor tank volume, soil type, and throughput targets to propose right-sized equipment, replacing rule-of-thumb sizing with data-driven selection.
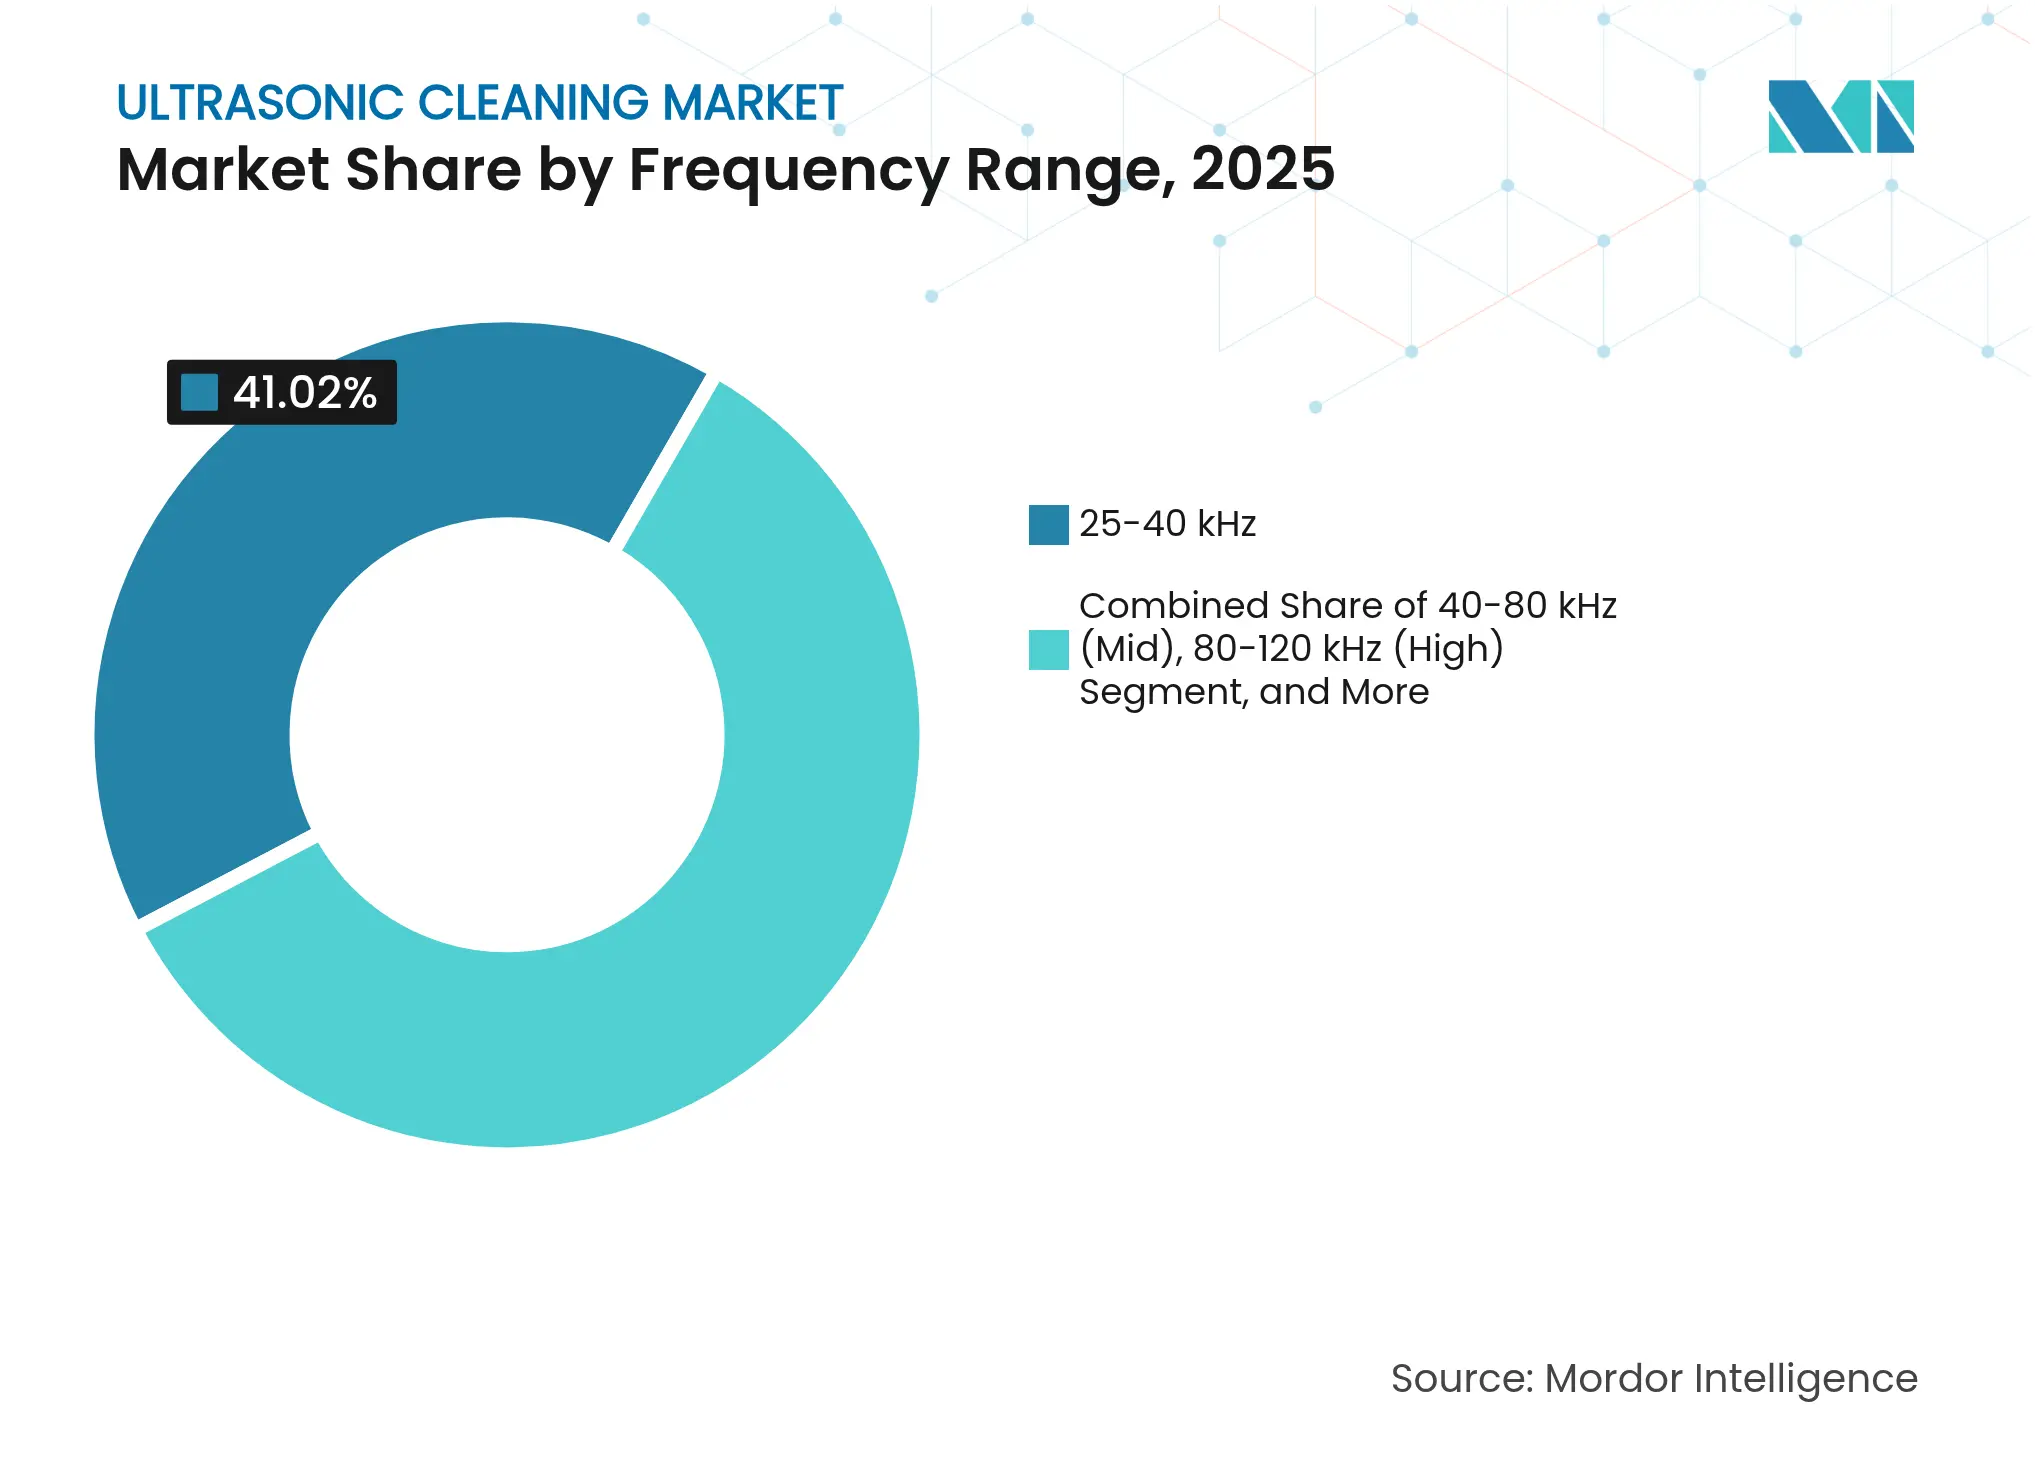
By Frequency Range: Low Frequency Leads, Megasonic Advances
The 25–40 kHz band secured 41.02% share of the ultrasonic cleaning market in 2025, excelling at sludge, grease, and machining-oil removal. Rugged components tolerate the robust implosions this range delivers, making it the workhorse for heavy industry. Megasonic systems above 120 kHz are ascending at 6.46% CAGR, propelled by 3 nm semiconductor nodes and micro-LED displays. Studies confirm 98% particle clearance without feature loss, endorsing megasonics for the most fragile substrates.
Between these poles, 40–80 kHz units serve medical devices and optical lenses, while 80–120 kHz cleaners target laboratory glassware and fine capillaries. Multi-frequency designs fetch premium prices yet deliver flexibility by matching each batch to an optimal frequency profile, reducing changeover time in high-mix environments.
Note: Segment shares of all individual segments available upon report purchase
By End User: Food & Beverage Leads, Automotive Accelerates
Food & beverage operations commanded 22.71% of ultrasonic cleaning market revenue in 2025 as hygiene rules toughened and allergen control became front-of-mind. Cavitation reaches internal channels of filling valves and heat-exchange plates, dislodging biofilms that chemical CIP loops often miss. The automotive segment, in contrast, is expanding at 6.62% CAGR, fueled by EV drivetrains that integrate delicate electronics and contaminate-sensitive battery modules.
Healthcare facilities rely on ultrasonic cavitation to access serrations and lumens of surgical tools, while chip fabs and battery plants adopt high-frequency variants for particle removal. Jewelry, fine-art restoration, and R&D labs remain steady contributors, yet each demands specialized baskets, chemistries, or validation records, nudging suppliers to launch niche-specific SKUs.
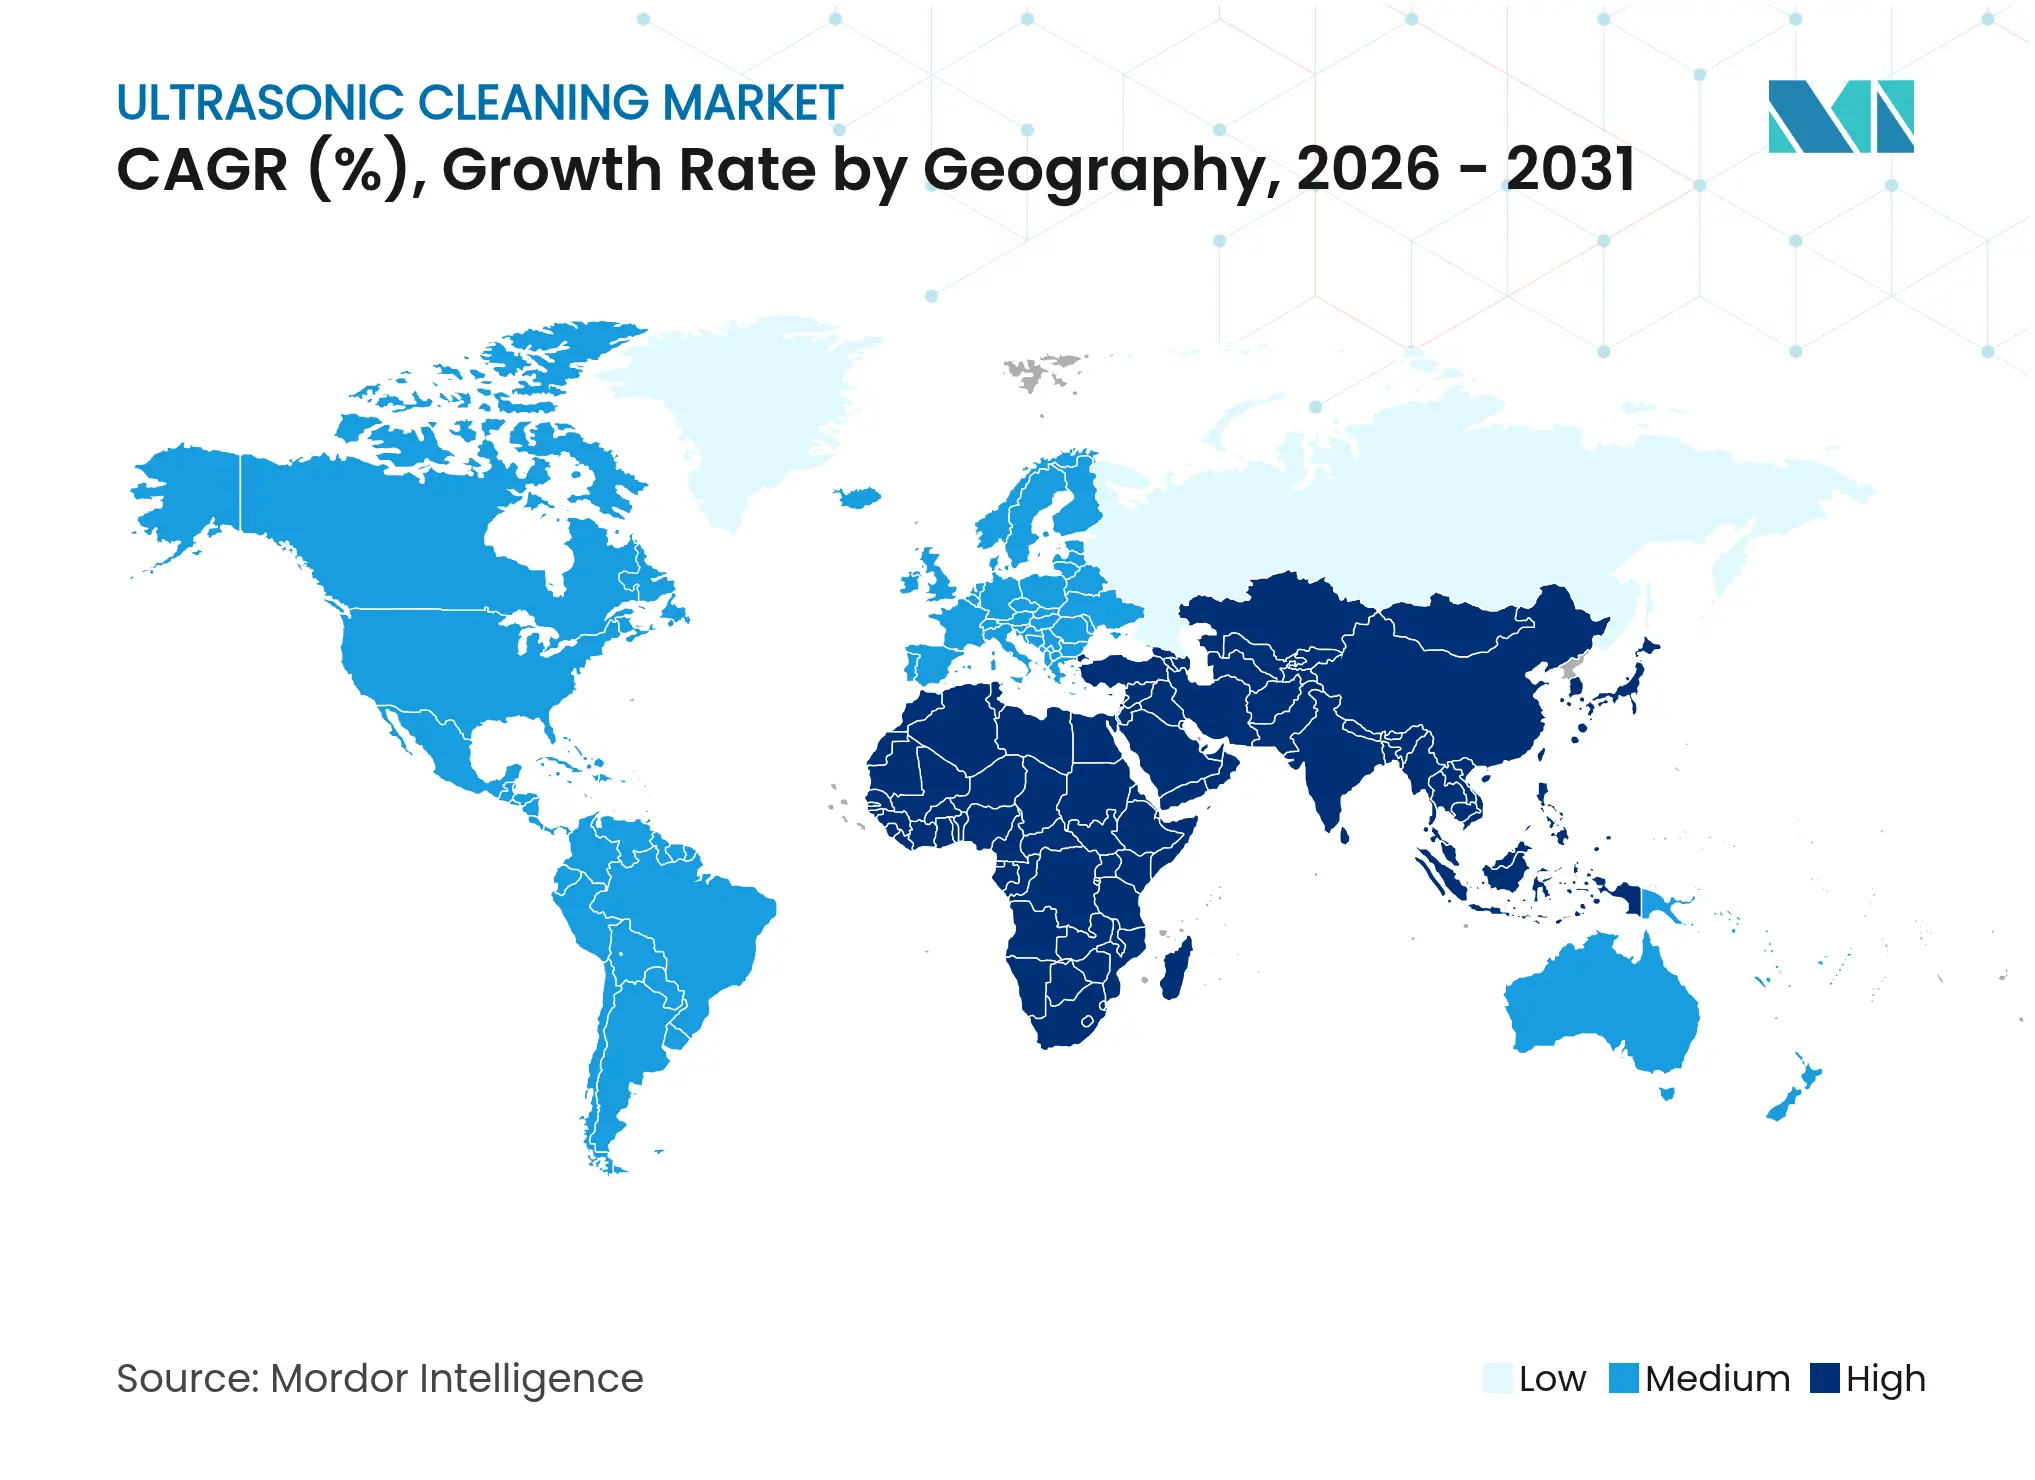
North America generated 30.25% of 2025 ultrasonic cleaning market revenue, anchored by medical device, aerospace, and semiconductor clusters. FDA audits and the push for digital documentation have spurred adoption of IoT-ready cleaners that feed cycle data straight to quality-management systems. In aerospace, the regional ultrasonic cleaning equipment market for airframe applications is projected to climb from USD 842 million in 2025 to USD 1.22 billion by 2031, underscoring sustained investment in high-performance maintenance tools.
Asia Pacific is the fastest-growing region at a 7.05% CAGR through 2031. China’s handset and display giants specify megasonic stages for camera modules, while Japanese and Korean fabs standardize on multi-frequency tanks for compound semiconductors. Environmental rules that curb solvent emissions are steering factories toward aqueous-based ultrasonic lines, and domestic suppliers in Shenzhen and Suzhou are scaling rapidly with competitively priced, network-enabled models.
Europe maintains solid demand, powered by REACH compliance and world-class automotive exports that require residue-free parts. Plants in Germany and France favor multistage aqueous systems to eliminate chlorinated solvents. Latin America, led by Brazil and Argentina, is upgrading hospital sterilization workflows after the pandemic, with public tenders now stipulating ultrasonic steps in decontamination rooms. The Middle East and Africa remain small but key markets for oil-field tool refurbishment and luxury watch servicing, where cavitation excels at removing scale and fine dust.
Market Concentration
Roughly 20 notable suppliers vie across price points and geographies, yielding a moderately fragmented arena. Branson Ultrasonic under Emerson and Crest Ultrasonics lead in technology depth, offering software-defined platforms that log every cycle parameter for audit readiness. Regional specialists differentiate by quick service response and tailoring units to niche tasks such as printed circuit board defluxing or orthopedic implant processing.
Industry 4.0 compatibility now distinguishes top-tier offerings. Ethernet/IP, OPC UA, and MQTT gateways feed performance data into plant dashboards, allowing predictive part-life scheduling. Several mid-size challengers embed artificial intelligence that tunes dwell time and power to soil load, cutting water and energy use by up to 18%. Parts-plus-chemistry bundles are also rewriting competition, as cleaning-fluid formulators package tanks, detergent, and aftermarket support under one contract, shifting buyer focus from capex to lifecycle cost.
Strategic acquisitions continue. Steris bolstered its healthcare line by adding a niche ultrasonic specialist, while Telsonic’s modular TelsoFlex architecture lets clients scale power from 500 W to 15 000 W without replacing the entire tank. Singapore-based manufacturing expansion by Cleaning Technologies Group shortens lead times for Asia-Pacific orders and illustrates the drift toward localized assembly near end-user hubs.

*Disclaimer: Major Players sorted in no particular order
1. INTRODUCTION
2. RESEARCH METHODOLOGY
3. EXECUTIVE SUMMARY
4. MARKET LANDSCAPE
5. MARKET SIZE AND GROWTH FORECASTS (VALUES)
6. COMPETITIVE LANDSCAPE
7. MARKET OPPORTUNITIES AND FUTURE OUTLOOK
Market Definitions and Key Coverage
Segmentation Overview
Detailed Research Methodology and Data Validation
Primary Research
Desk Research
Market-Sizing & Forecasting
Data Validation & Update Cycle
Why Mordor's Ultrasonic Cleaning Baseline Commands Reliability
Benchmark comparison
| Market Size | Anonymized source | Primary gap driver | ||
|---|---|---|---|---|
USD 1.58 B (2025) | Mordor Intelligence | - | Anonymized source:Mordor Intelligence | Primary gap driver:- |
USD 1.74 B (2025) | Global Consultancy A | Counts auxiliary semi-aqueous machines and applies manufacturer list prices without freight discounts | ||
USD 2.10 B (2024) | Industry Portal B | Adds cleaning chemistry revenues and uses pre-pandemic FX rates, leading to currency uplift |
Pricing Strategy for Semiconductor Components
3 Min Read
Accelerating Additive Manufacturing Adoption in India
3 Min Read
When decisions matter, industry leaders turn to our analysts. Let’s talk.