Laser Cleaning Market Size and Share
Market Overview
| Study Period | 2020 - 2031 |
|---|---|
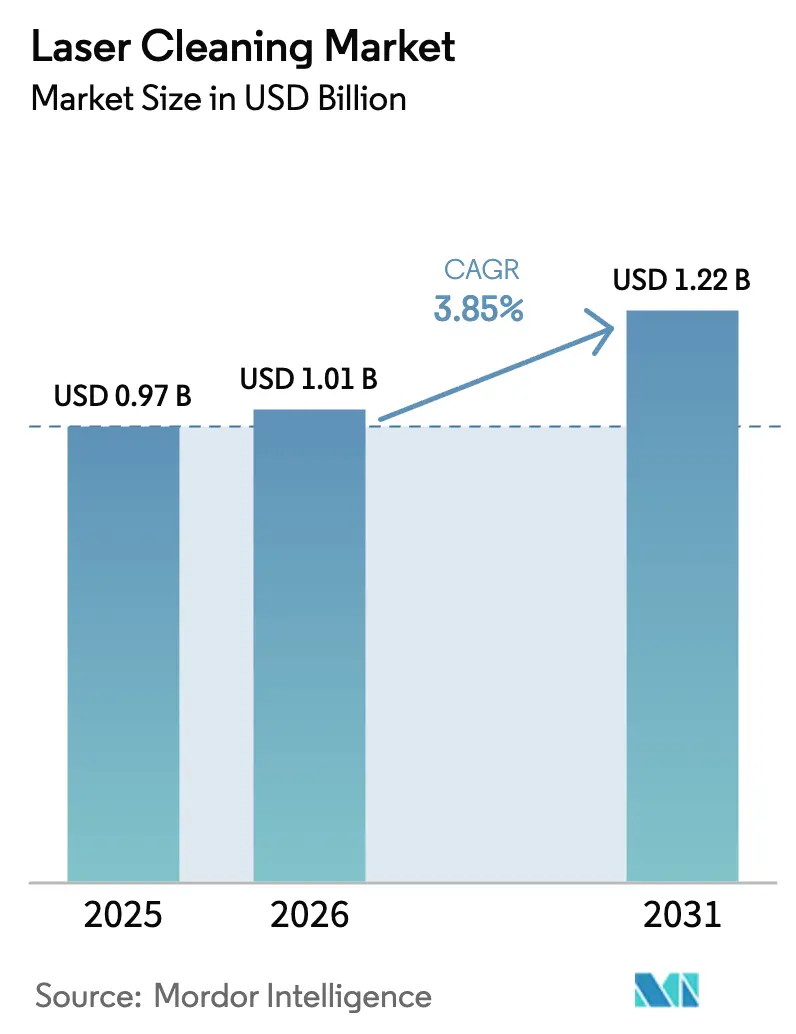
| Market Size (2026) | USD 1.01 Billion |
| Market Size (2031) | USD 1.22 Billion |
| Growth Rate (2026 - 2031) | 3.85% CAGR |
| Fastest Growing Market | Middle East and Africa |
| Largest Market | Asia Pacific |
| Market Concentration | Medium |
Major Players*Disclaimer: Major Players sorted in no particular order Image © Mordor Intelligence. Reuse requires attribution under CC BY 4.0. | |
Laser Cleaning Market Analysis by Mordor Intelligence
The Laser Cleaning Market size is expected to increase from USD 0.97 billion in 2025 to USD 1.01 billion in 2026 and reach USD 1.22 billion by 2031, growing at a CAGR of 3.85% over 2026-2031.
Stricter solvent-discharge rules in Europe and North America, falling cost-per-watt in fiber sources, and growing use of non-contact cleaning in battery and semiconductor lines are the core forces steering growth. Mid-tier fabricators in China, India, and Southeast Asia are now able to afford 500 W portable units, once limited to global OEMs, widening the installed base. At the same time, heritage-restoration teams in Italy, Greece, and Japan are shifting from chemical poultices to femtosecond lasers that avoid thermal discoloration of stone or fresco pigments. Automotive body shops are embedding high-power robotic cells into welding-line islands to remove oils and oxides in a single pass, cutting cycle time by 25 seconds and raising weld seam strength by 40% compared with solvent wiping. As these uses expand, replacement of grit blasting and solvent baths keeps the laser cleaning market on a steady upward path despite lingering cost barriers for high-power systems in developing economies.
Key Report Takeaways
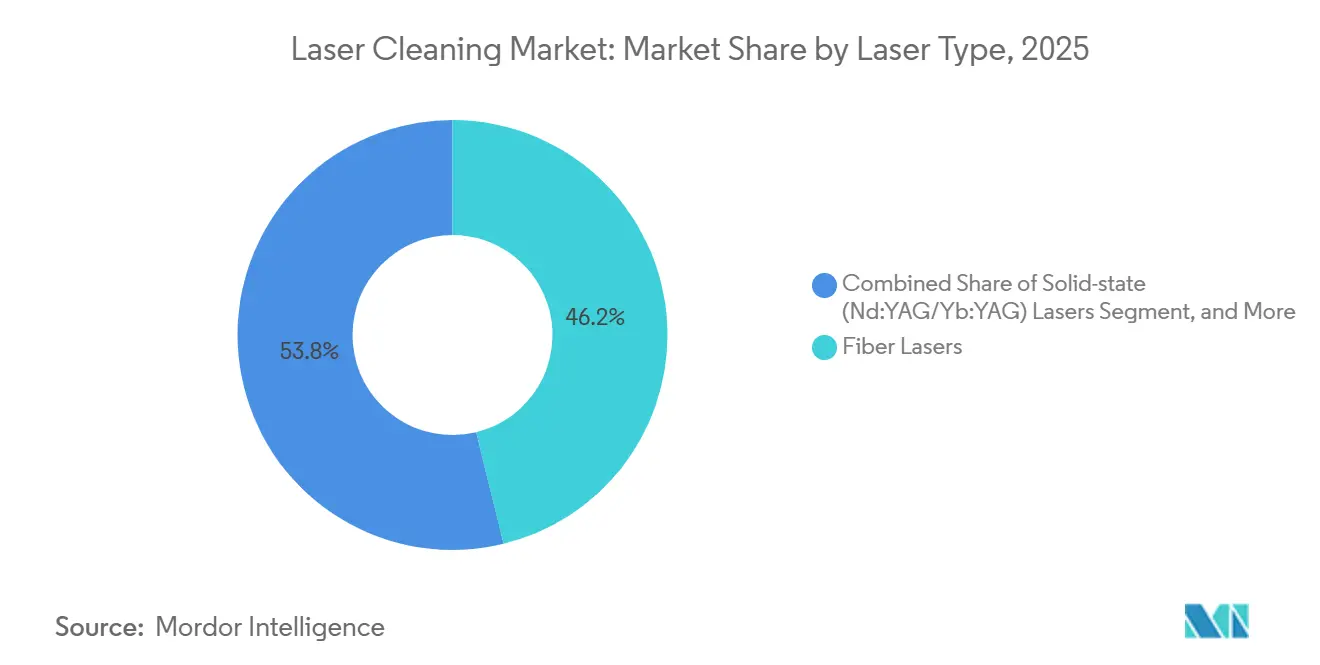
- By laser type, fiber lasers commanded 46.18% laser cleaning market share in 2025 while ultrashort-pulse systems are projected to expand at a 4.55% CAGR through 2031.
- By power range, medium-power units between 100 W and 1 kW accounted for 38.43% of the laser cleaning market size in 2025, whereas high-power systems above 1 kW are set to grow at a 4.82% CAGR through 2031.
- By portability, handheld and portable configurations captured 51.28% revenue in 2025; robotic and automated cells hold the fastest route forward with a 4.91% CAGR to 2031.
- By pulse duration, nanosecond sources held 44.57% share in 2025 while ultrashort-pulse variants will pace at a 5.01% CAGR through 2031.
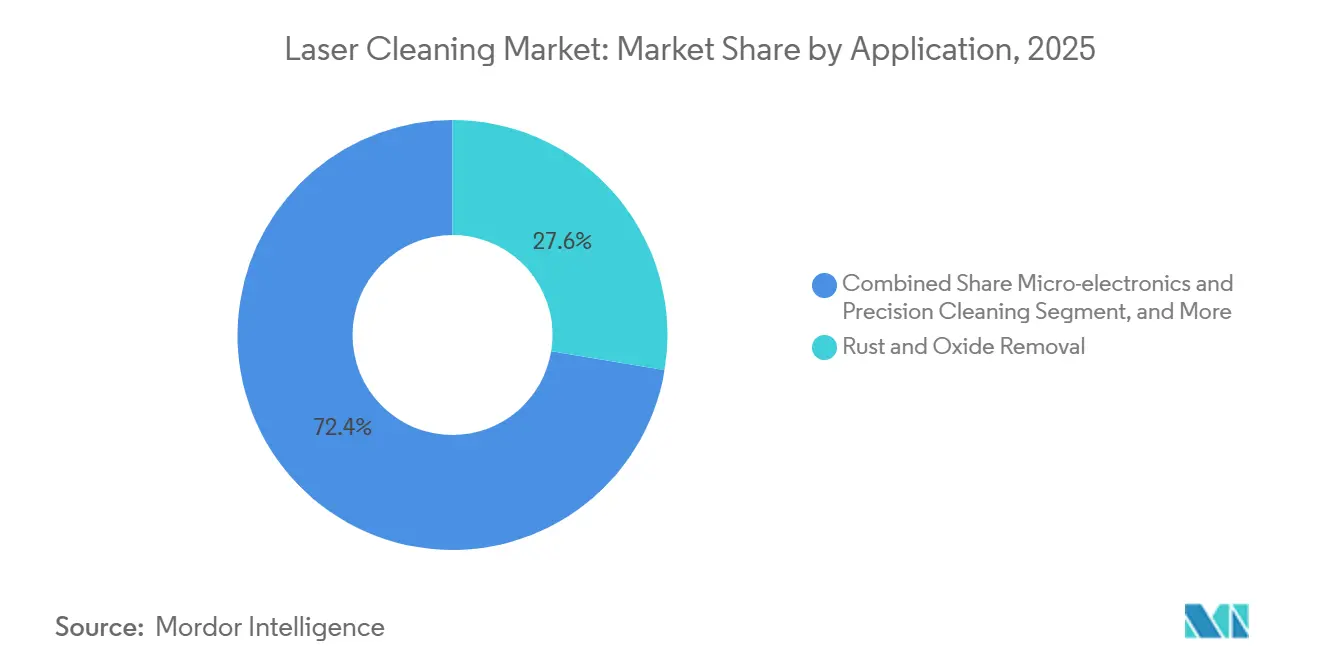
- By application, rust and oxide removal led with 27.61% of 2025 revenue; microelectronics and precision cleaning is advancing at a 4.29% CAGR to 2031.
- By end-user industry, automotive and transport held 29.46% of 2025 spending, yet electronics and semiconductor plants represent the quickest lift at a 4.35% CAGR through 2031.
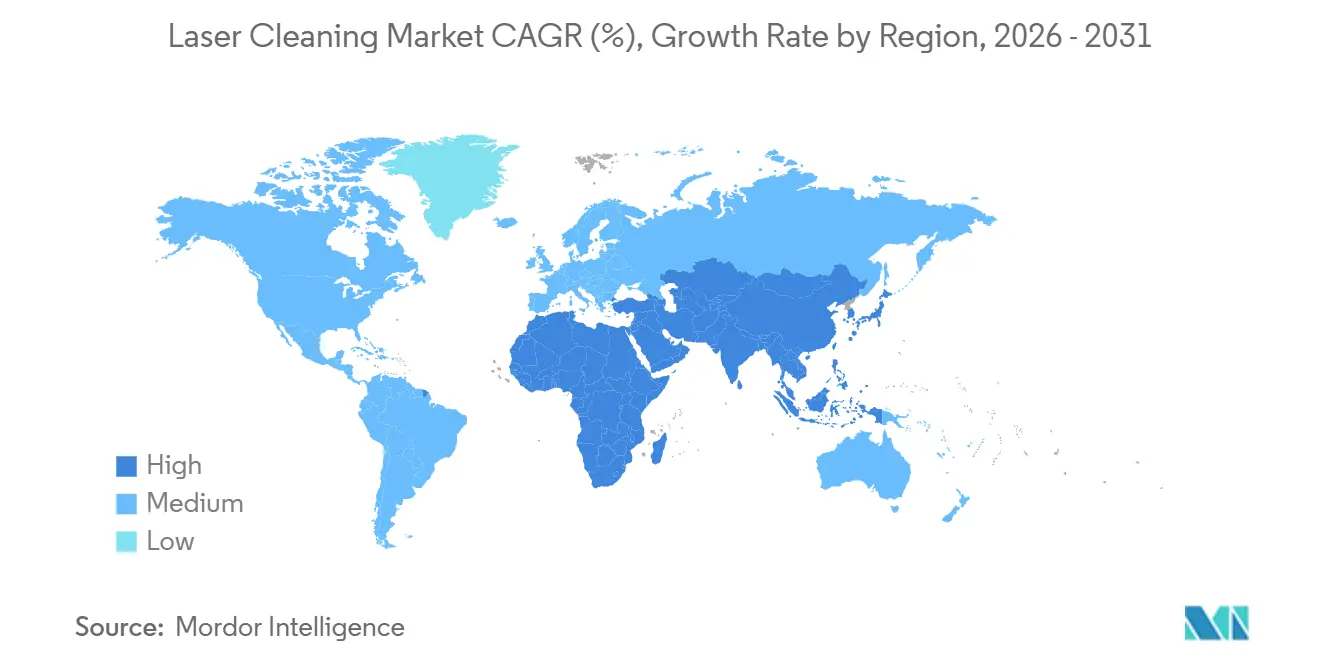
- By geography, Asia Pacific dominated with 36.29% of worldwide 2025 turnover and the Middle East is expected to grow at a 5.15% CAGR through 2031.
Note: Market size and forecast figures in this report are generated using Mordor Intelligence’s proprietary estimation framework, updated with the latest available data and insights as of January 2026.
Global Laser Cleaning Market Trends and Insights
Drivers Impact Analysis*
| Driver | (~) % Impact on CAGR Forecast | Geographic Relevance | Impact Timeline |
|---|---|---|---|
| Stringent Environmental Regulations Replacing Chemical Solvents in EU and North America | +0.90% | Europe and North America, spillover to APAC manufacturing hubs | Medium term (2-4 years) |
| Rising Automation Demand for Non-contact Surface Preparation in Automotive Body Shops | +0.80% | Global, with concentration in Germany, United States, China, Japan | Short term (≤ 2 years) |
| Growth in Restoration Projects of Historical Monuments in Europe and Asia | +0.30% | Europe (Italy, France, Greece), Asia (India, China, Japan) | Long term (≥ 4 years) |
| Investments in Nuclear Facility Decommissioning Requiring Remote Laser Decontamination | +0.50% | North America, Europe, Japan, emerging in Middle East | Long term (≥ 4 years) |
| EV Battery Production Lines Necessitating Residue-free Electrode Cleaning | +0.70% | APAC core (China, South Korea), expanding to North America and Europe | Short term (≤ 2 years) |
| Falling Cost-per-Watt of Fiber Lasers Broadening SME Adoption in Asia | +0.60% | Asia Pacific (China, India, Southeast Asia), gradual diffusion to emerging markets | Medium term (2-4 years) |
| Source: Mordor Intelligence | |||


Stringent Environmental Regulations Replacing Chemical Solvents
The European Union’s VOC Directive and parallel restrictions in California have made solvent baths economically untenable for many metal fabricators. Waste-disposal fees exceed USD 200 per drum in Germany, prompting tier-one automotive suppliers to retrofit 500 W fiber lasers that leave zero residue.[1]European Commission, “Directive 2004/42/EC on VOC Emissions,” eur-lex.europa.eu Airbus documented an 85% cut in VOC output after switching to laser cleaning for composite-tool maintenance at its Hamburg plant.[2]Airbus SE, “Annual Report 2024,” airbus.com OSHA’s tighter exposure limits for methylene chloride in 2025 spurred similar moves in U.S. facilities, while multinational OEMs now impose uniform green standards on Asia-Pacific subcontractors. Contract manufacturers in Poland and the Czech Republic have adopted laser paint-stripping lines to hold on to automotive contracts, showing how regulation accelerates technology diffusion beyond early adopters.
Rising Automation Demand for Non-contact Surface Preparation
Assembly plants are pairing 1.5 kW fiber lasers with six-axis robots inside body-in-white welding cages. Fraunhofer ILT found that laser-cleaned aluminium panels deliver 40% higher weld strength than chemically prepared samples.[3]Fraunhofer Institute for Laser Technology, “Laser Surface Preparation for Automotive Welding,” fraunhofer.de Removing the manual wiping stage trims 25 seconds per vehicle body, a gain worth millions of dollars per year in a line rated at 300,000 units. German suppliers showed 22% growth in robotic laser-cell installations in 2025 as labour scarcity collided with stricter tolerance goals. Chinese EV producers are also adopting automated laser chambers for battery-pack housings, cutting warranty claims linked to poor adhesive bonding.
EV Battery Production Lines Needing Residue-free Electrode Cleaning
Lithium-ion cells demand sub-nanometer cleanliness on electrode foils. The U.S. National Renewable Energy Laboratory proved that femtosecond ablation removes binder films without micro-cracking substrates. Vendors such as Laserax and K2 Laser now supply turnkey 1.5 kW solutions capable of treating tapes at 20 meters per minute in South Korean gigafactories. As solid-state chemistries take hold, surface roughness requirements will tighten further, making laser cleaning a mandatory step rather than a cost option.
Investments in Nuclear Facility Decommissioning
Japan Atomic Energy Agency used remote laser systems at Fukushima Daiichi to strip radioactive oxides while cutting secondary waste by 60%. The United Kingdom’s Nuclear Decommissioning Authority followed suit, awarding contracts for robotic laser solutions in 2025. The International Energy Agency forecasts USD 400 billion in global decommissioning spend by 2040, anchoring long-run demand for fiber-delivered laser units that keep operators behind shielding walls. The UAE and Saudi Arabia are building the requirement into new reactor tenders, setting a baseline for future projects.
Restraints Impact Analysis*
| Restraint | (~) % Impact on CAGR Forecast | Geographic Relevance | Impact Timeline |
|---|---|---|---|
| High Capital Expenditure for High-power Systems in Developing Economies | -0.60% | South America, Africa, Southeast Asia, India | Medium term (2-4 years) |
| Limited Field Portability for Offshore Maintenance | -0.30% | Global, acute in offshore oil and gas (North Sea, Gulf of Mexico, Southeast Asia) | Short term (≤ 2 years) |
| Substrate Thermal Damage Risk on Heat-Sensitive Materials | -0.20% | Global, concentrated in aerospace composites and cultural heritage | Long term (≥ 4 years) |
| Scarcity of Certified Laser Cleaning Technicians in Emerging Markets | -0.40% | Africa, South America, Southeast Asia, India | Medium term (2-4 years) |
| Source: Mordor Intelligence | |||
High Capital Expenditure for High-power Systems in Developing Economies
Systems above 1 kW still list for more than USD 150,000. When fume extraction and Class 4 enclosures are added, project budgets can double. Indian and Brazilian SMEs view such sums as prohibitive relative to grinder-based lines that cost one-tenth as much. Equipment-leasing solutions remain scarce because service networks in Africa and Latin America are thin, limiting lessor appetite. The issue is acute for high-power robots, while handheld 200 W models selling around USD 25,000 are gaining limited traction.
Scarcity of Certified Laser Cleaning Technicians in Emerging Markets
Running a Class 4 laser safely demands IEC 60825 certification, yet most training is held in Germany, the United States, and Japan. South Africa posted a 40% shortage of qualified staff in 2025, forcing import of German contractors at USD 800 per day. India’s new laser-technology curriculum graduates only 150 technicians per year, far below demand, stretching commissioning schedules and leaving owners exposed to downtime during faults.
*Our forecasts treat driver/restraint impacts as directional, not additive. The impact forecasts reflect baseline growth, mix effects, and variable interactions.
Segment Analysis
By Laser Type: Fiber Leads, Ultrafast Rises
Fiber devices delivered 46.18% laser cleaning market share in 2025, thanks to wall-plug efficiency above 30% and low maintenance overhead. The laser cleaning market size for fiber units will climb steadily as shipyards, battery plants, and mold shops value throughput over extreme precision. Picosecond and femtosecond sources will keep a 4.55% CAGR by 2031, winning delicate jobs in aerospace composites and museum artifacts. Solid-state Nd:YAG holdings persist in legacy military depots but are sliding as fiber beam-quality improves. CO₂ lasers, anchored in concrete paint removal, remain marginal because of bulky three-phase power supplies.
IPG Photonics shipped 15% more fiber units for cleaning in 2025 than in 2024, citing automotive demand. TRUMPF’s 2 kW TruPulse Clean platform arrives in 2026 with beam-quality metrics rivalling older ultrafast machines yet at fiber-level economics. Coherent’s 2024 purchase of EKSMA Optics signals its push into ultrafast domains, highlighting the split strategy most majors are adopting.


By Power Range: Medium Systems Govern Volume
Medium-power systems between 100 W and 1 kW held 38.43% of 2025 revenue. They remove rust at 5-8 square meters per hour and clean molds in cycle times acceptable to injection shops, making them the default selection for contract fabricators. High-power models above 1 kW will grow at a 4.82% CAGR through 2031 as robotic welding islands multiply in body shops, generating fresh demand for 1.5 kW to 3 kW heads capable of inline cleaning.
Laserax recorded a nine-month payback on a 1.5 kW robotic cell at a Canadian stamping plant that eliminated manual grinding. By contrast, low-power units under 100 W remain niche in jewelry repair and micro-part deburring, where operators prioritize handheld safety and portability.
By Portability: Handheld Flexibility Versus Robotic Throughput
Handheld and portable versions captured 51.28% of 2025 turnover. Bridge contractors and shipyards pick these tools because scaffolding height or dockyard terrain rules out heavy carts. Robotic and automated cells, however, command the fastest growth at 4.91% through 2031 as automotive makers require 24/7 uptime and repeatability. Benchtop systems sit between the two, favoured by mold shops that bring tooling to the laser instead of moving a 300-kilogram machine across the floor.
ABB and KUKA both introduced cobots with integrated laser-ready cabling in 2025, shrinking programming tasks to drag-and-teach workflows that mid-sized plants can handle without specialist code writers. P-Laser’s 18-kilogram backpack model widens addressable use cases for remote bridge spans and cathedral spires where power cords and wheelbases are impractical.
By Pulse Duration: Nanosecond Workhorse, Ultrafast Frontier
Nanosecond products were installed in 44.57% of sites in 2025, acting as workhorses for rust and paint removal. They deliver sufficient pulse energy to eject contaminants yet tolerate higher thermal loading on steel decks and cast-iron molds. Ultrashort pulses below 10 picoseconds will chart a 5.01% CAGR through 2031, driven by wafer fabs and cultural-heritage teams needing sub-micron heat zones.
Light Conversion’s PharosQuartz femtosecond engine targets semiconductor clients that need photoresist removal at sub-10-nanometer roughness. Although the price premium is large, the cost of wafer scrap makes it worthwhile in a GigaFab that prints 300 wafers per hour.
By Application: Rust Volume, Precision Margin
Rust and oxide removal led with 27.61% of 2025 value, underpinned by shipbuilding hull maintenance and highway-bridge refurbishment. Microelectronics and precision cleaning is the fastest-growing segment, advancing at a 4.29% CAGR through 2031 as electrode and PCB flux residues demand zero contamination. Paint stripping for aerospace and rail cars sits in the middle, slowed by polymer heat sensitivity even though lasers eliminate media waste.
Surface pretreatment for welding continues to climb, validated by adhesive-bond strength gains found by Fraunhofer ILT. Mold cleaning saves 20% in tool downtime per year for die-cast operators, while nuclear decontamination, though small in revenue, commands premium pricing due to shielding and remote optics.
By End-User Industry: Automotive First, Electronics Fastest
Electronics and semiconductor plants are set to lead all sectors with a projected CAGR of 4.35% through 2031. These facilities are increasingly employing femtosecond devices for wafer cleaning, a process essential for maintaining the quality and performance of semiconductor components, as well as for preparing battery electrodes, which are vital for the growing electric vehicle market. While aerospace maintenance and shipbuilding maintain their established niches, they continue to rely on laser technologies for tasks such as surface preparation, component repair, and structural modifications, ensuring operational efficiency and safety. Infrastructure contractors are increasingly opting for portable 300 W rigs, which are being used for diverse applications such as cutting and sealing bridge expansion joints and removing graffiti from public spaces.
These portable systems offer flexibility and cost-effectiveness, making them a preferred choice for on-site operations. Although nuclear operators purchase in lower volumes compared to other sectors, they pay the highest unit prices for laser systems. This is due to the stringent requirements and specialized applications in nuclear facilities, such as decommissioning and material processing. These high-value purchases help offset margin pressures experienced in other areas of the market, ensuring a balanced revenue stream for laser system manufacturers.
Geography Analysis
Asia Pacific generated 36.29% of global 2025 turnover, led by China’s retrofit program mandating non-contact cleaning to meet 2025 VOC caps. South Korea’s gigafactories line up 50 units of IPG 1.5 kW systems for electrode work, showing the region’s depth in batteries. Japanese decommissioning budgets ensure long-term demand for remote fiber tools, while India’s PLI incentives will lift semiconductor adoption after 2027.
Europe sustained share on the back of Germany’s automotive robotic cells and Italy’s heritage-stone restorations. The region benefits from policy push and mature service networks. North America follows, with U.S. aerospace depots and Canadian pipeline yards absorbing thousands of handheld units.
The Middle East will post the fastest regional growth, a 5.15% CAGR, thanks to Saudi Arabia’s NEOM megaproject and the UAE’s Barakah plant requiring low-waste decontamination tools in arid sites. Africa and South America trail because of capital constraints, though Brazil’s offshore rigs and South Africa’s mining refurb lines create pockets of portable laser demand.

Competitive Landscape
Competition is moderate. TRUMPF, IPG Photonics, and Coherent combine vertical control of diodes, fibers, and beam-delivery optics. Their global service fleets appeal to auto and aero majors bound by strict safety compliance. Clean-Lasersysteme, P-Laser, Laserax, and Laser Photonics differentiate with turnkey cells and handhelds tailored to niche jobs like mold cleaning or bridge decks. Chinese suppliers such as Han’s Laser and HGLaser price 30% below European marks and are winning small and mid-size contracts.
Technology focus is split. Incumbents channel capital into both cost-down projects for high-volume fiber heads and R&D on ultrafast systems for wafer fabs. Patent filings in 2024-2025 revolve around adaptive scanning that senses plasma emissions in real time and re-tunes pulse energy on corroded steel. Partnerships also shape the field: Coherent bought EKSMA Optics to bulk up ultrafast capability, Laserax partnered with KUKA for plug-and-play cobot cells, and Clean-Lasersysteme links with Fraunhofer ILT on composite tooling.
White-space opportunities remain in offshore wind towers and food-processing sanitation, where no vendor yet offers units that satisfy both mobility limits and FDA surface-finish rules. Suppliers able to package battery-powered 500 W heads with sanitary-grade optics stand to capture these future pools.
Laser Cleaning Industry Leaders
Jinan Xintian Technology Co., Ltd (XT Laser)
TRUMPF Group
Laser Photonics Corporation
Laserax Inc.
Adapt Laser Systems
- *Disclaimer: Major Players sorted in no particular order

Recent Industry Developments
- January 2026: TRUMPF Group rolled out TruLaser Clean 3000, a 2-kW robotic cell with plasma-monitoring software aimed at sub-15 second component cycles in automotive body shops.
- March 2025: Fraunhofer ILT finalized the IDEEL project, achieving 60% faster laser drying in lithium-ion battery webs.
- February 2025: Laser Photonics and Fonon Technologies partnered with Brokk to showcase portable laser cleaning for nuclear waste at WM Symposia 2025.
- February 2025: Mitsui O.S.K. Lines, Furukawa Electric, and Tsuneishi Shipbuilding completed shipboard trials of the InfraLaser rust-removal system.


Research Methodology Framework and Report Scope
Market Definitions and Key Coverage
According to Mordor Intelligence, we define the laser cleaning market as the sale of stand-alone systems and integrated workcells that use pulsed or continuous laser beams to remove coatings, oxides, residues, or biofilms from metal, composite, stone, or polymer substrates across manufacturing, maintenance, and restoration settings.
Scope Exclusion: Contract service revenues from third-party job shops and non-laser surface preparation tools are excluded.
Segmentation Overview
- By Laser Type
- Fiber Lasers
- Solid-state (Nd:YAG/Yb:YAG) Lasers
- CO2 Lasers
- Ultrashort-Pulse (Picosecond/Femtosecond) Lasers
- By Power Range
- High Power (Greater than 1 kW)
- Medium Power (100 W-1 kW)
- Low Power (Less than 100 W)
- By Portability
- Handheld/Portable Systems
- Benchtop/Stationary Systems
- Robotic/Automated Integrated Cells
- By Pulse Duration
- Continuous-Wave
- Nanosecond Pulsed
- Ultrashort-Pulse (Ps/Fs)
- By Application
- Paint and Coating Removal
- Rust and Oxide Removal
- Surface Pretreatment and Welding Preparation
- Mold Cleaning and Tooling Maintenance
- Cultural Heritage and Artwork Restoration
- Micro-electronics and Precision Cleaning
- Nuclear Decontamination
- By End-user Industry
- Automotive and Transport
- Aerospace and Defense
- Shipbuilding and Marine
- Infrastructure and Construction
- Energy and Power
- Oil and Gas
- Nuclear
- Renewables
- Electronics and Semiconductor
- Cultural Heritage Institutions
- Manufacturing and Industrial Machinery
- By Geography
- North America
- United States
- Canada
- Mexico
- South America
- Brazil
- Rest of South America
- Europe
- Germany
- United Kingdom
- France
- Italy
- Spain
- Rest of Europe
- Asia Pacific
- China
- Japan
- South Korea
- India
- South-East Asia
- Australia
- Rest of Asia Pacific
- Middle East
- United Arab Emirates
- Saudi Arabia
- Rest of Middle East
- Africa
- South Africa
- Rest of Africa
- North America
Detailed Research Methodology and Data Validation
Primary Research
Mordor analysts interview laser OEM engineers, MRO shop supervisors, heritage conservators, and purchasing heads across North America, Europe, and leading Asia-Pacific manufacturing hubs. These talks validate adoption thresholds, typical power classes, average selling prices, and duty-cycle expectations that secondary data cannot reveal.
Desk Research
Our desk work starts with global trade statistics for laser machines (UN Comtrade HS 845611, 845612), followed by safety and solvents regulations from OSHA and the European Chemicals Agency that signal switching incentives. We then mine industry association white papers, such as the International Federation of Robotics on automated workcells, the American Welding Society on pre-weld surface prep, and the European Automotive Manufacturers Association for vehicle repaint cycles, to anchor application pools. Company 10-Ks, patent families accessed through Questel, and price trackers on fiber-laser modules from D&B Hoovers round out costs and competitive intensity. This list is illustrative; many additional open and paid sources inform our evidence base.
Market-Sizing & Forecasting
We start with a top-down reconstruction that aligns 2024 customs import values with estimated domestic builds, adjusted for distributor mark-ups and typical 10-year asset life to derive the installed base. Results are cross-checked through a selective bottom-up roll-up of major supplier shipments and representative ASP × volume samples from channel partners. Key model inputs include fiber-laser cost erosion, industrial robot penetration, environmental fee trajectories, power-class mix shifts, typical machine utilization hours, and refurbishment cycles. A multivariate regression, supported by expert consensus, links these drivers to unit demand and calibrates our 2025-2030 forecast. Data gaps in supplier disclosures are bridged using conservative midpoint estimates rooted in interview ranges.
Data Validation & Update Cycle
Every model run is peer reviewed, then stress-tested against external indicators such as tooling exports and industrial production indices. Anomalies trigger re-contacts with sources before sign-off. Our report refreshes annually, with interim tweaks when material events, such as technology breakthroughs or policy bans on solvents, occur.
Why Mordor's Laser Cleaning Baseline Commands Reliability
Published numbers vary because firms adopt different scopes, price stacks, and refresh cadences.
Some count service revenues, while others freeze exchange rates well ahead of publication.
Benchmark comparison
| Market Size | Anonymized source | Primary gap driver |
|---|---|---|
| USD 0.76 B (2025) | Mordor Intelligence | - |
| USD 0.66 B (2024) | Regional Consultancy A | Focuses on factory equipment only, omits restoration and heritage segments. |
| USD 0.86 B (2024) | Global Consultancy B | Adds rental fleets and cleaning service contracts, inflating value. |
The comparison shows that when scope creep or omission shifts, totals swing by over USD 200 million. By grounding our baseline in clearly stated inclusions, transparent variables, and yearly updates, Mordor offers decision-makers a dependable, traceable figure that neither overstates nor understates the real equipment opportunity.


Key Questions Answered in the Report
What is the current size of the laser cleaning market?
The laser cleaning market size is USD 1.01 billion in 2026 and is projected to reach USD 1.22 billion by 2031.
Which laser type holds the largest share?
Fiber lasers accounted for 46.18% of 2025 revenue because of high efficiency and lower maintenance.
Which application is growing fastest?
Microelectronics and precision cleaning is advancing at a 4.29% CAGR to 2031 as semiconductor fabs demand sub-nanometer cleanliness.
Which region will record the quickest growth?
The Middle East is set to grow at a 5.15% CAGR through 2031, buoyed by megaprojects and nuclear maintenance needs.
What is the main restraint to adoption?
High upfront cost for 1 kW-plus systems remains the largest barrier in developing economies.
How competitive is the supplier landscape?
The market is moderately concentrated, with the five largest vendors controlling just over 60% of revenue.
Page last updated on:


