Chelated Iron Agriculture Micronutrient Market Size and Share
Market Overview
| Study Period | 2020 - 2030 |
|---|---|
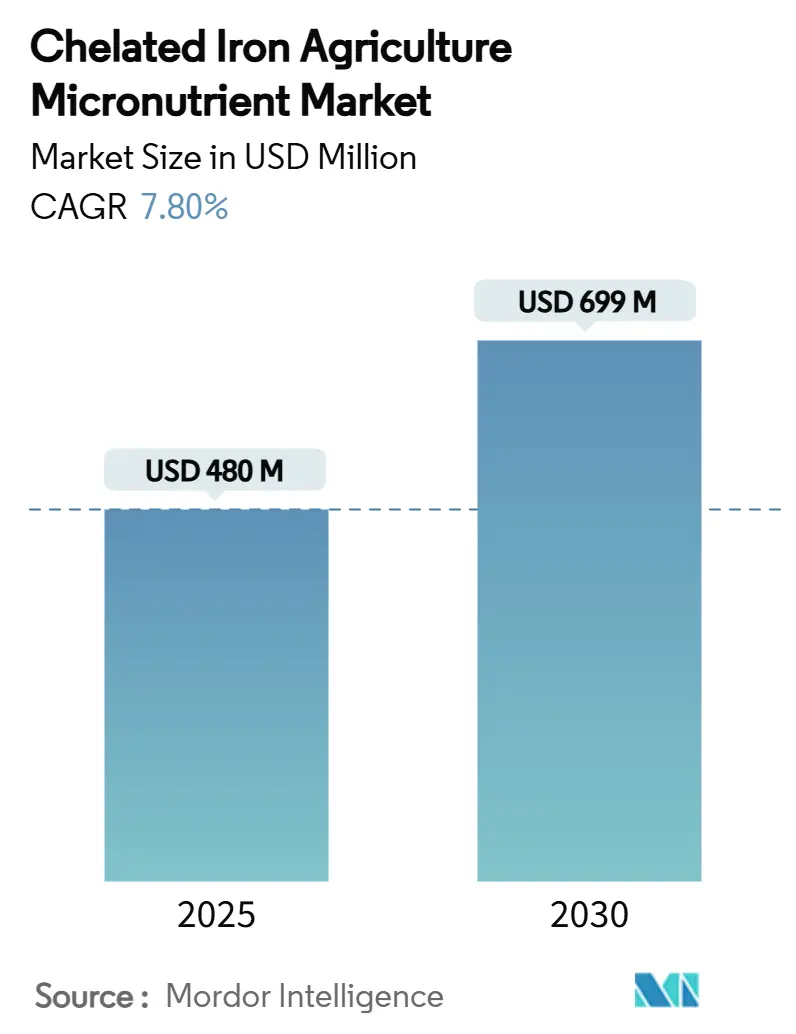
| Market Size (2025) | USD 480 Million |
| Market Size (2030) | USD 699 Million |
| Growth Rate (2025 - 2030) | 7.80% CAGR |
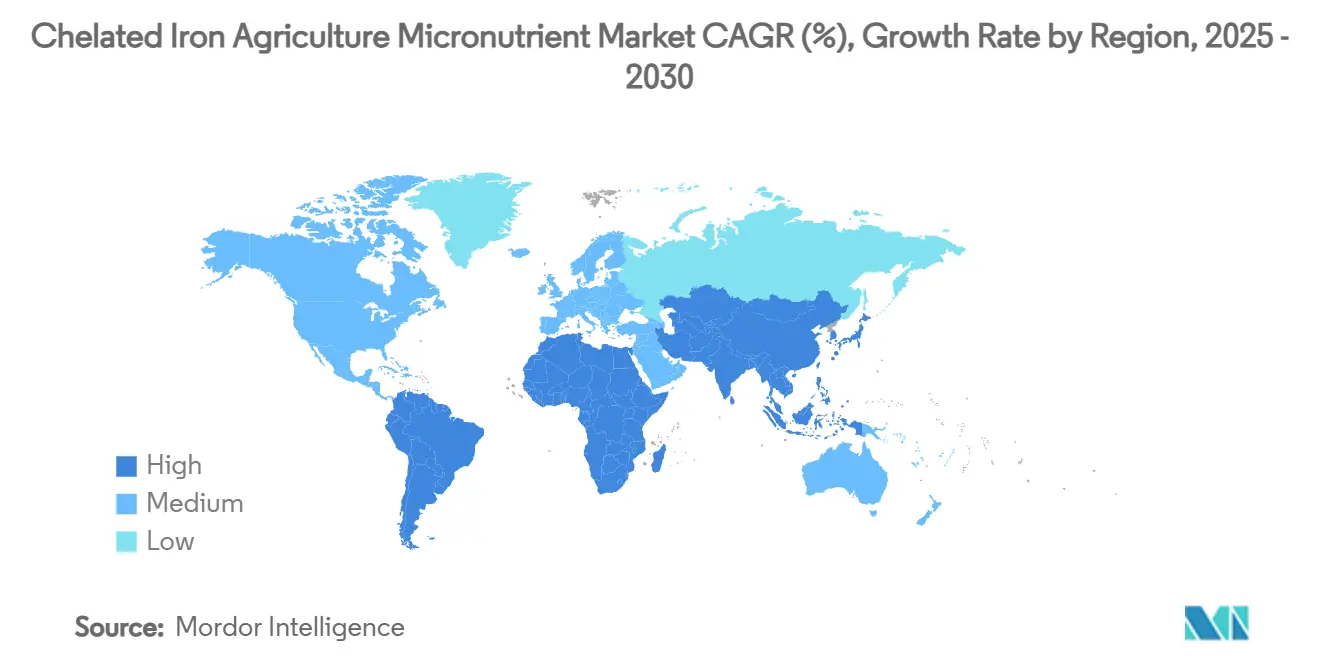
| Fastest Growing Market | Asia Pacific |
| Largest Market | North America |
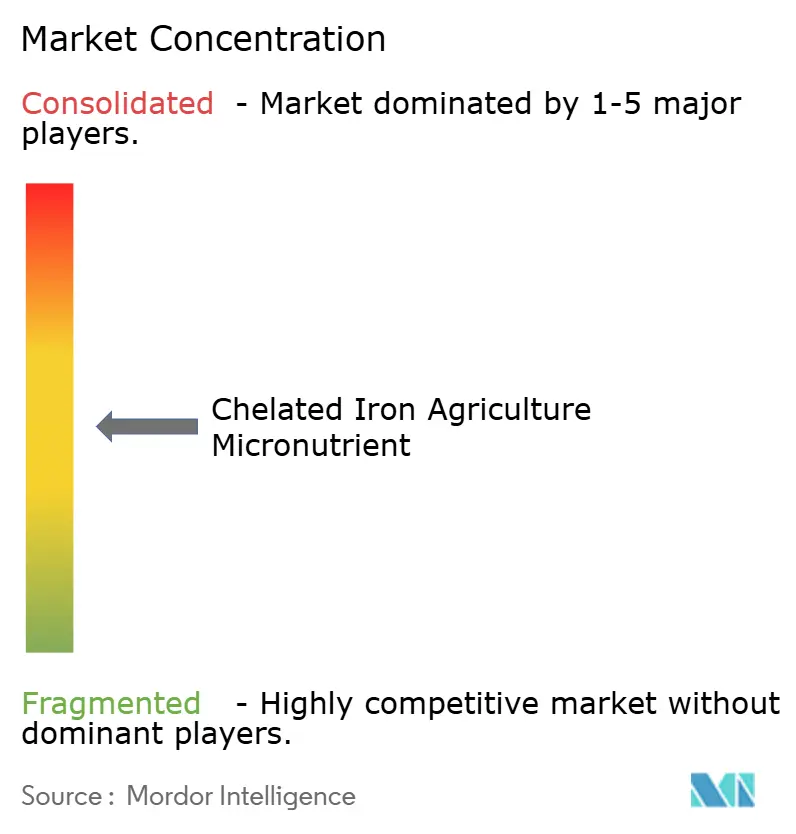
| Market Concentration | Medium |
Major Players *Disclaimer: Major Players sorted in no particular order Image © Mordor Intelligence. Reuse requires attribution under CC BY 4.0. | |
Chelated Iron Agriculture Micronutrient Market Analysis by Mordor Intelligence
The chelated iron agriculture micronutrient market size is valued at USD 480 million in 2025 and is forecast to reach USD 699 million by 2030, reflecting a sturdy 7.8% CAGR over the period. The expanding recognition that iron drives photosynthesis and chlorophyll synthesis propels the chelated iron agriculture micronutrient market, especially as Fe-EDDHA remains soluble at pH levels up to 14, thereby preserving its efficacy in alkaline soils. Precision fertigation, drip irrigation, and iron fortification mandates in staple crops jointly reinforce adoption, helping the chelated iron agriculture micronutrient market penetrate both high-value horticulture and large-scale cereal production. Asia-Pacific logs the fastest gains, recording a significant CAGR to 2030 on the back of subsidy-led fertilizer upticks in China, while North America secures the largest revenue share owing to mature sensor-based agriculture and strong greenhouse acreage. Competitive intensity remains moderate because innovation in biodegradable ligands and digital application tools enables both multinationals and regional specialists to defend positions, sustaining healthy rivalry throughout the chelated iron agriculture micronutrient market.
Key Report Takeaways
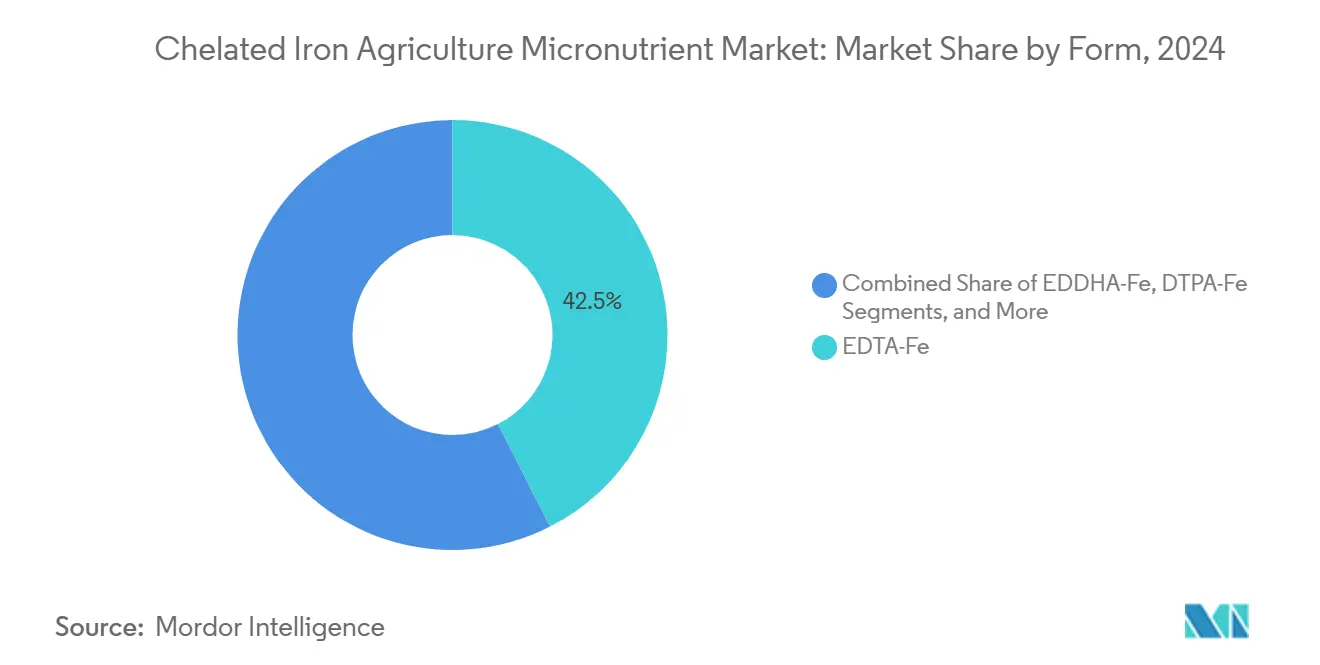
- By form, EDTA-Fe captured 42.5% of the chelated iron agriculture micronutrient market share in 2024, and the EDDHA-Fe is on track for a 9.8% CAGR through 2030.
- By crop type, cereals and grains accounted for 37% of the chelated iron agriculture micronutrient market size in 2024, and fruits and vegetables are advancing at an 8.9% CAGR over the same horizon.
- By application method, soil application held 51.2% share of the chelated iron agriculture micronutrient market size in 2024, while fertigation is expanding at a 10.7% CAGR to 2030.
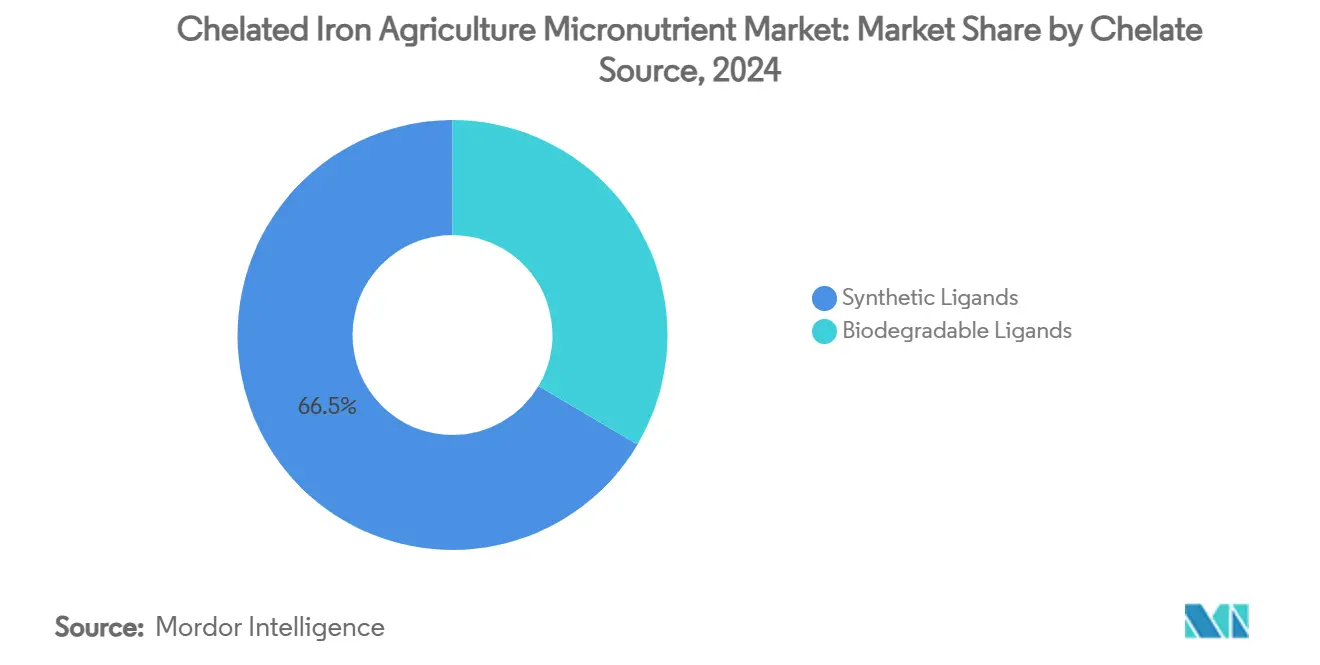
- By chelate source, synthetic ligands led with 66.5% revenue in 2024, and biodegradable ligands posted the quickest 11.1% CAGR through 2030.
- By geography, North America retained the highest revenue at 28.5% market share in 2024, and Asia-Pacific is forecast for an 8.6% CAGR to 2030.
- By company concentration, the top five players controlled 65% of the chelated iron agriculture micronutrient market share in 2024.
Global Chelated Iron Agriculture Micronutrient Market Trends and Insights
Drivers Impact Analysis*
| Driver | (~) % Impact on CAGR Forecast | Geographic Relevance | Impact Timeline |
|---|---|---|---|
| Spike in precision-fertigation adoption | +2.1% | Global, with early gains in North America and Europe | Medium term (2-4 years) |
| Government push for iron nutrition in staple crops | +1.8% | Asia-Pacifc core, spill-over to Africa and South America | Long term (≥ 4 years) |
| Compatibility with sustainable drip irrigation | +1.5% | Global, particularly water-stressed regions | Medium term (2-4 years) |
| Increasing controlled-environment agriculture acreage | +1.2% | North America and Europe, expanding to Asia-Pacific | Long term (≥ 4 years) |
| Rapid commercialization of EDDHA chelates in alkaline soils | +0.9% | Global, concentrated in alkaline soil regions | Short term (≤ 2 years) |
| Advances in biodegradable chelating ligands | +0.7% | Europe and North America, regulatory-driven | Long term (≥ 4 years) |
| Source: Mordor Intelligence | |||
Spike in Precision-Fertigation Adoption
Fertigation systems rely on fully water-soluble nutrients, and chelated iron prevents precipitation that would otherwise clog drip lines. IoT-enabled injectors now alter iron concentration per growth stage, enhancing uptake efficiency and reducing labor. More than 60% of new agricultural technology launches prioritize sensor-driven nutrient delivery. Consequently, the chelated iron agriculture micronutrient market benefits as premium input costs are offset by yield gains in high-value fruits and greenhouse vegetables. Precision application also minimizes waste, appealing to environmental stewardship programs globally.
Government Push for Iron Nutrition in Staple Crops
Mandatory iron fortification in staples such as rice and wheat establishes predictable micronutrient demand at the farm gate[1]Source: Philippine News Agency, “Ilocos Norte pushes adoption of iron-fortified rice,” pna.gov.ph. India embeds fortified grains into social safety nets, integrating agricultural inputs with public health objectives. OECD frameworks validate the economic case for in-field fortification over post-harvest supplementation[2]Source: OECD, “Regulatory Governance of Large-Scale Food Fortification,” oecd.org. Subsidies narrow price gaps between chelated and inorganic iron, improving farmer adoption in value-sensitive markets. National procurement contracts commit long-run volumes, stabilizing the chelated iron agriculture micronutrient market pipeline.
Compatibility with Sustainable Drip Irrigation
Water scarcity accelerates drip irrigation uptake, and chelated iron retains solubility across variable pressures, securing uninterrupted nutrient flow[3]Source: Agriculture and Horticulture Development Board, “Introduction to fertigation,” ahdb.org.uk . Renovated hillside drip systems save 35.3% in capital versus legacy configurations when pressure regulators and fertigation injectors combine. Government incentives for water efficiency link subsidy disbursements to precision nutrient application, driving multilayered demand. In arid regions, growers increasingly equate chelated iron usage with risk mitigation against chlorosis, reinforcing the chelated iron agriculture micronutrient market footprint.
Increasing Controlled-Environment Agriculture Acreage
Vertical farms and greenhouses yield up to 11 times traditional output, but intensified production depends on precise micronutrient delivery that chelated iron guarantees. Hydroponic solutions oscillate in pH, yet chelated iron remains bioavailable, preventing the rapid onset of chlorosis. Urban agribusiness and institutional investors back climate-independent food systems that favor premium nutrients. Rooftop greenhouses integrate renewable energy with closed-loop fertigation, creating niche demand for ultrapure chelate grades. This adds a specialized layer to the chelated iron agriculture micronutrient market, emphasizing quality over volume.
Restraints Impact Analysis*
| Restraint | (~) % Impact on CAGR Forecast | Geographic Relevance | Impact Timeline |
|---|---|---|---|
| High per-hectare cost versus inorganic iron salts | -1.4% | Global, particularly price-sensitive emerging markets | Short term (≤ 2 years) |
| Competition from multi-micronutrient blends | -0.8% | Global, concentrated in developed markets | Medium term (2-4 years) |
| Shelf-life challenges in hot climates | -0.6% | Tropical and subtropical regions | Short term (≤ 2 years) |
| Emerging eco-toxicity regulations on synthetic chelates | -1.1% | Europe and North America, expanding globally | Long term (≥ 4 years) |
| Source: Mordor Intelligence | |||
High Per-Hectare Cost Versus Inorganic Iron Salts
Chelated iron commands an 8–15 times premium over ferrous sulfate, straining budgets in low-margin cereal systems where micronutrient outlays can exceed 12% of total fertilizer spend. Growers typically calculate return on investment by dividing the additional cost per hectare by the projected yield lift. When commodity prices soften, the payback period can extend beyond two seasons, discouraging purchase. Input-credit programs and cooperative bulk buying partially offset sticker shock, but many smallholders still delay adoption until government subsidies arrive. Equipment that micro-doses chelates directly into the root zone lowers the applied rate by 20–30%, yet the savings are not always obvious at the retail counter. Breeding efforts for chlorosis-tolerant cultivars provide a biological hedge, though such varieties seldom eliminate the need for supplemental iron on high-pH soils. As a result, short-term demand elasticity remains high, keeping this cost gap a persistent drag on overall chelated iron agriculture micronutrient market growth.
Competition From Multi-Micronutrient Blends
Granular or liquid blends that package iron with zinc, manganese, and boron reduce labor by addressing multiple deficiencies in a single pass, tempting growers to abandon stand-alone chelates. These mixes often use lower-cost oxysulfate or oxide carriers, making the upfront price per unit of iron appear attractive, even when bioavailability is inferior. Field trials demonstrate that nutrient antagonism can reduce iron uptake by up to 25% when high-zinc blends are applied without precise balancing; yet, such subtleties are often overlooked in many purchasing decisions. Chelated iron suppliers now publish compatibility charts and offer digital tank-mix calculators to highlight yield penalties associated with generic blends, thereby attempting to preserve their market share. Retail agronomists increasingly segment recommendations, suggesting single-element chelated iron for chlorosis-prone crops, such as soybeans or citrus, while reserving blends for soils that test marginal across several micronutrients. The competition between convenience and agronomic precision will therefore continue to shape chelated iron agriculture micronutrient market dynamics through 2030.
*Our forecasts treat driver/restraint impacts as directional, not additive. The impact forecasts reflect baseline growth, mix effects, and variable interactions.
Segment Analysis
By Form: EDDHA-Fe Gains Ground in High-pH Fields
EDTA-Fe is a leading segment, accounting for a 42.5% share of the overall market revenue. EDDHA-Fe thrives as a grower with the fastest CAGR of 9.8%. The chelated iron agriculture micronutrient market size contribution from EDDHA is increasing rapidly, capturing market share from EDTA in Spain, Turkey, and the Midwestern United States. EDTA-Fe remains the global leader due to its cost advantage and versatility across a broad pH range. DTPA-Fe sits between the extremes, favored in horticulture where irrigated soils hover near pH 6.5. IDHA-Fe enters premium channels in greenhouse lettuce because it meets organic certification and biodegrades swiftly. Research on Fe-EDDHSA indicates better photostability than classic EDDHA, suggesting potential upgrades to next-generation products. Suppliers, therefore, segment portfolios by soil chemistry, ensuring each agronomic scenario funnels to the most compatible chelate, which expands overall addressable sales.
A second trend elevates liquid formulations over granules. Liquids integrate seamlessly with fertigation and foliar rigs, while granules still hold sway in broad-acre cereals where uniformity and logistics favor bulk spreading. Packaging downsizes to 5-liter returnable drums for greenhouse users, and 20-kilogram bags remain standard for row crops. Technical service teams translate laboratory stability data into field protocols, enhancing confidence among agronomists and frontline retailers. Collectively, these strategies strengthen the linkage with precision agriculture, reinforcing brand stickiness and expanding the chelated iron agriculture micronutrient market.


By Crop Type: Cereals Dominate Yet Horticulture Accelerates
Cereals and Grains continue to anchor the majority share of 37% because iron fortification policies target staples like rice and wheat. Governments procure iron-sufficient grain for social programs, directly boosting chelated iron agriculture micronutrient market demand in India, the Philippines, and Egypt. Cereal growers embrace soil applications, the lowest cost pathway to broad-acre coverage, stabilizing baseline consumption.
Conversely, fruits and vegetables generate the fastest revenue at 8.9% CAGR owing to higher margins per hectare and the sensitivity of produce quality to iron status. Protected cultivation in tomatoes, peppers, and leafy greens deploys fertigation, creating repeat purchases of chelated solutions. Oilseeds and pulses sustain steady growth because nitrogen fixation in legumes intensifies iron needs, a fact highlighted in extension bulletins that guide farmers toward calibrated iron supplementation. Ornamental turf blends integrate chelated iron for aesthetic greening in stadium lawns and golf courses, carving a reliable niche. Crop-specific formulations, such as high-purity Fe-EDDHA for hydroponic lettuce or granular EDTA for wheat, diversify offerings and strengthen the chelated iron agriculture micronutrient market presence across production systems.
By Application Method: Fertigation Surges while Soil Application Holds Majority Stake
Soil application remains ubiquitous because of simplicity and low equipment hurdles, preserving a 51.2% share of the chelated iron agriculture micronutrient market size in 2024. It suits large cereal acreages where operating windows are narrow. The fertigation posts a 10.7% CAGR as drip and pivot systems spread, especially in Israel, California, and parts of China. Foliar spray finds renewed relevance in orchards where rapid green-up is paramount and tank mixes already schedule multiple passes.
Automation shapes demand patterns. Sensors linked to cloud dashboards alert growers to early chlorosis, triggering micro-dosing via irrigation lines. Service providers bundle hardware leasing with nutrient subscription kits that include chelated iron, locking customers into long-term contracts. This ecosystem embeds chelated iron agriculture micronutrient market solutions deeply within precision farming workflows, hedging against commoditization.
By Chelate Source: Sustainability Shifts Favor toward Biodegradable Ligands
Synthetic ligands retain dominance with a 66.50% share through entrenched manufacturing networks and proven agronomic outcomes. The biodegradable ligands grow faster at 11.1% CAGR because regulatory and branding forces converge on eco-toxicity mitigation. GLDA and IDHA production capacity rose 22% in 2024 as European plants scaled operations. Initial 15% price premiums over EDTA narrowed to 8% by early 2025, unlocking adoption in mainstream horticulture.
The chelated iron agriculture micronutrient market sees specialty seed companies promoting ligand-aligned seed coatings that synchronize chelate release with root emergence. Suppliers emphasize reduced heavy-metal mobilization, an advantage in crops destined for baby food or organic certification. Certification bodies now include ligand degradation profile in audit checklists, further nudging users toward biodegradable options. Innovation momentum signals that by 2030, biodegradable ligands could claim one-quarter of segment revenue, transforming material flows across the market.
Geography Analysis
North America leads global revenue at 28.5% in 2024, courtesy of widespread sensor networks, advanced fertigation, and significant alkaline soils in the Corn Belt. The United States channels chelated iron to over 6 million acres of corn and soybeans, where pH often surpasses 7.5. Canadian greenhouse operators opt for ultra-pure Fe-EDDHA for hydroponic cucumbers and peppers, contributing to the national controlled-environment acreage reaching nearly 1,800 hectares by 2025. Public–private alliances, such as the Bunge and Nutrien program, incentivize regenerative practices by bundling chelated iron with carbon-efficient fertilizer packages. The region’s shows a significant CAGR stems from continuous tech upgrades and integrator-driven service models that embed micronutrients within digital agronomy platforms.
Asia-Pacific posts the fastest CAGR at 8.6%. China’s subsidy reform led to a 5–6% increase in fertilizer spending, with provinces such as Shandong issuing specific guidance on iron chelate rates for apple orchards. India links iron biofortification objectives with balanced fertilization, sending strong demand signals through state procurement channels. Australia’s greenhouse vegetable exports rely on consistent iron nutrition to maintain color and shelf life, which encourages the adoption of fertigation-grade chelates. Japan promotes vertical farm clusters in urban districts, featuring real-time nutrient analytics that default to chelated iron for stability under variable recirculating pH.
Europe advances at a rapid CAGR, guided by strict environmental stewardship. Germany and France are running pilot carbon farming projects that compensate growers for verified nutrient efficiency gains using chelated inputs. Spain’s high-value greenhouse tomatoes rely heavily on Fe-EDDHA through precision drip irrigation, counteracting the constraints of calcareous soil. REACH compliance propels investment in biodegradable ligands, with Italian specialty producers launching GLDA-based lines in 2025. The region supports robust knowledge exchange networks, ensuring rapid diffusion of best practices.

Competitive Landscape
The chelated iron agriculture micronutrient market is moderately concentrated, with the top five suppliers controlling 65% of revenue. Yara International ASA commands the most prominent share through extensive distribution and digital agronomy tools that incorporate tissue testing to recommend dosage. Israel Chemicals Ltd. (ICL) leverages vertically integrated phosphate and bromine operations to maintain cost competitiveness while hosting a 50-person research and development unit dedicated to ligand innovation.
Strategic differentiation now hinges on chemistry plus application compatibility. Patent activity for bio-inspired iron chelators increased 14% year-on-year in 2024, reflecting a pipeline crowded with peptide-based ligands that emulate microbial siderophores. Partnerships bridge agritech and micronutrient expertise; Syngenta teams with Intrinsyx Bio to co-develop microbial endophytes that synergize with chelated iron, extending root uptake efficiency. Regional players exploit proximity and tailored service to defend niches where large multinationals have limited presence.
Entrance barriers remain high. Production requires stainless equipment, controlled atmosphere reactions, and stringent quality tracking. Coupled with regulatory approvals for fertilizer registration, these hurdles deter opportunistic entrants. Nonetheless, biotech startups eye microbial alternatives that solubilize native soil iron, potentially disrupting synthetic chelate demand over the long haul. Established players hedge through venture investments in biological platforms. Marketing increasingly pivots around sustainability badges and digital advisory portals, reinforcing brand loyalty and extracting value beyond tonnage, which sustains robust margin profiles in the chelated iron agriculture micronutrient market.
Chelated Iron Agriculture Micronutrient Industry Leaders
Yara International ASA
BASF SE
Haifa Group
Nouryon Holding B.V.
Syngenta Group
- *Disclaimer: Major Players sorted in no particular order

Recent Industry Developments
- January 2025: Syngenta and Intrinsyx Bio announced a collaboration to deliver biological solutions that enhance nutrient uptake efficiency, including iron, in greenhouse crops.
- January 2025: Koch Agronomic Services completed its acquisition of Compass Minerals’ North American micronutrient assets, broadening chelated iron reach across key grower hubs.


Global Chelated Iron Agriculture Micronutrient Market Report Scope
| EDTA-Fe |
| EDDHA-Fe |
| DTPA-Fe |
| IDHA-Fe |
| Cereals and Grains |
| Fruits and Vegetables |
| Oilseeds and Pulses |
| Turf and Ornamentals |
| Soil Application |
| Fertigation |
| Foliar Spray |
| Synthetic Ligands |
| Biodegradable Ligands |
| North America | United States |
| Canada | |
| Rest of North America | |
| South America | Brazil |
| Argentina | |
| Rest of South America | |
| Europe | Germany |
| France | |
| Spain | |
| Italy | |
| United Kingdom | |
| Russia | |
| Rest of Europe | |
| Asia-Pacific | China |
| India | |
| Japan | |
| Australia | |
| Rest of Asia-Pacific | |
| Middle East | Saudi Arabia |
| Turkey | |
| Rest of Middle East | |
| Africa | South Africa |
| Egypt | |
| Rest of Africa |
| By Form | EDTA-Fe | |
| EDDHA-Fe | ||
| DTPA-Fe | ||
| IDHA-Fe | ||
| By Crop Type | Cereals and Grains | |
| Fruits and Vegetables | ||
| Oilseeds and Pulses | ||
| Turf and Ornamentals | ||
| By Application Method | Soil Application | |
| Fertigation | ||
| Foliar Spray | ||
| By Chelate Source | Synthetic Ligands | |
| Biodegradable Ligands | ||
| By Geography | North America | United States |
| Canada | ||
| Rest of North America | ||
| South America | Brazil | |
| Argentina | ||
| Rest of South America | ||
| Europe | Germany | |
| France | ||
| Spain | ||
| Italy | ||
| United Kingdom | ||
| Russia | ||
| Rest of Europe | ||
| Asia-Pacific | China | |
| India | ||
| Japan | ||
| Australia | ||
| Rest of Asia-Pacific | ||
| Middle East | Saudi Arabia | |
| Turkey | ||
| Rest of Middle East | ||
| Africa | South Africa | |
| Egypt | ||
| Rest of Africa | ||


Key Questions Answered in the Report
What is the projected size of the chelated iron agriculture micronutrient market by 2030?
The chelated iron agriculture micronutrient market size is anticipated to reach USD 699 million by 2030.
Which segment is growing fastest within the market?
Fertigation registers the fastest growth at a 10.7% CAGR as drip irrigation expands globally.
Why is EDDHA-Fe preferred in alkaline soils?
Fe-EDDHA stays soluble up to pH 14, preventing iron precipitation and ensuring reliable uptake in calcareous fields.
How are regulations influencing product development?
European eco-toxicity scrutiny of EDTA accelerates investment in biodegradable ligands like GLDA and IDHA, reshaping product pipelines.
Which region offers the most attractive growth outlook?
Asia-Pacific leads with an 8.6% CAGR, driven by China’s fertilizer subsidy reforms and escalating protected cultivation.
What strategic moves define the competitive landscape?
Key moves include Koch Agronomic Services’ acquisition of Compass Minerals’ micronutrient assets and Syngenta’s partnership with Intrinsyx Bio to integrate microbial efficiency solutions with chelated iron products.
Page last updated on:


