Market Overview
| Study Period | 2021 - 2031 |
|---|---|
| Forecast Data Period | 2026 - 2031 |
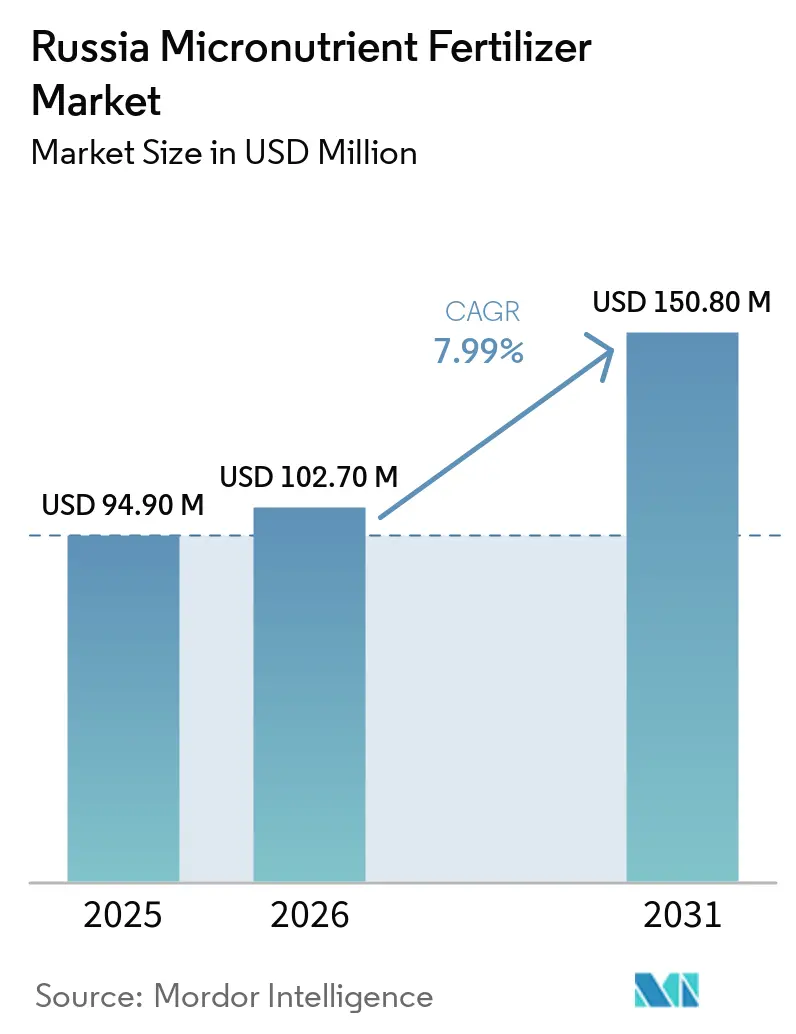
| Base Year Market Size (2025) | USD 94.90 Million |
| Market Size (2026) | USD 102.70 Million |
| Market Size (2031) | USD 150.80 Million |
| Growth Rate (2026 - 2031) | 7.99% CAGR |
| Market Concentration | Low |
Major Players *Disclaimer: Major Players sorted in no particular order Image © Mordor Intelligence. Reuse requires attribution under CC BY 4.0. | |
Russia Micronutrient Fertilizer Market Analysis by Mordor Intelligence
The Russia micronutrient fertilizer market size was valued at USD 94.90 million in 2025, is estimated to reach USD 102.70 million in 2026, and is projected to grow to USD 150.80 million by 2031, registering a CAGR of 7.99% during 2026–2031. Rising soil-micronutrient depletion across the nation’s most productive Chernozem belts, combined with federal subsidies that favor domestic trace-blend capacity, underpin the steady expansion. Import-substitution policies introduced after 2024 sanctions have spurred local chelate production, cushioning the sector against ruble volatility and shipping disruptions. Rapid adoption of precision foliar feeding by top agro-holdings, coupled with the ongoing shift toward oilseeds that respond strongly to zinc and boron, further amplifies demand. Nevertheless, logistics constraints beyond the Urals and low awareness among smallholders temper the overall momentum.
Key Report Takeaways
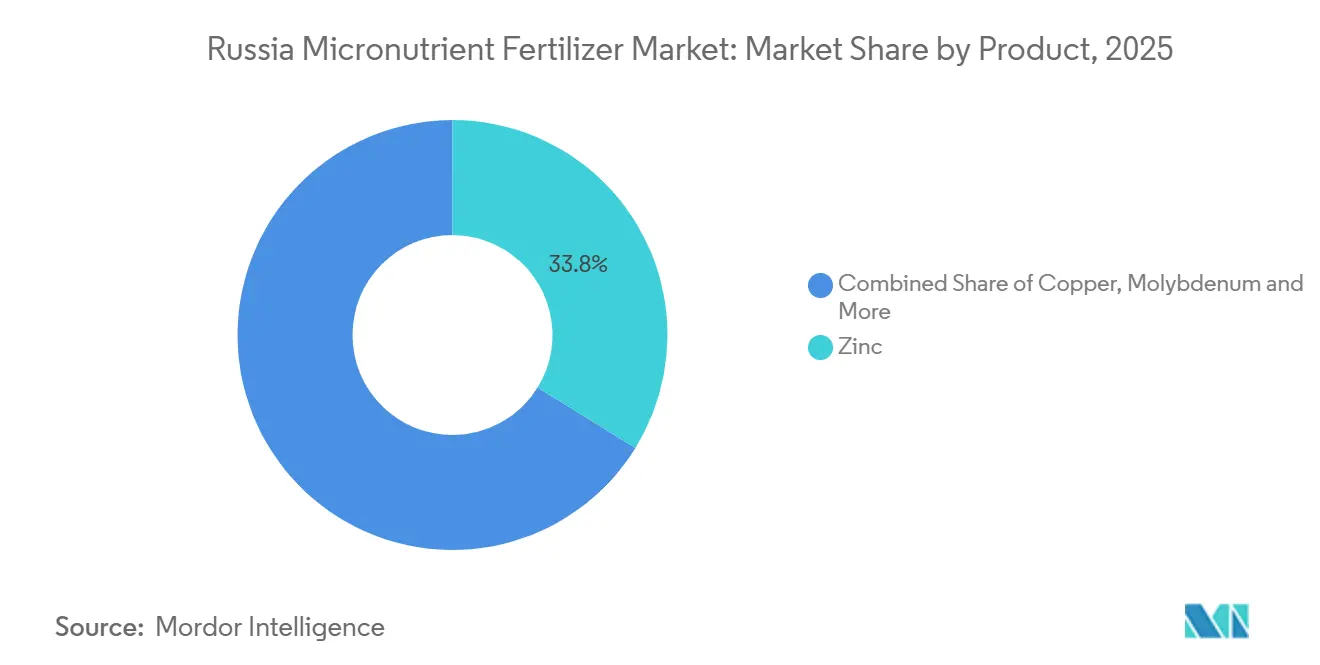
- By product category, zinc held the largest share of the Russia micronutrient fertilizer market, accounting for 33.8% in 2025, while molybdenum is projected to be the fastest-growing segment, expanding at a CAGR of 9.1% during 2026 to 2031.
- By application mode, soil application represented the largest segment of the Russia micronutrient fertilizer market with a 52.9% share in 2025, whereas fertigation is forecast to register the highest growth rate, advancing at a CAGR of 8.8% during 2026 to 2031.
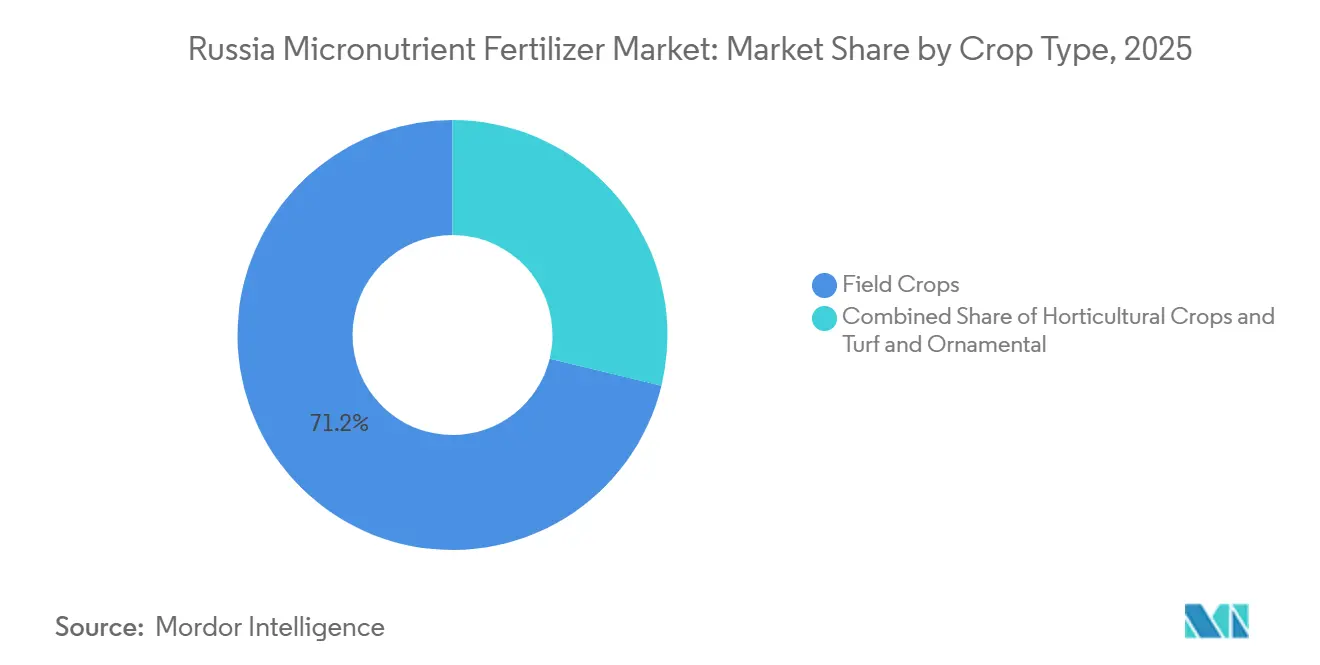
- By crop type, field crops accounted for the largest Russia micronutrient fertilizer market size in 2025, representing 71.2% of the market, while horticultural crops are projected to be the fastest-growing segment, registering a CAGR of 8.9% during 2026–2031.
Note: Market size and forecast figures in this report are generated using Mordor Intelligence’s proprietary estimation framework, updated with the latest available data and insights as of January 2026.
Russia Micronutrient Fertilizer Market Trends and Insights
Drivers Impact Analysis*
| Driver | ( ~ ) % Impact on CAGR Forecast | Geographic Relevance | Impact Timeline |
|---|---|---|---|
| Soil-micronutrient depletion in intensive grain belts | 1.20% | Central Chernozem, and Volga District | Medium term (2-4 years) |
| Federal subsidies for domestic fertilizer expansion | 0.80% | National; Perm Krai and Novgorod Oblast hubs | Long term (≥ 4 years) |
| Rapid shift to chelated formulations for acidic Chernozem soils | 0.70% | Central and Southern Districts | Short term (≤ 2 years) |
| Foliar micro-feeding adoption by top grain holdings | 0.50% | Nationwide large farms | Medium term (2-4 years) |
| Sunflower and soybean acreage boom | 0.60% | Krasnodar, Rostov, and Volgograd | Short term (≤ 2 years) |
| Import-substitution policy spurs local micronutrient manufacturing | 0.90% | National; Urals and Central plants | Long term (≥ 4 years) |
| Source: Mordor Intelligence | |||


Soil-Micronutrient Depletion in Intensive Grain Belts
Central Chernozem provinces report that 55% of arable plots test below critical zinc, boron, and copper thresholds after decades of high-output wheat rotations[1]A. Ivanov, “Soil-Micronutrient Depletion in Intensive Grain Belts,” BIO Web of Conferences, bio-conferences.org. Yield plateaus on these degraded soils have sparked broad farmer interest in corrective micronutrient blends that can restore grain output by 12-15%. Regional soil-testing campaigns, funded partly by oblast budgets, now supply actionable deficiency maps to agronomists. The financial case for remediation strengthens whenever grain prices rise, because a 1 ton per hectare yield gain offsets the added fertilizer cost several times over. As a result, specialized distributors that tailor copper-zinc packages for local soil profiles gain a competitive edge.
Federal Subsidies for Domestic Fertilizer Expansion
A 50% capital-expenditure refund program reimburses new chelate and trace-blend projects, aiming to increase annual output by 2031. Subsidies shorten payback periods and favor firms with full distribution networks, thereby accelerating consolidation. Beyond plant construction, the policy funnels funds to lab services and process automation, enhancing local quality control. By tying disbursements to domestic-content rules, the government also shields the Russia micronutrient fertilizer market from import shocks.
Rapid shift to chelated formulations for acidic Chernozem soils
On soils with a pH below 6.0, EDTA and DTPA chelates deliver 5-8% sunflower yield gains over sulfate salts[2].Research Team, “Chelated Formulations Trial Results,” e3s-conferences.org. Such efficacy persuades farmers to pay the 20-30% price premium tied to chelated products. As acidification spreads in southern districts, driven by intensive cultivation and ammonium-based fertilization, demand for chelates surpasses 12% annual growth among large holdings. Domestic chemical firms have begun pilot syntheses of EDTA to cut reliance on dollar-denominated imports, a move projected to trim cost volatility. Meanwhile, agronomic institutes publish case studies showcasing chelate ROI, fostering rapid know-how diffusion.
Sunflower and Soybean Acreage Boom
Oilseed hectares in Krasnodar, Rostov, and Volgograd swelled by 1 million between 2024 and 2025, driving a 7% annual uptick in zinc and boron consumption[3]Federal State Statistics Service, “Oilseed Acreage Statistics,” rosstat.gov.ru. Profitability of sunflower oil exports and soybean contracts with Asian processors pushes growers to fine-tune micronutrient programs that lift oil content and protein. Field trials show yield penalties of up to 25% on uncorrected zinc-deficient soils. Distributors concentrate storage and bulk-delivery assets in these southern hubs, leveraging dense demand pockets. The boom diversifies regional fertilizer sales away from a wheat-centric profile, supporting balanced product portfolios.
Restraints Impact Analysis*
| Restraint | ( ~ ) % Impact on CAGR Forecast | Geographic Relevance | Impact Timeline |
|---|---|---|---|
| Ruble volatility inflates EDTA and DTPA input costs | -0.60% | Nationwide producers | Short term (≤ 2 years) |
| Low awareness and price sensitivity among small & mid-size farms | -0.80% | Rural farms under 1,000 ha | Medium term (2-4 years) |
| Logistics bottlenecks for liquid micronutrients into Siberia & Far East | -0.40% | Siberian and Far Eastern districts | Long term (≥ 4 years) |
| Stricter EAEU heavy-metal limits | -0.30% | Cross-border trade | Medium term (2-4 years) |
| Source: Mordor Intelligence | |||
Ruble Volatility Inflates EDTA and DTPA Input Costs
A 20% ruble slide in 2024 pushed landed EDTA prices up 18%, slicing margins at chelate formulators[4] Central Bank of Russia, “Currency Market Review,” cbr.ru. Companies face limited hedging tools due to restricted access to Western currency markets, forcing either price pass-through or margin sacrifice. Some shift to yuan-linked imports, but that only splits rather than removes currency risk. Finance teams now forecast shorter budgeting cycles, impeding multi-year investment planning. Downstream distributors respond by stockpiling during ruble peaks, amplifying inventory swings. Until domestic chelating agent plants hit scale, currency gyrations remain a critical drag on profitability.
Low Awareness and Price Sensitivity Among Small and Mid-Size Farms
Less than 30% of farms under 1,000 hectares conduct soil micronutrient tests, hindering adoption despite evident yield improvements. Extension services struggle with sparse rural coverage, leaving many growers unaware of latent deficiencies. Even when informed, tight cash flows make specialty inputs appear discretionary, especially after weather shocks. Fertilizer firms have launched demo plots and mobile soil-lab vans, but scaling such outreach is costly. Cooperative purchasing could help pool demand, yet governance hurdles hinder widespread uptake. Without deeper policy or credit support, this segment remains a growth bottleneck.
*Our forecasts treat driver/restraint impacts as directional, not additive. The impact forecasts reflect baseline growth, mix effects, and variable interactions.
Segment Analysis
By Product: Zinc Leads Market Demand While Molybdenum Accelerates Growth
Zinc accounted for 33.8% of the Russia micronutrient fertilizer market share in 2025, establishing its position as the leading product category. Strong adoption across grain and oilseed production systems, particularly in regions with nutrient-deficient soils, continues to support demand. Copper remains a significant segment within the market, reflecting its importance in crop nutrition and disease management across wheat, sunflower, and other field crops. Iron maintains steady demand, particularly where chelated formulations are required to improve nutrient availability. Boron supports reproductive development in horticultural and oilseed crops, while manganese is gaining traction through targeted foliar nutrition programs designed to optimize crop performance.
Molybdenum’s 9.1% CAGR during 2026 to 2031 outpaces all peers, due to its critical role in nitrogen metabolism and enzyme activation in legumes. With the expansion of soybean cultivation and the growing adoption of biological nitrogen fixation, molybdenum usage has risen significantly. As precision agronomy scales, product portfolios diversify, cementing room for niche micronutrients within the broader Russia micronutrient fertilizer market.


By Application Mode: Soil Application Leads, Fertigation Accelerates
Soil application captured 52.9% of the Russia micronutrient fertilizer market share in 2025, making it the largest application segment. Its primacy stems from compatibility with conventional spreaders and low technical barriers, allowing granular blends to piggyback on existing NPK distribution. Foliar spraying holds a smaller share but is gaining relevance among progressive growers adopting drone-based systems and liquid formulations optimized for rapid tissue uptake and stress recovery.
Fertigation posts a robust 8.8% CAGR during 2026 to 2031, driven by the introduction of new drip and center-pivot systems in high-value vegetable clusters. Precise nutrient delivery through irrigation lines minimizes leaching, thereby increasing use efficiency and enhancing environmental compliance. As farm consolidation continues and technology costs fall, the Russia micronutrient fertilizer market size for fertigation and foliar formats is projected to widen, gradually eroding granular dominance while maintaining overall product value balance.
By Crop Type: Field Crops Sustain Market Foundation
Field crops accounted for the largest share of the Russia micronutrient fertilizer market, representing 71.2% in 2025, reflecting the country's extensive cultivation of wheat, sunflower, and soybean across its vast agricultural landscape. Yield-oriented nutrient management practices on these large-acreage crops support consistent demand for micronutrient fertilizers, particularly products used to address zinc and copper deficiencies.
Horticultural crops represented a smaller but expanding segment, supported by greenhouse vegetable production and orchard modernization, while turf and ornamental applications remained concentrated in urban landscaping and sports facilities. Horticultural crops are projected to be the fastest-growing segment, registering a CAGR of 8.9% during 2026–2031. Growth is driven by increasing investments in protected cultivation, precision fertigation systems, and higher-value crop production. Meanwhile, turf and ornamental applications are anticipated to expand steadily as spending on municipal green spaces, landscaping projects, and recreational infrastructure continues to increase across major urban centers.
Geography Analysis
The Central Federal District tops national consumption due to dense grain belts and proximity to ports that ease import logistics. Degraded Chernozem soils here create the largest addressable deficit for copper and zinc, and extensive agro-holding presence accelerates precision application uptake. The Southern Federal District trails slightly yet posts similar volume thanks to sunflower and soybean expansion that demands boron and zinc additions for oil and protein quality.
Volga growers embrace micronutrients as part of modernization schemes, lifting penetration on mixed crop-livestock farms. Conversely, Siberia and the Far East suffer from freight costs that add USD 15–20 per t to liquid deliveries, depressing chelate usage despite vast arable tracts. Nonetheless, Chinese demand for Far Eastern soybeans offers a future pull that may validate terminal investment. Northwestern districts’ potato and vegetable focus supports intensive micronutrient programs, offsetting smaller acreage through higher application rates. Taken together, regional diversity shapes a Russia micronutrient fertilizer market that clusters around soil degradation hot-spots and logistics corridors.
Competitive Landscape
High fragmentation characterizes the Russia micronutrient fertilizer market, where the top five suppliers hold only a small combined share. Yara leads thanks to embedded agronomic support and broad SKU coverage. ICL Group’s position reflects leverage of integrated phosphate streams for specialty blends, while EuroChem’s strength results from domestic output and nationwide warehouses.
Strategy revolves around vertical integration and advisory services. EuroChem deploys mobile soil labs that upsell tailored solutions. Domestic entrants such as UralChem exploit import-substitution momentum to undercut foreign price points while meeting EAEU quality rules. Technology alliances emerge, exemplified by Acron Group’s memorandum with Haldor Topsoe to embed low-carbon process routes. Consolidation prospects rise as regulatory compliance costs mount, positioning capital-rich firms to absorb niche specialists and expand the Russia micronutrient fertilizer market footprint into underserved eastern zones.
Russia Micronutrient Fertilizer Industry Leaders
Yara
ICL Group Ltd
EuroChem Group
J.M. Huber Corporation (Biolchim SPA)
Mivena
- *Disclaimer: Major Players sorted in no particular order


Recent Industry Developments
- September 2024: The launch of Russia's new Ozernoye zinc plant enhances domestic production capabilities. The plant, projected to reach full capacity in 2025, will process up to 6 million tons of zinc ore, producing 600,000 metric tons of concentrate with 53% zinc content. The increased domestic supply from Ozernoye supports the production of zinc-enriched fertilizer. This development positions Russia to play a more significant role in the global micronutrient fertilizer market as zinc shortages intensify elsewhere, particularly in key importing countries like China.
- February 2024: PhosAgro's collaboration with the United Nations Food and Agriculture Organization (FAO) Global Soil Partnership supports soil assessment and sustainable soil management practices, benefiting thousands of farmers in Russia and worldwide. The initiative implements soil recarbonization measures to enhance soil health and fertility. The improved soil conditions support soil laboratory development and farmer training, increasing awareness and adoption of micronutrient fertilizers in Russia.
- December 2024: Russia's fertilizer production exceeded 63 million metric tons in 2024, representing a 6-7% increase from the previous year, while exports achieved a record 40 million metric tons, with Asian shipments increasing by 60% year-on-year, according to the Russian Fertilizer Producers Association (RAPU). The ongoing investment and construction programs extending into 2025 enhance Russia's fertilizer production capacity and support micronutrient fertilizer development.


Russia Micronutrient Fertilizer Market Report Scope
The Russia Micronutrient Fertilizer Market is Segmented by Product (Boron, Copper, Iron, Manganese, Molybdenum, Zinc, and Others), by Application Mode (Fertigation, Foliar, and Soil), and by Crop Type (Field Crops, Horticultural Crops, and Turf and Ornamental). The Report Offers Market Size in Both Market Value (USD) and Market Volume (Tons).
By Product
| Boron |
| Copper |
| Iron |
| Manganese |
| Molybdenum |
| Zinc |
| Others |
By Application Mode
| Fertigation |
| Foliar |
| Soil |
By Crop Type
| Field Crops |
| Horticultural Crops |
| Turf and Ornamental |
| By Product | Boron |
| Copper | |
| Iron | |
| Manganese | |
| Molybdenum | |
| Zinc | |
| Others | |
| By Application Mode | Fertigation |
| Foliar | |
| Soil | |
| By Crop Type | Field Crops |
| Horticultural Crops | |
| Turf and Ornamental |


Market Definition
- MARKET ESTIMATION LEVEL - Market Estimations for various types of fertilizers has been done at the product-level and not at the nutrient-level.
- NUTRIENT TYPES COVERED - Micronutients: Zn, Mn, Cu, Fe, Mo, B, and Others
- AVERAGE NUTRIENT APPLICATION RATE - This refers to the average volume of nutrient consumed per hectare of farmland in each country.
- CROP TYPES COVERED - Field Crops: Cereals, Pulses, Oilseeds, and Fiber Crops Horticulture: Fruits, Vegetables, Plantation Crops and Spices, Turf Grass and Ornamentals
| Keyword | Definition |
|---|---|
| Fertilizer | Chemical substance applied to crops to ensure nutritional requirements, available in various forms such as granules, powders, liquid, water soluble, etc. |
| Specialty Fertilizer | Used for enhanced efficiency and nutrient availability applied through soil, foliar, and fertigation. Includes CRF, SRF, liquid fertilizer, and water soluble fertilizers. |
| Controlled-Release Fertilizers (CRF) | Coated with materials such as polymer, polymer-sulfur, and other materials such as resins to ensure nutrient availability to the crop for its entire life cycle. |
| Slow-Release Fertilizers (SRF) | Coated with materials such as sulfur, neem, etc., to ensure nutrient availability to the crop for a longer period. |
| Foliar Fertilizers | Consist of both liquid and water soluble fertilizers applied through foliar application. |
| Water-Soluble Fertilizers | Available in various forms including liquid, powder, etc., used in foliar and fertigation mode of fertilizer application. |
| Fertigation | Fertilizers applied through different irrigation systems such as drip irrigation, micro irrigation, sprinkler irrigation, etc. |
| Anhydrous Ammonia | Used as fertilizer, directly injected into the soil, available in gaseous liquid form. |
| Single Super Phosphate (SSP) | Phosphorus fertilizer containing only phosphorus which has lesser than or equal to 35%. |
| Triple Super Phosphate (TSP) | Phosphorus fertilizer containing only phosphorus greater than 35%. |
| Enhanced Efficiency Fertilizers | Fertilizers coated or treated with additional layers of various ingredients to make it more efficient compared to other fertilizers. |
| Conventional Fertilizer | Fertilizers applied to crops through traditional methods including broadcasting, row placement, ploughing soil placement, etc. |
| Chelated Micronutrients | Micronutrient fertilizers coated with chelating agents such as EDTA, EDDHA, DTPA, HEDTA, etc. |
| Liquid Fertilizers | Available in liquid form, majorly used for application of fertilizers to crops through foliar and fertigation. |


Research Methodology
Mordor Intelligence follows a four-step methodology in all our reports.
- Step-1: IDENTIFY KEY VARIABLES: In order to build a robust forecasting methodology, the variables and factors identified in Step-1 are tested against available historical market numbers. Through an iterative process, the variables required for market forecast are set and the model is built on the basis of these variables.
- Step-2: Build a Market Model: Market-size estimations for the forecast years are in nominal terms. Inflation is not a part of the pricing, and the average selling price (ASP) is kept constant throughout the forecast period for each country.
- Step-3: Validate and Finalize: In this important step, all market numbers, variables and analyst calls are validated through an extensive network of primary research experts from the market studied. The respondents are selected across levels and functions to generate a holistic picture of the market studied.
- Step-4: Research Outputs: Syndicated Reports, Custom Consulting Assignments, Databases & Subscription Platforms


