Europe Micronutrient Fertilizers Market Size and Share
Market Overview
| Study Period | 2021 - 2031 |
|---|---|
| Forecast Data Period | 2026 - 2031 |
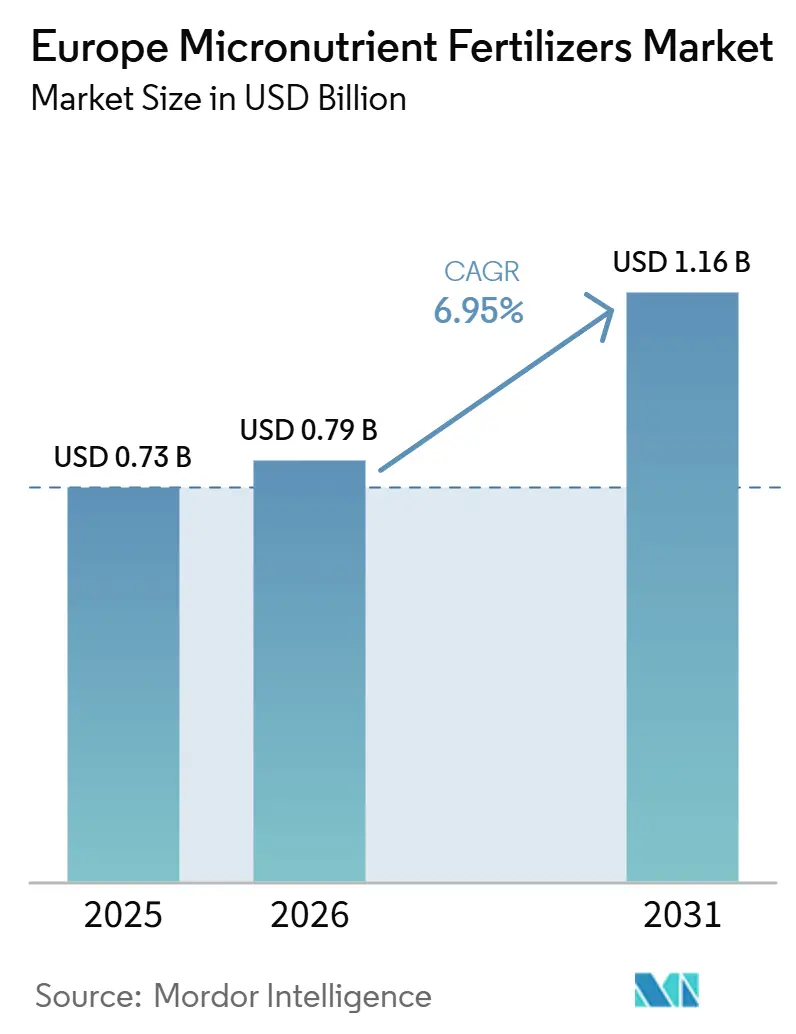
| Base Year Market Size (2025) | USD 0.73 Billion |
| Market Size (2026) | USD 0.79 Billion |
| Market Size (2031) | USD 1.16 Billion |
| Growth Rate (2026 - 2031) | 6.95% CAGR |
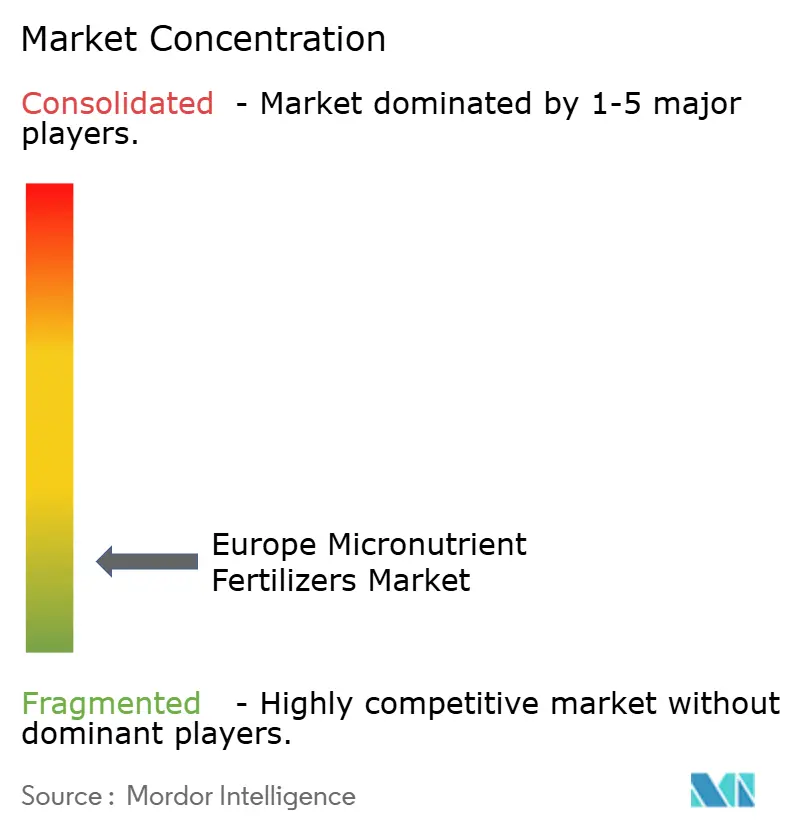
| Market Concentration | Low |
Major Players *Disclaimer: Major Players sorted in no particular order Image © Mordor Intelligence. Reuse requires attribution under CC BY 4.0. | |
Europe Micronutrient Fertilizers Market Analysis by Mordor Intelligence
The Europe Micronutrient Fertilizers Market size was valued at USD 0.73 billion in 2025 and is estimated to grow from USD 0.79 billion in 2026 to reach USD 1.16 billion by 2031, at a CAGR of 6.95% during the forecast period (2026-2031). The market is being shaped by steady soil micronutrient depletion in intensive farming areas, particularly where zinc, manganese, and boron availability has declined under long-term cultivation patterns. The market also benefits from stricter farm nutrient planning requirements under the Common Agricultural Policy (CAP) 2023-2027 framework and the European Commission's 2026 Fertilizer Action Plan, which reinforces nutrient optimization and farm advisory support across European agriculture. Demand is further supported by the continued expansion of high-value horticulture and protected cultivation, where growers rely on precise and repeated micronutrient applications to maintain crop quality and yield. Competition remains fragmented, but the shift toward chelated, liquid, and water-soluble products is raising product and compliance requirements, making scale, formulation capability, and regulatory readiness increasingly important. Raw material volatility, particularly in manganese, zinc, and copper inputs, continues to limit pricing visibility and sustain margin pressure, even as long-term demand remains firm.
Key Report Takeaways
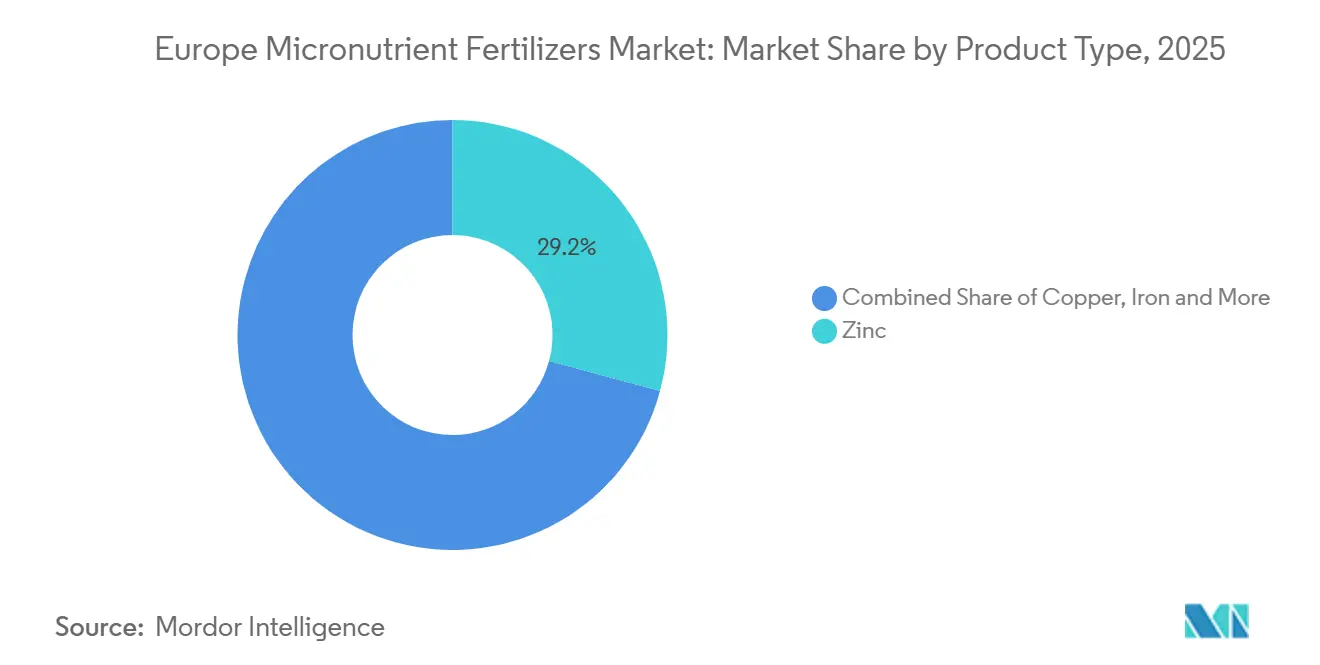
- By product, zinc is the largest segment and held 29.2% of the market share in 2025, while manganese is the fastest-growing segment and is anticipated to expand at a 7.90% CAGR between 2026 and 2031.
- By application mode, foliar is the largest segment and held 65.0% of the market share in 2025, while fertigation is the fastest-growing application mode and is anticipated to expand at a 7.2% CAGR between 2026 and 2031.
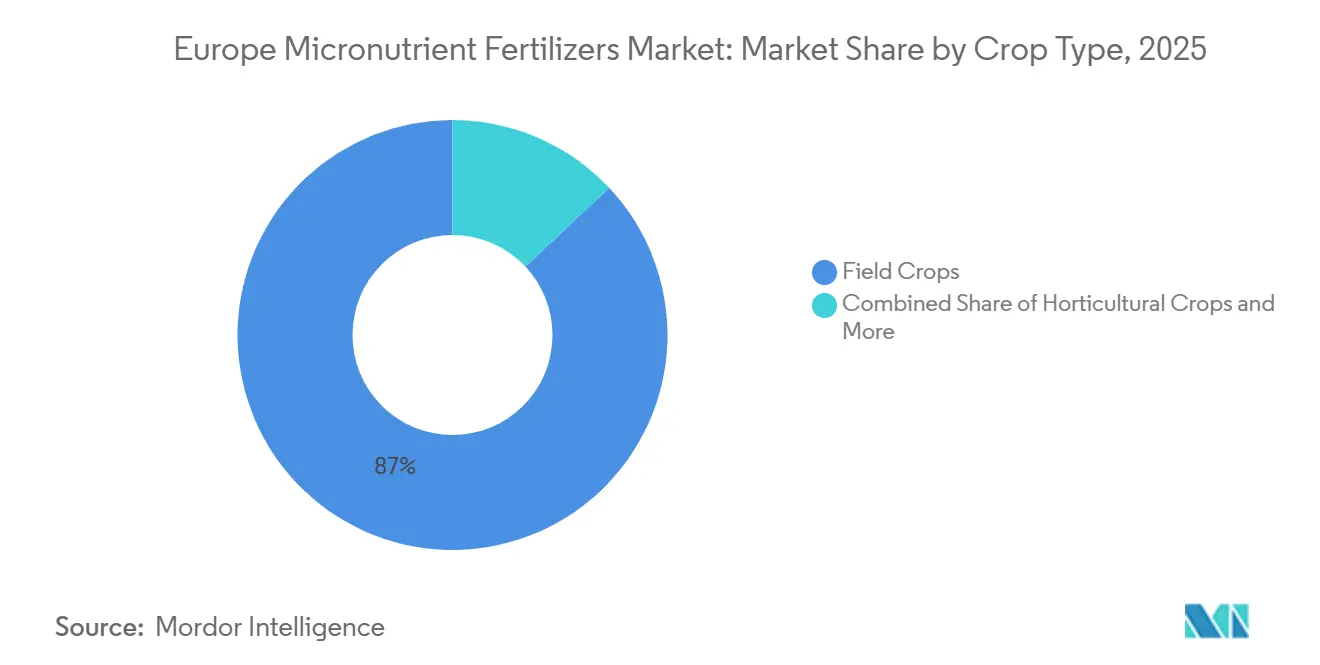
- By crop type, field crops are the largest segment and accounted for 87.0% of the market share in 2025, while horticultural crops are the fastest-growing crop type in the Europe micronutrient fertilizer market with CAGR of 9.3% between 2026 and 2031.
- By geography, France is the largest market and held 14.1% of the market share in 2025, while Russia is the fastest-growing market and is forecasted to grow at a 7.0% CAGR between 2026 and 2031.
Note: Market size and forecast figures in this report are generated using Mordor Intelligence’s proprietary estimation framework, updated with the latest available data and insights as of January 2026.
Europe Micronutrient Fertilizers Market Trends and Insights
Drivers Impact Analysis*
| Driver | (~) % Impact on CAGR Forecast | Geographic Relevance | Impact Timeline |
|---|---|---|---|
| Precision agriculture led soil micronutrient mapping | +1.5% | Europe, concentrated in Germany, France, Netherlands | Short term (≤ 2 years) |
| CAP eco-scheme incentives | +1.2% | EU-27 core, strongest in France, Italy, Spain | Medium term (2-4 years) |
| Rising demand for high-value horticultural crops | +1.3% | Netherlands, Spain, Italy, France | Medium term (2-4 years) |
| Shift toward chelated liquid and water-soluble formulations | +1.0% | Germany, France, Netherlands, United Kingdom | Short term (≤ 2 years) |
| Digital agronomic advisory platforms boosting adoption | +0.8% | Germany, Netherlands, United Kingdom, France | Short term (≤ 2 years) |
| Post-brexit fast-track registrations in the United Kingdom | +0.4% | United Kingdom | Medium term (2-4 years) |
| Source: Mordor Intelligence | |||
Precision Agriculture Led Soil Micronutrient Mapping
Variable-rate soil testing is changing how farmers purchase micronutrients in the Europe micronutrient fertilizer market, replacing blanket programs with field-specific purchases. GPS and GIS-linked sampling at fine grid density is helping farms identify micronutrient deficiencies that were not visible under broader testing practices. The Soil Quality Assessment and mapping Tool (SQAT) project, active since February 2024 with EUR 3.59 million (USD 3.87 million) in EU funding, is developing robot-mounted sensors for in situ soil analysis[1]Source: European Commission, “Soil Quality Analysis Tool: Implementing Smart Farming Applications using EO Data, Soil Sensors & Robotics,” cordis.europa.eu. The project is targeting commercialization through 7 European SMEs by July 2027, keeping the technology application focused on practical farm use rather than laboratory work alone[3]Source: European Commission, “Soil Quality Analysis Tool: Implementing Smart Farming Applications using EO Data, Soil Sensors & Robotics,” cordis.europa.eu. Improved mapping is also revealing zinc and manganese deficiencies in calcareous soils across Southern and Eastern Europe, where visible demand still trails the agronomic need that field data is beginning to expose. For the Europe micronutrient fertilizer market, this is significant because a larger share of future demand may be driven by improved diagnosis rather than simple acreage expansion.
Common Agricultural Policy Eco-Scheme Incentives
The CAP 2023-2027 framework is making nutrient planning a more formal part of farm decision-making across the European micronutrient fertilizer market[2]Source: European Commission, “Commission presents plan to secure Europe's fertiliser supply and food security,” cordis.europa.eu . Micronutrient purchases are increasingly tied to documented soil testing, crop planning, and advisory review, rather than being treated as occasional corrective inputs. The European Commission's Fertilizer Action Plan, adopted in May 2026, calls for stronger Farm Advisory Services within CAP Strategic Plans and explicit support for nutrient use efficiency and bio-based inputs. This policy direction supports more regular micronutrient audits and increases the likelihood that deficiencies are identified before visible crop stress occurs. It also places greater emphasis on compliance and recordkeeping at the farm level, which tends to favor better-organized growers that apply specialty nutrition more consistently. In this context, the European micronutrient fertilizer market gains a more stable demand base, as nutrient management becomes part of routine farm administration rather than an irregular purchase decision.
Rising Demand for High-Value Horticultural Crops
Protected cultivation has become a consistent demand driver in the European micronutrient fertilizer market, as greenhouse crops operate under tighter nutrition thresholds and exhibit lower tolerance to visible deficiencies. Water-soluble and chelated products are well-suited to drip fertigation systems widely used in Spain, Italy, the Netherlands, and France, where precision delivery is already integrated into crop management. Research published in the Journal of Agriculture and Food Research in 2025 on greenhouse mini plum tomatoes showed that foliar zinc-EDTA application increased fruit zinc concentration by 66%, supporting the continued use of premium micronutrient formulations in high-value crop systems. This gives horticulture a disproportionate share of revenue, even though its acreage is far smaller than that of field crops. According to the European Commission, manganese sourcing remains exposed, with 96% of global supply mined outside the EU and more than 60% originating from a single country. This supply structure favors efficient formulations that deliver more usable nutrients per unit applied, particularly where growers cannot afford interruptions in tightly managed crop cycles.
Shift Toward Chelated Liquid and Water-Soluble Formulations
The shift toward chelated liquid and water-soluble products in the Europe micronutrient fertilizer market is driven by both performance requirements and regulatory compliance. Farmers using drip irrigation, greenhouse systems, and foliar programs require products that remain soluble, stable, and effective under intensive crop schedules. In 2025, ICL Group Ltd. stated that its eqo.x coating received official certification for biodegradable coating compliance under the EU framework, illustrating how product development is increasingly aligned with regulatory requirements. This benefits companies that can combine advanced formulation capabilities with market access readiness across multiple European countries. It also places smaller regional blenders under greater pressure, as the Europe micronutrient fertilizer market no longer rewards low-complexity supply to the same extent as before.
Restraints Impact Analysis*
| Restraint | (~) % Impact on CAGR Forecast | Geographic Relevance | Impact Timeline |
|---|---|---|---|
| Metal-based raw material price volatility | -0.8% | Europe, highest impact in Germany, Russia, United Kingdom | Short term (≤ 2 years) |
| European union heavy-metal contaminant limits | -0.6% | EU-27 | Long term (≥ 4 years) |
| Bio-fortification policies reducing external application | -0.4% | France, Germany, Netherlands, United Kingdom | Long term (≥ 4 years) |
| Competition from biological inoculants and biofertilizers | -0.5% | Germany, France, Spain | Medium term (2-4 years) |
| Source: Mordor Intelligence | |||
Metal-Based Raw Material Price Volatility
Prices for zinc, copper, and manganese sulfate remain exposed to commodity fluctuations, which can narrow manufacturer margins in the Europe micronutrient fertilizer market. When input costs rise sharply, suppliers often pass part of the increase to farmers, which can delay purchases of specialty products not viewed as immediately necessary. This exposure is significant given that manganese is also the fastest-growing product segment in the Europe micronutrient fertilizer market. Any supply disruption or cost increase can slow the segment that suppliers are most actively trying to scale. This creates a challenging dynamic where growth remains attractive, but earnings visibility and timing are heavily dependent on raw material conditions.
Competition from Biological Inoculants and Biofertilizers
Biological inputs are gaining attention in Europe and are beginning to compete for the same specialty crop nutrition budgets that support the European micronutrient fertilizer market. The policy context is relevant, as the EU Green Deal and Farm to Fork strategy prioritize fertilizer reduction and soil health improvement. Research published in MDPI in the year 2025 indicates that some bio-based fertilizers can match conventional phosphorus uptake performance while improving zinc bioavailability through soil microbiome activity. This means biological products can serve as complements in some systems and partial substitutes in others. The pressure on the European micronutrient fertilizer market is often indirect, as stronger soil biology can reduce the frequency of corrective micronutrient applications in well-managed fields. As a result, spending can shift within the same farm budget even when growers do not stop using mineral micronutrients entirely.
*Our forecasts treat driver/restraint impacts as directional, not additive. The impact forecasts reflect baseline growth, mix effects, and variable interactions.
Segment Analysis
By Product: Zinc Anchors Volume, Manganese Gains Strategic Importance
Zinc held 29.2% of the Europe micronutrient fertilizer market share in 2025, reflecting its broad role across wheat, maize, and sunflower systems in calcareous and high-pH soils where plant availability is structurally constrained. This wide agronomic relevance keeps zinc central to the Europe micronutrient fertilizer market, as the issue is rooted in soil chemistry as much as in farm practice. Manganese is anticipated to expand at a 7.90% CAGR from 2026 to 2031, supported by greenhouse horticulture and soilless systems where repeated crop cycles require constant replenishment. Copper and iron also retain clear roles, with copper linked to cereals and oilseed rape in deficiency-prone areas and iron chelates used widely in alkaline orchards, vineyards, and vegetable systems.
Boron remains important in pollination-sensitive crops such as oilseed rape, sunflower, and sugar beet across several large farming countries in the region. Molybdenum remains smaller in absolute demand but holds a stable place in legume cultivation. The manganese segment also carries a distinct procurement risk, making raw material planning more exposed than in several other product lines. The Soil Quality Analysis Tool (SQAT) precision mapping effort is also likely to improve the identification of micronutrient-deficient parcels across crop systems, supporting more targeted demand across the Europe micronutrient fertilizer industry.


By Application Mode: Foliar Leads, Fertigation Gains Structural Ground
Foliar application accounted for 65.0% of the Europe micronutrient fertilizer market in 2025, reflecting its advantage for fast in-season deficiency correction across both large-acreage and specialty crops. Its position is strongest where growers require visible crop response within the same season and where spray programs are already well established. This explains the continued widespread use of foliar products in France, Germany, and the United Kingdom. Foliar use also sees steady support in horticulture across the Europe micronutrient fertilizer market, as deficiency symptoms can quickly reduce the commercial value of marketable produce.
Fertigation is the fastest-growing application mode with 7.2% CAGR from 2026 to 2031, driven by drip-irrigated greenhouse systems in Spain, Italy, and the Netherlands, where micronutrients are delivered through existing irrigation infrastructure. This lowers the barrier to adoption, as growers do not require separate capital investment to incorporate micronutrients into their irrigation programs. Soil application remains relevant in large field-crop systems across Russia and Ukraine, where pre-planting zinc and manganese correction suits broad-acre operating models. These dynamics keep the Europe micronutrient fertilizer market balanced across immediate-response foliar use, expanding fertigation, and soil application programs suited to large farm units. Over time, application decisions are likely to become more crop-stage specific as digital agronomy and precision mapping improve field-level diagnosis.
By Crop Type: Field Crops Anchor Volume, Horticulture Drives Premium Value
Field crops accounted for 87.0% of the market size in 2025, reflecting the European micronutrient fertilizer market's strong dependence on cereals, oilseeds, and root crops for baseline demand. Wheat, maize, oilseed rape, and sugar beet cover large areas across France, Germany, Ukraine, Russia, and Poland, giving field crops a clear volume advantage over all other crop groups. These crops also experience recurring zinc, copper, and manganese deficiencies at specific growth stages, which supports repeat product use. This positions field crops at the center of routine demand, even as revenue growth is more visible in other segments of the Europe micronutrient fertilizer market.
Horticultural crops are the fastest-growing crop type, with a 9.3% CAGR between 2026 and 2031, and significantly higher micronutrient application rates per hectare than field crops. Research published in MDPI in 2025 on sulfur-zinc microgranular fertilizer in tomato production across Italy, Spain, and Poland demonstrated notable yield and plant health responses, supporting continued product intensity in horticultural systems. Turf and ornamental use remains smaller in volume but represents a premium niche in countries such as the United Kingdom and the Netherlands. Protected cultivation is likely to continue increasing the revenue share of horticulture, as year-round supply programs and buyer quality standards leave little room for nutrient-related defects. As a result, the crop mix within the Europe micronutrient fertilizer market will continue to shift gradually toward higher-value programs, even as field crops remain the primary source of tonnage.
Geography Analysis
France was the largest market in 2025, with a 14.1% value share, supported by the scale and diversity of its agricultural base. The country has extensive wheat cultivation across the Paris Basin, a large viticulture sector in the south and southwest, and a well-established agri-advisory network that has long encouraged soil testing and balanced crop nutrition. Data from the Union des Industries de la Fertilisation (UNIFA) showed that France recorded deliveries of 17.9 million metric tons of mineral and organic fertilizers during the 2023 to 2024 campaign. This stable volume profile also points to a gradual shift in product mix toward specialty and micronutrient formulations as CAP eco-scheme nutrient management requirements continue to take hold. Spain remains strategically important, supported by Mediterranean drip-irrigated horticulture, olive and citrus cultivation, and vineyards in alkaline soil conditions that sustain recurring demand for iron chelates and zinc. Ukraine continues to hold structural importance because its expansive black-soil belt supports large grain systems that require high-volume zinc and manganese corrective applications.
Russia is the fastest-growing geography, with a forecasted CAGR of 7.0% between 2026 and 2031. Grain production goals have strengthened nutrient programs across the Volga Federal District and the Central Black Earth region, where repeated cereal cultivation has reduced micronutrient reserves and increased the case for corrective applications at scale. Italy benefits from its premium horticultural base, including tomatoes, grapes, and protected vegetables, which sustains demand for iron chelates and boron in calcareous Mediterranean soils where iron chlorosis remains a persistent issue. Germany remains a key center for precision agriculture, and variable-rate micronutrient application is gaining wider relevance in northern grain-producing states. A peer-reviewed study on German farmers' adoption of variable-rate nitrogen fertilization found that capability building and clear profitability evidence are the two main factors shaping broader technology uptake, and those findings are also relevant for micronutrient prescriptions. The United Kingdom is also being supported by legislative change, as the government opened a public consultation in March 2026 on the proposed UK Fertilising Products Regulations, which are designed to replace rules that had remained unchanged for more than 20 years and allow specialty and micronutrient products to enter the market more quickly.
The Netherlands, despite its small land area, accounts for a disproportionate share of premium micronutrient spending because of its advanced greenhouse horticulture and floriculture sectors. In these systems, iron EDDHA (Ethylenediamine-N,N′-bis(2-hydroxyphenylacetic acid)) chelates, manganese sulfate, and boron are part of routine professional crop nutrition programs. Growth is also being supported by product upgrades toward biodegradable and amino acid-chelated formulations, while the Dutch point-based eco-scheme, extended with additional eco-activities in 2024 and 2025, is creating stronger financial support for precision nutrient management and more detailed soil testing. The rest of Europe includes developing markets across the Balkans, the Baltic states, and the Nordic countries, where micronutrient adoption still trails the European Umion core. These markets continue to offer medium-term volume potential as agricultural modernization spending rises and access to agri-advisory support improves. Overall, the Europe micronutrient fertilizer market remains broad-based, with Western Europe driving product upgrades and Eastern Europe supporting high-volume corrective demand.
Competitive Landscape
The Europe micronutrient fertilizer market remains highly fragmented, with the top five players holding a smaller share of 2025 revenue. This level of concentration means no single supplier has full pricing control across products, channels, and countries. Regional blenders, national specialty suppliers, and cooperative distribution networks retain a meaningful share of farmer relationships. As a result, product performance, channel access, and advisory support matter as much as scale in many purchase decisions. This fragmented structure is a defining feature of the market, even as compliance and formulation demands gradually raise barriers to entry.
Yara International is one of the key players, combining established micronutrient brands with broad crop nutrition reach. Yara reported USD 15.7 billion in total 2025 revenue and Europe EBITDA of USD 612 million, up 121% from 2024, indicating that Europe remains an important earnings base for the company. These developments indicate that the market is rewarding suppliers that combine product portfolios with compliance tools, agronomic guidance, and crop-specific digital access.
The next area of competition is likely to center on biodegradable chemistry and traceable field-level recommendations. Larger firms are better positioned to absorb certification work, product testing, and multi-country registration requirements. Smaller regional blenders are therefore more exposed to white-label dependence or consolidation if technical thresholds continue to rise. Even so, local relationships remain important, as the market is sold into varied crop systems, different advisory cultures, and diverse national distribution structures. This keeps the market accessible for regional suppliers, even as the strongest multinational players build advantage through technology, formulation depth, and regulatory readiness.
Europe Micronutrient Fertilizers Industry Leaders
Yara International ASA
Compo Expert GmbH (Grupa Azoty S.A.)
Sociedad Quimica y Minera de Chile S.A.
Trade Corporation International (Rovensa Group)
Valagro S.p.A. (Syngenta Group)
- *Disclaimer: Major Players sorted in no particular order

Recent Industry Developments
- July 2026: Rovensa Next joined BIO², a EUR 6.4 million (USD 6.9 million) Horizon Europe project focused on developing bio-based fertilizers and microbial solutions from circular sources. The initiative targets at least two fully circular biofertilizers by 2029, with field trials planned across Germany, Latvia, Italy, Norway, and Spain on crops including wheat, potato, strawberry, and table grapes. BIO² supports the European crop nutrition market's shift toward bio-based alternatives, driven by EU Green Deal regulations, aiming to replace traditional chemical inputs and reduce reliance on conventional macronutrients.
- March 2026: TIMAC Agro France formalized a strategic partnership with the Confederation of Independent Winegrowers of France, covering nearly 7,000 independent winegrowers across all French wine-producing regions. The agreement focuses on tailored agronomic support including micronutrient nutrition, soil fertility optimization, and water-stress management.
- May 2026: Yara International launched YaraBela NITROMAG Z, a multi-nutrient granular fertilizer combining nitrogen, calcium, magnesium, and zinc in a single granule. The product improves zinc delivery efficiency alongside macronutrient applications, reducing the number of required field passes and broadening Yara's specialty zinc product offering for European arable farmers seeking consolidated nutrition solutions.


Europe Micronutrient Fertilizers Market Report Scope
Micronutrient fertilizers are fertilizers that supply essential nutrients in very small quantities to prevent crop deficiencies and improve plant growth, yield, and quality. They are formulated for targeted delivery across diverse crop types and application methods, supporting precision nutrition strategies in modern agriculture.
The Europe Micronutrient Fertilizers Market is Segmented by Product Type (Boron, Copper, Iron, Manganese, Molybdenum, Zinc, and Others), by Application Mode (Fertigation, Foliar, and Soil), by Crop Type (Field Crops, Horticultural Crops, and Turf and Ornamental), and by Geography (France, Germany, Italy, Netherlands, Russia, Spain, Ukraine, the United Kingdom, and Rest of Europe). The Market Size and Forecasts are Provided in Terms of Value (USD) and Volume (Metric Tons).
| Boron |
| Copper |
| Iron |
| Manganese |
| Molybdenum |
| Zinc |
| Others |
| Fertigation |
| Foliar |
| Soil |
| Field Crops |
| Horticultural Crops |
| Turf and Ornamental |
| France |
| Germany |
| Italy |
| Netherlands |
| Russia |
| Spain |
| Ukraine |
| United Kingdom |
| Rest Of Europe |
| Product | Boron |
| Copper | |
| Iron | |
| Manganese | |
| Molybdenum | |
| Zinc | |
| Others | |
| Application Mode | Fertigation |
| Foliar | |
| Soil | |
| Crop Type | Field Crops |
| Horticultural Crops | |
| Turf and Ornamental | |
| By Geography | France |
| Germany | |
| Italy | |
| Netherlands | |
| Russia | |
| Spain | |
| Ukraine | |
| United Kingdom | |
| Rest Of Europe |


Key Questions Answered in the Report
What is the 2026 value of the Europe micronutrient fertilizer market?
The Europe micronutrient fertilizer market is valued at USD 0.76 billion in 2026 and is anticipated to reach USD 1.16 billion by 2031 at a 6.95% CAGR from 2026 to 2031.
Which product segment is leading and which is growing fastest?
Zinc led in 2025 with 29.2% value share, while manganese is the fastest-growing product with a forecasted 7.9% CAGR between 2026 and 2031.
Why is foliar application still dominant in Europe?
Because it allows quick in-season correction of nutrient deficiencies and fits established spray programs across major crop systems.
Which country leads the regional landscape?
France led with 14.1% value share in 2025, while Russia is the fastest-growing geography with a forecasted 7.00% CAGR from 2026 to 2031.
Page last updated on:


