Market Overview
| Study Period | 2018 - 2031 |
|---|---|
| Forecast Data Period | 2026 - 2031 |
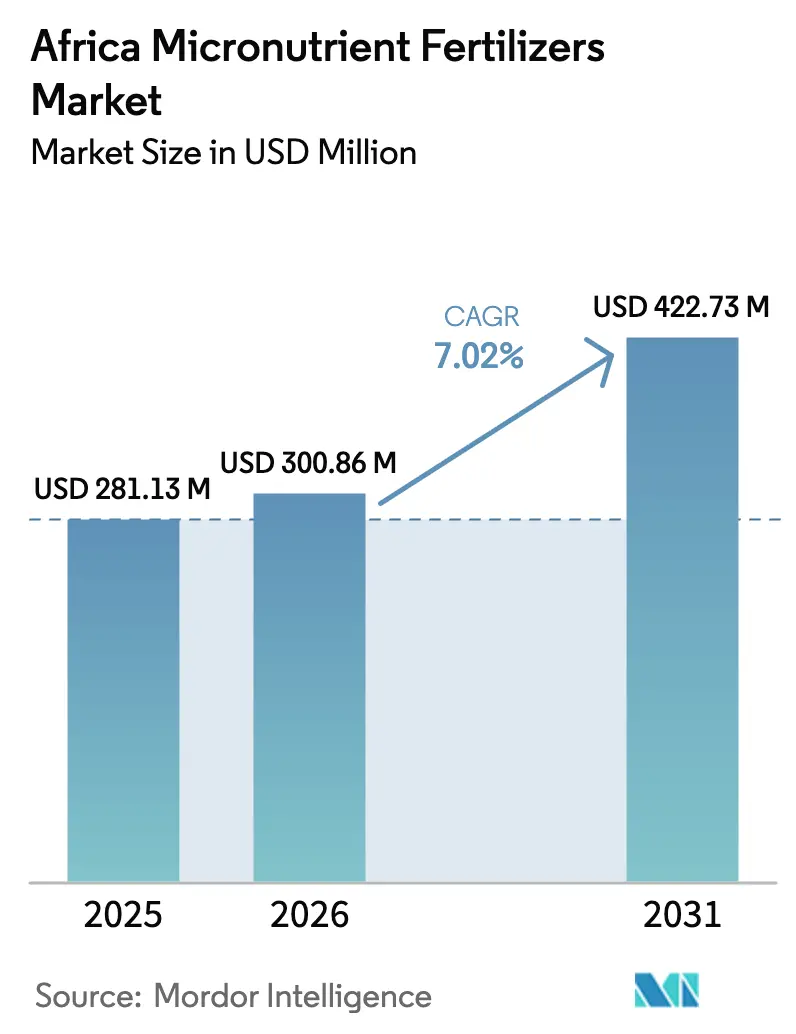
| Base Year Market Size (2025) | USD 281.13 Million |
| Market Size (2026) | USD 300.86 Million |
| Market Size (2031) | USD 422.73 Million |
| Growth Rate (2026 - 2031) | 7.02% CAGR |
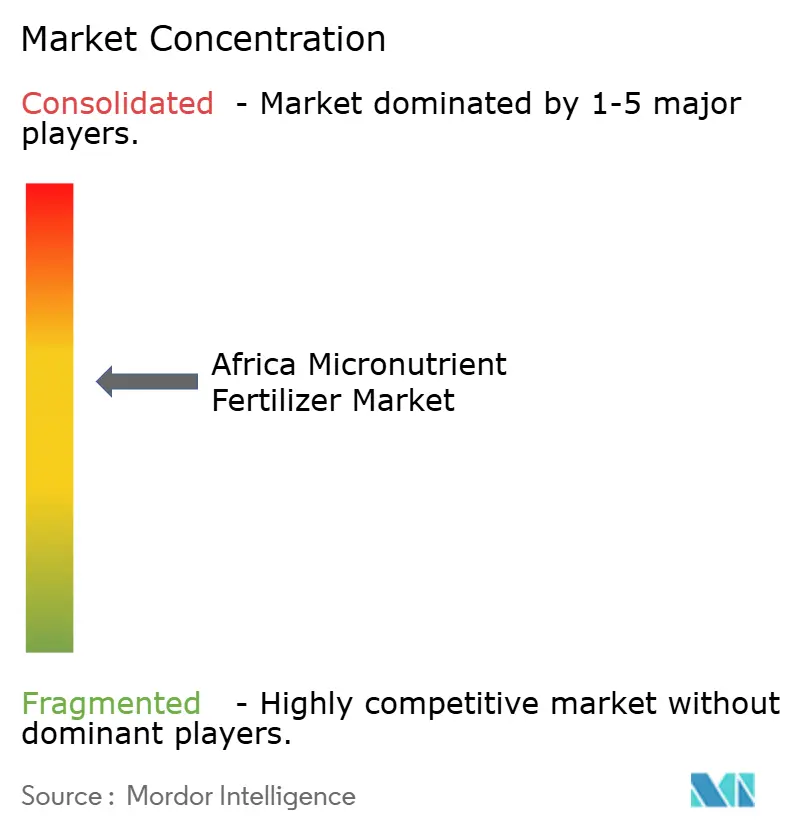
| Market Concentration | Medium |
Major Players *Disclaimer: Major Players sorted in no particular order Image © Mordor Intelligence. Reuse requires attribution under CC BY 4.0. | |
Africa Micronutrient Fertilizers Market Analysis by Mordor Intelligence
The Africa micronutrient fertilizers market size is expected to grow from USD 281.13 million in 2025 to USD 300.86 million in 2026 and is forecast to reach USD 422.73 million by 2031 at 7.02% CAGR over 2026-2031. Rapid growth is anchored in continent-wide zinc and boron soil deficiencies, subsidy programs that offset as much as 30% of blend costs, and a surge of drip-irrigated hectares that favors soluble formulations. Investments in regional blending hubs are lowering delivered prices, while digital soil diagnostics shorten the time between deficiency detection and product purchase. Competitive intensity is rising as global suppliers partner with local distributors to secure shelf space and build farmer loyalty. Quality control gaps and raw-material price swings remain risks, yet the policy, technology, and nutrition objectives now aligned behind soil enrichment point to durable demand momentum across the Africa micronutrient fertilizers market.
Key Report Takeaways
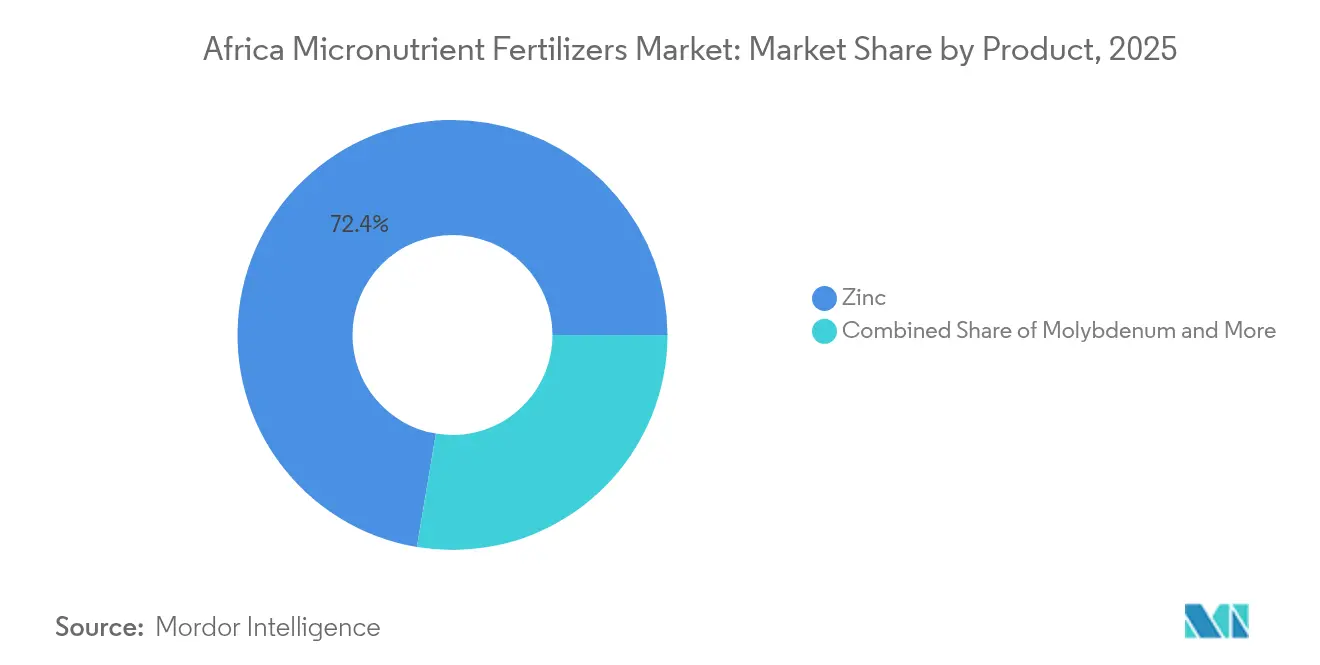
- By Product category, zinc-based formulations led with 72.35% revenue share in 2025, molybdenum products are projected to advance at an 8.63% CAGR through 2031.
- By Application mode, fertigation held 93.10% of the Africa micronutrient fertilizers market size in 2025, while foliar sprays recorded the highest projected CAGR at 7.88% through 2031.
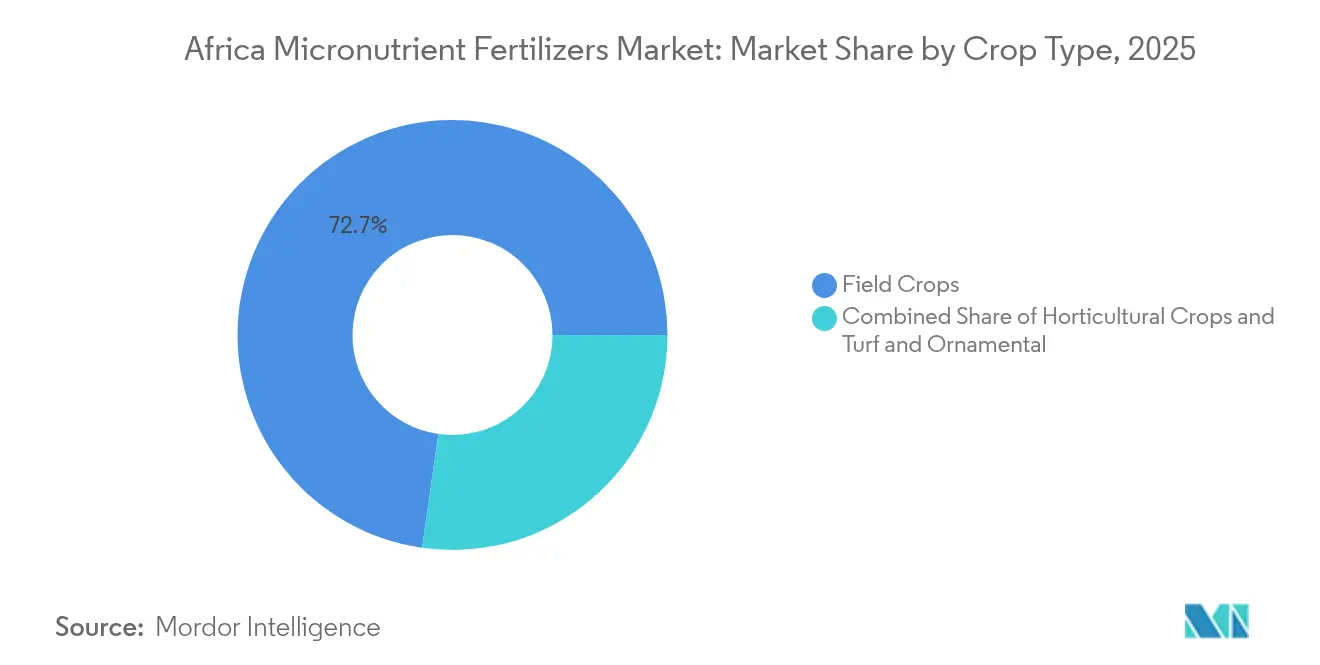
- By Crop type, field crops accounted for a 72.74% share of the Africa micronutrient fertilizers market size in 2025 and are trending at an 7.96% CAGR through 2031.
- By Country, South Africa, accounted for 27.55% share of the Africa micronutrient fertilizers market size in 2025 and are trending at an 8.21% CAGR through 2031.
Note: Market size and forecast figures in this report are generated using Mordor Intelligence’s proprietary estimation framework, updated with the latest available data and insights as of 2026.
Africa Micronutrient Fertilizers Market Trends and Insights
Drivers Impact Analysis*
| Driver | (~) % Impact on CAGR Forecast | Geographic Relevance | Impact Timeline |
|---|---|---|---|
| Widespread micronutrient-deficient soils in Africa | +2.1% | Sub-Saharan and North Africa core regions | Long term (≥ 4 years) |
| Government subsidy programs and blended-fertilizer policies | +1.8% | Nigeria, Kenya, Rwanda, and Ghana are priority markets | Medium term (2-4 years) |
| Expansion of fertigation and precision-ag technologies | +1.5% | South Africa, Morocco, and Egypt are leading the adoption | Medium term (2-4 years) |
| Digital soil-diagnostic platforms boosting customized blends | +1.2% | East and West Africa pilot regions | Short term (≤ 2 years) |
| Growth of local blending facilities using duty-free premixes | +1.4% | Nigeria, Ghana, Kenya are manufacturing hubs | Medium term (2-4 years) |
| Bio-fortification initiatives linking fertilizer and nutrition | +0.9% | Pan-African HarvestPlus countries | Long term (≥ 4 years) |
| Source: Mordor Intelligence | |||


Widespread Micronutrient-Deficient Soils in Africa
Soil testing across Africa reveals zinc and boron deficiencies in 55% to 70% of agricultural land, creating an addressable market that extends far beyond current fertilizer application rates. This deficiency pattern is particularly acute in sub-Saharan regions where continuous cropping without nutrient replacement has depleted soil micronutrient reserves over decades. The scale of deficiency ensures sustained demand for micronutrient-enriched blends regardless of short-term price volatility. Regional soil surveys conducted by national agricultural research institutes consistently show zinc deficiency prevalence exceeding 60% in major grain-producing areas of Nigeria, Kenya, and Ghana. The structural nature of this driver means that even modest improvements in farmer awareness and access can unlock significant market expansion, as the agronomic need far exceeds current application levels across most African farming systems.
Government Subsidy Programs and Blended-Fertilizer Policies
Policy interventions in Nigeria, Kenya, and Rwanda now provide up to 30% reimbursement for micronutrient blend purchases, fundamentally altering the economics of adoption for smallholder farmers [1]Source: Chinemelum A. Eneh and Onyenekenwa C. Eneh, “A System Dynamics Analysis of Agricultural Practices and Food Security in Nigeria,” Journal of Health, Population and Nutrition, hponline.org. These programs represent a strategic shift from generic NPK subsidies toward targeted soil health interventions that address specific nutrient gaps. Nigeria's fertilizer subsidy reforms in 2024 specifically included micronutrient blends in eligible product categories, while Kenya's agricultural transformation program allocates dedicated funding for soil testing and customized fertilizer recommendations. The policy momentum extends beyond direct subsidies to include duty-free import classifications for micronutrient premixes, reducing input costs for local blending operations. Rwanda's approach links micronutrient fertilizer access to crop insurance programs, creating additional incentives for adoption while managing farmer risk exposure.
Expansion Of Fertigation and Precision-Ag Technologies
Drip-irrigated hectares across Africa are expanding at over 12% annually, with Morocco, Egypt, and South Africa leading the adoption of fertigation systems that favor soluble micronutrient formulations [2]Source: Gregory Gondwe, “How Malawi Is Taking AI Technology to Small-Scale Farmers Who Do Not Have Smartphones,” Phys.org, phys.org . This infrastructure buildout creates a premium market segment for chelated and water-soluble micronutrient products that command higher margins than granular alternatives. The fertigation trend is particularly pronounced in high-value horticultural crops where micronutrient application through irrigation systems enables precise timing and dosage control. Commercial greenhouse operations in Kenya and South Africa are increasingly specifying micronutrient-enriched fertigation programs that integrate with automated irrigation controllers.
Digital Soil-Diagnostic Platforms Boosting Customized Blends
Platforms like AgroCares SoilCares Advanced and Yara's digital agriculture tools are connecting real-time soil analysis to customized micronutrient blend recommendations, creating new pathways for product differentiation and farmer engagement. These systems enable agronomists to identify specific micronutrient deficiencies and prescribe targeted solutions rather than generic multi-nutrient blends. The integration of soil diagnostics with mobile ordering platforms reduces the time between deficiency identification and product delivery, improving the effectiveness of micronutrient interventions. Digital extension services in Uganda and Malawi are incorporating micronutrient recommendations into AI-powered advisory systems that provide localized guidance in native languages.
Restraints Impact Analysis*
| Restraint | (~) % Impact on CAGR Forecast | Geographic Relevance | Impact Timeline |
|---|---|---|---|
| Price volatility and import dependence for raw materials | -1.6% | Continental import-dependent markets | Short term (≤ 2 years) |
| Limited farmer awareness and technical know-how | -1.3% | Rural smallholder regions | Medium term (2-4 years) |
| Fragmented quality control enabling counterfeit products | -1.1% | Nigeria, Kenya, and Ghana are high-risk zones | Short term (≤ 2 years) |
| Logistics bottlenecks for last-mile delivery | -0.8% | Inland and remote areas | Medium term (2-4 years) |
| Source: Mordor Intelligence | |||
Price Volatility and Import Dependence for Raw Materials
High molybdenum prices in African countries have compelled blenders to postpone molybdenum-based product launches, limiting the range of micronutrients available to farmers. The price volatility affects not only molybdenum but also zinc, boron, and chelating agents, which are significant input costs for specialty fertilizer manufacturers. The dependence on imports for essential raw materials makes African markets vulnerable to global supply chain disruptions and currency fluctuations that impact product economics. The concentration of micronutrient raw material production in China and other Asian markets introduces geopolitical risks affecting supply reliability. Blending operations in Africa struggle to maintain consistent product pricing due to fluctuating input costs, which reduces farmer adoption as price uncertainty affects purchasing decisions.
Limited Farmer Awareness and Technical Know-How
Only 18% of smallholder farmers receive micronutrient dosage training through extension services, constraining uptake despite product availability and subsidy support. The technical complexity of micronutrient application, including timing, dosage, and compatibility considerations, requires specialized knowledge that exceeds the capacity of traditional extension systems. Limited literacy rates in rural areas compound the challenge of communicating technical product information and application guidelines to end users. The knowledge gap is particularly acute for newer products like chelated micronutrients and foliar applications that require different handling and application techniques compared to traditional granular fertilizers.
*Our forecasts treat driver/restraint impacts as directional, not additive. The impact forecasts reflect baseline growth, mix effects, and variable interactions.
Segment Analysis
By Product: Zinc Dominance Reflects Deficiency Prevalence
Zinc-based micronutrient fertilizers captured 72.35% market share in 2025, reflecting the widespread prevalence of zinc deficiency across African soils and its critical role in crop yield and nutritional quality. The dominance of zinc products stems from their dual benefit in addressing both agronomic performance and biofortification objectives, making them attractive to both farmers and nutrition-focused development programs. Copper and iron-based products serve specialized applications in high-value horticultural crops and areas with specific soil chemistry challenges, while manganese formulations find growing demand in acidic soil regions where manganese availability is limited by pH conditions.
Molybdenum-based fertilizers represent the fastest-growing segment with 8.63% CAGR through 2031, driven by increasing awareness of molybdenum's role in nitrogen fixation and protein synthesis, particularly in legume production systems that are expanding across the continent. Product development trends favor multi-micronutrient blends that address multiple deficiencies simultaneously, reducing application complexity and improving cost-effectiveness for farmers.


By Application Mode: Fertigation Leads Technology Adoption
Fertigation commands 93.10% market share in 2025, reflecting the rapid expansion of drip irrigation infrastructure and the precision agriculture movement across Africa's commercial farming sectors. This application method enables precise nutrient delivery timing and reduces product waste compared to broadcast soil applications, making it particularly attractive for high-value crops and water-scarce regions. The fertigation segment benefits from government irrigation expansion programs and private sector investments in greenhouse and protected agriculture systems that require sophisticated nutrient management approaches.
Foliar application represents the fastest-growing mode at 7.88% CAGR, driven by its effectiveness in addressing acute micronutrient deficiencies and its compatibility with existing crop protection spray programs. Soil application methods maintain relevance in traditional farming systems and field crop production, where broadcast or banded applications integrate with conventional fertilization practices. The application mode preferences vary significantly by crop type and farm scale, with commercial operations favoring fertigation and foliar methods while smallholder farmers rely primarily on soil-applied products.
By Crop Type: Field Crops Drive Volume Demand
Field crops account for 72.74% of market demand in 2025, reflecting the continent's focus on staple grain production and food security objectives. Maize, wheat, and rice production systems increasingly incorporate micronutrient fertilization as part of intensification strategies aimed at closing yield gaps and improving nutritional content. The field crop segment benefits from biofortification programs that link micronutrient fertilizer use to enhanced grain nutrient density, creating market premiums that offset higher input costs. The crop type segmentation reflects broader agricultural development patterns, where field crop intensification drives volume growth while horticultural specialization supports value-added market development.
The horticultural crops segment is witnessing fastest fastest-growing market,, 8.14% CAGR through 2031, a significant transformation in the African micronutrient fertilizer market, driven by the increasing adoption of protected cultivation methods and precision farming techniques. The segment's growth is supported by the region's favorable climate conditions for growing various fruit and vegetable crops, including citrus, pineapples, bananas, potatoes, and cassava. The rising emphasis on nutritional security and the growing export potential of horticultural products to global markets are fueling the demand for micronutrient fertilizers in this segment. Additionally, the increasing awareness among farmers about the critical role of micronutrients in improving fruit and vegetable quality, coupled with the adoption of modern irrigation systems and fertigation practices, is contributing to the segment's expansion. Source: https://www.mordorintelligence.com/industry-reports/africa-micronutrient-fertilizer-market
Geography Analysis
South Africa leads global micronutrient fertilizer market growth with 8.21% CAGR through 2031, significantly outpacing other regions due to the combination of severe soil deficiencies, supportive government policies, and agricultural intensification pressures. South Africa maintains the largest country market share 27.55% in 2025, benefiting from advanced agricultural infrastructure, established distribution networks, and commercial farming operations that readily adopt micronutrient technologies.
Nigeria is becoming an important market due to government subsidy reforms incorporating micronutrient blends in reimbursement programs. The Dangote Group's USD 2.5 billion fertilizer complex, which includes dedicated micronutrient production facilities, further strengthens the market position. Kenya and Ghana represent key growth markets where digital soil diagnostic platforms and precision agriculture adoption create demand for customized micronutrient solutions. The regional growth pattern reflects varying stages of agricultural development and policy support across the continent. North African countries, including Morocco and Egypt, benefit from established fertigation infrastructure and export-oriented agriculture that demands high-quality micronutrient inputs, while food security imperatives and biofortification programs drive sub-Saharan markets.
Competitive Landscape
The Africa micronutrient fertilizer market exhibits moderate concentration, with top players including Yara International ASA, ICL Group Ltd, Unikeyterra Chemical, Kynoch Fertilizer, and Gavilon South Africa (MacroSource, LLC), indicating significant opportunities for both established players and emerging regional competitors to capture market position through strategic investments and localized approaches. The competitive dynamics increasingly favor companies that combine global technical capabilities with local production and distribution assets, as evidenced by OCP Africa's USD 13 billion investment program that establishes regional blending facilities to serve continental markets.
Technology adoption emerges as a key competitive differentiator, with leading players investing in digital soil diagnostic platforms and precision agriculture tools that connect farmers directly to customized micronutrient recommendations and ordering systems. Opportunities exist in underserved rural markets where logistics challenges and limited technical support create barriers for traditional players, potentially favoring agile local competitors who can develop innovative distribution models and farmer education programs.
Quality control capabilities represent another competitive advantage, as regulatory enforcement increases and farmers become more sophisticated in product selection, favoring suppliers with consistent product quality and technical support services over low-cost alternatives that may compromise efficacy and farmer trust.
Africa Micronutrient Fertilizers Industry Leaders
Yara International ASA
ICL Group Ltd
Unikeyterra Chemical
Kynoch Fertilizer
Gavilon South Africa (MacroSource, LLC)
- *Disclaimer: Major Players sorted in no particular order

Recent Industry Developments
- July 2025: ara International ASA strengthened its African presence through a strategic partnership with Asili Agriculture in Uganda, deploying digital agriculture platforms including the FarmCare app and Yara Connect system to provide real-time soil diagnostics and micronutrient recommendations. The partnership targets 50,000 smallholder farmers across East Africa with precision agriculture services.
- May 2024: The African Union issued the Nairobi Declaration calling for harmonized continental regulatory frameworks for fertilizer quality control and cross-border trade facilitation, potentially streamlining market access for micronutrient products across member countries
- April 2023: K+S acquired a 75% share of the fertilizer business of a South African trading company, Industrial Commodities Holdings (Pty) Ltd (ICH). In addition to expanding the core business, K+S is strengthening its operations in southern and eastern Africa as a result of this acquisition. The newly acquired fertilizer business in the future is to be operated in a joint venture under the name of FertivPty Ltd.


Africa Micronutrient Fertilizers Market Report Scope
Boron, Copper, Iron, Manganese, Molybdenum, Zinc, Others are covered as segments by Product. Fertigation, Foliar, Soil are covered as segments by Application Mode. Field Crops, Horticultural Crops, Turf & Ornamental are covered as segments by Crop Type. Nigeria, South Africa are covered as segments by Country.Product
| Boron |
| Copper |
| Iron |
| Manganese |
| Molybdenum |
| Zinc |
| Others |
Application Mode
| Fertigation |
| Foliar |
| Soil |
Crop Type
| Field Crops |
| Horticultural Crops |
| Turf & Ornamental |
Country
| Nigeria |
| South Africa |
| Rest of Africa |
| Product | Boron |
| Copper | |
| Iron | |
| Manganese | |
| Molybdenum | |
| Zinc | |
| Others | |
| Application Mode | Fertigation |
| Foliar | |
| Soil | |
| Crop Type | Field Crops |
| Horticultural Crops | |
| Turf & Ornamental | |
| Country | Nigeria |
| South Africa | |
| Rest of Africa |


Market Definition
- MARKET ESTIMATION LEVEL - Market Estimations for various types of fertilizers has been done at the product-level and not at the nutrient-level.
- NUTRIENT TYPES COVERED - Micronutients: Zn, Mn, Cu, Fe, Mo, B, and Others
- AVERAGE NUTRIENT APPLICATION RATE - This refers to the average volume of nutrient consumed per hectare of farmland in each country.
- CROP TYPES COVERED - Field Crops: Cereals, Pulses, Oilseeds, and Fiber Crops Horticulture: Fruits, Vegetables, Plantation Crops and Spices, Turf Grass and Ornamentals
| Keyword | Definition |
|---|---|
| Fertilizer | Chemical substance applied to crops to ensure nutritional requirements, available in various forms such as granules, powders, liquid, water soluble, etc. |
| Specialty Fertilizer | Used for enhanced efficiency and nutrient availability applied through soil, foliar, and fertigation. Includes CRF, SRF, liquid fertilizer, and water soluble fertilizers. |
| Controlled-Release Fertilizers (CRF) | Coated with materials such as polymer, polymer-sulfur, and other materials such as resins to ensure nutrient availability to the crop for its entire life cycle. |
| Slow-Release Fertilizers (SRF) | Coated with materials such as sulfur, neem, etc., to ensure nutrient availability to the crop for a longer period. |
| Foliar Fertilizers | Consist of both liquid and water soluble fertilizers applied through foliar application. |
| Water-Soluble Fertilizers | Available in various forms including liquid, powder, etc., used in foliar and fertigation mode of fertilizer application. |
| Fertigation | Fertilizers applied through different irrigation systems such as drip irrigation, micro irrigation, sprinkler irrigation, etc. |
| Anhydrous Ammonia | Used as fertilizer, directly injected into the soil, available in gaseous liquid form. |
| Single Super Phosphate (SSP) | Phosphorus fertilizer containing only phosphorus which has lesser than or equal to 35%. |
| Triple Super Phosphate (TSP) | Phosphorus fertilizer containing only phosphorus greater than 35%. |
| Enhanced Efficiency Fertilizers | Fertilizers coated or treated with additional layers of various ingredients to make it more efficient compared to other fertilizers. |
| Conventional Fertilizer | Fertilizers applied to crops through traditional methods including broadcasting, row placement, ploughing soil placement, etc. |
| Chelated Micronutrients | Micronutrient fertilizers coated with chelating agents such as EDTA, EDDHA, DTPA, HEDTA, etc. |
| Liquid Fertilizers | Available in liquid form, majorly used for application of fertilizers to crops through foliar and fertigation. |


Research Methodology
Mordor Intelligence follows a four-step methodology in all our reports.
- Step-1: IDENTIFY KEY VARIABLES: In order to build a robust forecasting methodology, the variables and factors identified in Step-1 are tested against available historical market numbers. Through an iterative process, the variables required for market forecast are set and the model is built on the basis of these variables.
- Step-2: Build a Market Model: Market-size estimations for the forecast years are in nominal terms. Inflation is not a part of the pricing, and the average selling price (ASP) is kept constant throughout the forecast period for each country.
- Step-3: Validate and Finalize: In this important step, all market numbers, variables and analyst calls are validated through an extensive network of primary research experts from the market studied. The respondents are selected across levels and functions to generate a holistic picture of the market studied.
- Step-4: Research Outputs: Syndicated Reports, Custom Consulting Assignments, Databases & Subscription Platforms


