Market Overview
| Study Period | 2021 - 2031 |
|---|---|
| Forecast Data Period | 2026 - 2031 |
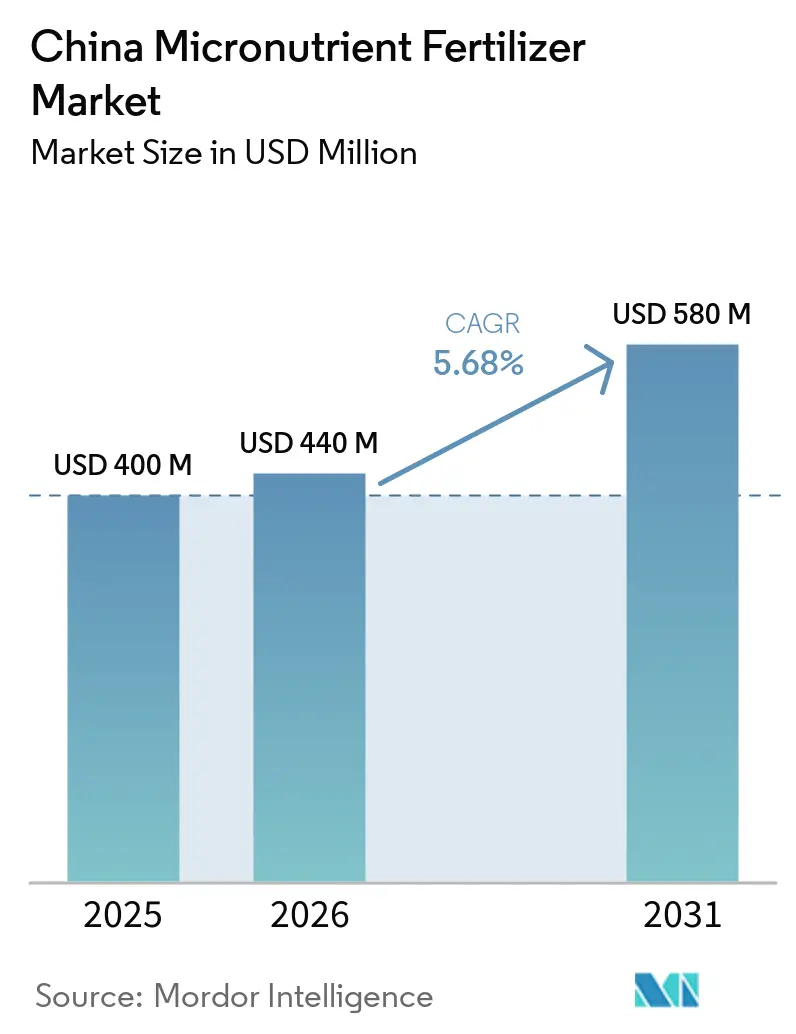
| Base Year Market Size (2025) | USD 400 Million |
| Market Size (2026) | USD 440 Million |
| Market Size (2031) | USD 580 Million |
| Growth Rate (2026 - 2031) | 5.68% CAGR |
| Market Concentration | Low |
Major Players *Disclaimer: Major Players sorted in no particular order Image © Mordor Intelligence. Reuse requires attribution under CC BY 4.0. | |
China Micronutrient Fertilizer Market Analysis by Mordor Intelligence
The China micronutrient fertilizer market size is estimated at USD 440.0 million in 2026, up from USD 400.0 million in 2025. The market is projected to reach USD 580.0 million by 2031, registering a CAGR of 5.68% during 2026–2031. Market expansion stems from policy-driven precision farming, rising soil health awareness, and sustained grain output targets exceeding 700 million metric tons. Widespread soil-testing mandates, effective 2025, convert micronutrients from optional inputs to documented necessities, lifting both volume and value realized by suppliers. Government subsidies tilt demand toward chelated formulations that curb leaching and support environmental goals, while controlled-release technologies improve nutrient-use efficiency by 10-30% in field trials. Specialty fruit exports spark rapid adoption of customized blends for horticulture, and greenhouse expansion in the Yangtze Delta reinforces the need for soluble, fertigation-ready products.
Key Report Takeaways
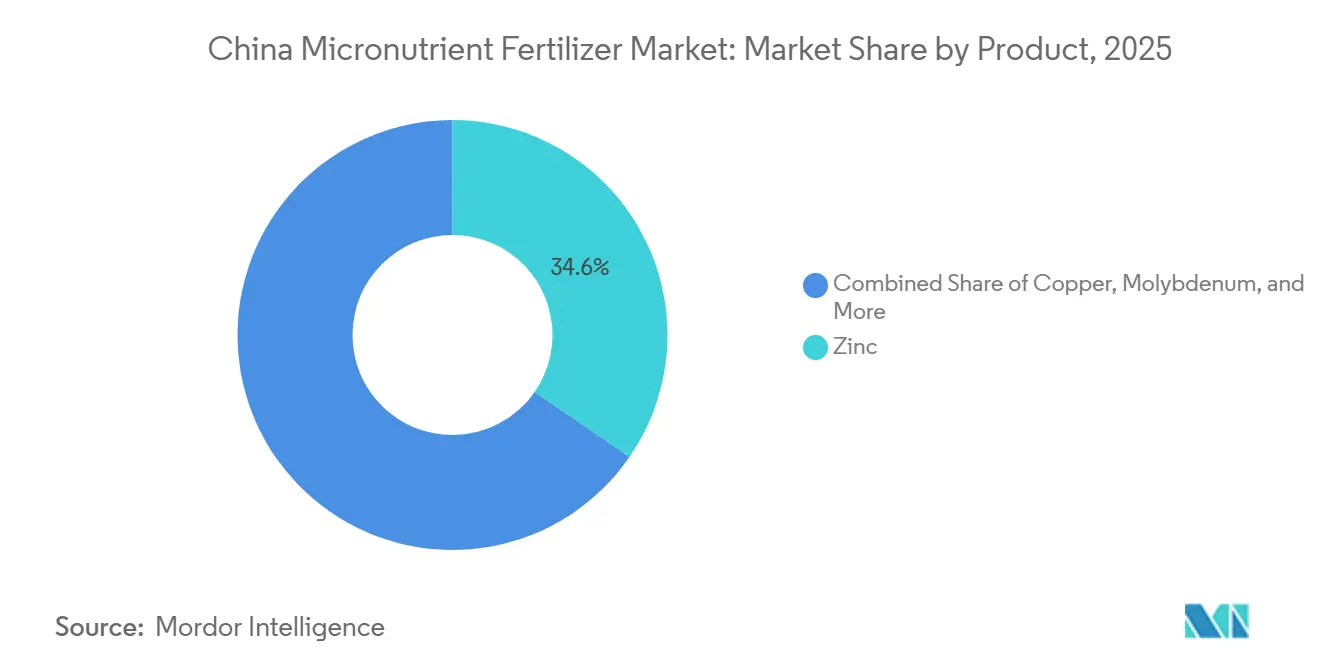
- By product, zinc accounted for the largest share of the China micronutrient fertilizer market, representing 34.6% in 2025. Boron is projected to be the fastest-growing segment, with a CAGR of 8.9% over 2026–2031.
- By application mode, soil application accounted for the largest China micronutrient fertilizer market share in 2025, representing 51.9% of the market, whereas fertigation is projected to be the fastest-growing segment, expanding at a CAGR of 9.8% during 2026–2031.
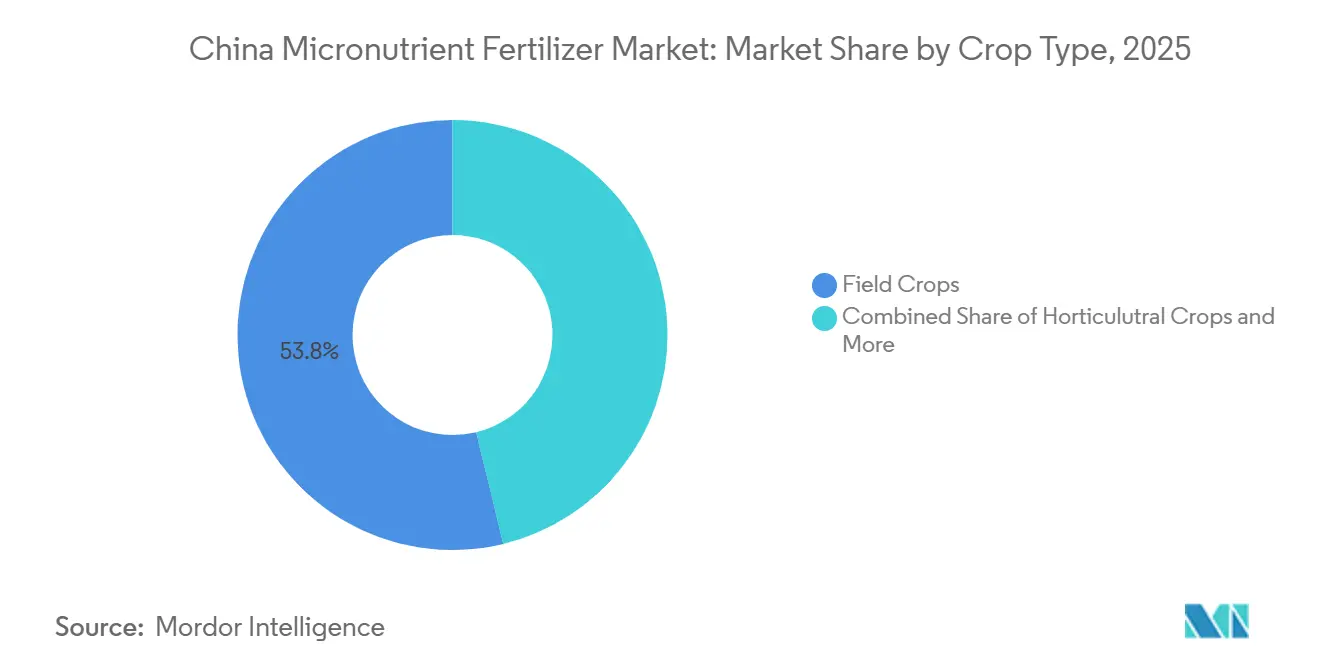
- By crop type, field crops accounted for the largest China micronutrient fertilizer market size in 2025, representing 53.8% of the market, while horticultural crops are forecast to register the highest growth rate, with a CAGR of 9.1% during 2026–2031.
Note: Market size and forecast figures in this report are generated using Mordor Intelligence’s proprietary estimation framework, updated with the latest available data and insights as of 2026.
China Micronutrient Fertilizer Market Trends and Insights
Drivers Impact Analysis*
| Driver | (~) % Impact on CAGR Forecast | Geographic Relevance | Impact Timeline |
|---|---|---|---|
| Precision-farming adoption accelerates micronutrient demand | +1.8% | National; early gains in North China Plain and Yangtze Delta | Medium term (2-4 years) |
| Mandated soil nutrient testing programs | +1.5% | Nationwide with provincial enforcement | Short term (≤ 2 years) |
| Government subsidies favor chelated formulations | +1.2% | National; subsidy rates vary by province | Medium term (2-4 years) |
| Expansion of high-tech greenhouses in Yangtze Delta | +0.9% | Yangtze Delta core; spreading to coastal provinces | Long term (≥ 4 years) |
| Rapid growth of specialty fruit exports | +0.7% | Shandong, Guangxi, Yunnan | Medium term (2-4 years) |
| Domestic zinc sulfate scale economies | +0.6% | Nationwide supply-chain optimization | Short term (≤ 2 years) |
| Source: Mordor Intelligence | |||


Precision-Farming Adoption Accelerates Micronutrient Demand
China's agricultural technology revolution drives micronutrient fertilizer demand through variable-rate application systems that optimize nutrient placement and timing. Government-backed smart agriculture initiatives have achieved 27.6% adoption of intelligent agriculture technologies across production areas, creating demand for precision-formulated micronutrient blends compatible with GPS-guided applicators [1]Source: National Development and Reform Commission, “Report on the Implementation of the 2023 Plan for National Economic and Social Development and on the 2024 Draft Plan for National Economic and Social Development,” npcobserver.com . This technological shift enables farmers to apply micronutrients at field-specific rates based on soil testing data, increasing both application efficiency and total consumption volumes. The integration of Internet of Things sensors and drone-based monitoring systems allows real-time adjustment of micronutrient applications, particularly for high-value crops requiring precise zinc and boron management. Precision farming adoption correlates with higher per-hectare micronutrient usage as farmers optimize yield potential through targeted nutrition programs rather than blanket applications.
Mandated Soil Nutrient Testing Programs
China's Ministry of Agriculture soil testing directive, effective 2025, requires certified soil nutrient analysis before farmers can claim fertilizer subsidies, fundamentally altering micronutrient purchasing patterns. This policy shift creates mandatory demand for soil-specific micronutrient recommendations, as farmers must demonstrate nutrient deficiencies to access government support programs. The testing mandate particularly benefits micronutrient suppliers offering soil analysis services and customized blending capabilities, as farmers seek integrated solutions combining testing, recommendation, and product supply. Provincial implementation varies in enforcement rigor, with major grain-producing regions like Henan and Shandong showing the strictest compliance requirements. This regulatory framework transforms micronutrient fertilizers from optional inputs to documented necessities, supporting sustained volume growth across all crop types and application methods.
Government Subsidies Favor Chelated Formulations
New subsidy structures preferentially support EDTA and IDHA-chelated micronutrient products to reduce nutrient leaching and improve environmental outcomes. The subsidy differential creates price advantages for chelated formulations, accelerating adoption among cost-sensitive smallholder farmers who previously relied on sulfate-based products. This policy shift drives demand toward higher-value micronutrient formulations while supporting domestic manufacturers developing chelation technologies. Compliance with environmental standards becomes a competitive advantage as subsidized chelated products gain market share at the expense of conventional sulfate formulations. The subsidy program aligns with China's broader agricultural sustainability goals, creating long-term structural support for premium micronutrient products that demonstrate superior environmental performance and nutrient use efficiency.
Expansion Of High-Tech Greenhouses in Yangtze Delta
Controlled-environment agriculture expansion in coastal provinces generates concentrated demand for water-soluble micronutrient formulations compatible with fertigation systems. The Yangtze Delta region leads greenhouse infrastructure development, with new facilities requiring precise nutrient management to optimize crop quality and yield in intensive production systems. Greenhouse operations typically consume 3-5 times more micronutrients per hectare than field crops due to higher plant density and extended growing seasons. Advanced greenhouse facilities integrate automated nutrient delivery systems that require consistent, high-purity micronutrient formulations to prevent equipment fouling and ensure uniform plant nutrition. This market segment commands premium pricing due to quality requirements and technical service needs, supporting higher-margin business models for specialized suppliers.
Restraints Impact Analysis*
| Restraint | (~) % Impact on CAGR Forecast | Geographic Relevance | Impact Timeline |
|---|---|---|---|
| Arable-land shrinkage due to urbanization | -1.1% | National; acute in eastern coastal provinces | Long term (≥ 4 years) |
| Trace-metal contamination limits application rates | -0.8% | Stringent in Guangdong and Jiangsu | Medium term (2-4 years) |
| Volatility in raw-material prices | -0.6% | Nationwide supply chain | Short term (≤ 2 years) |
| Farmer price-sensitivity amid rising input costs | -0.5% | Rural regions dominated by smallholders | Medium term (2-4 years) |
| Source: Mordor Intelligence | |||
Arable-Land Shrinkage Due to Urbanization
Urban development pressure reduces China's cultivable land area, creating a structural headwind for volume-based micronutrient fertilizer growth despite intensification efforts. Land conversion to industrial and residential uses removes approximately 200,000 hectares annually from agricultural production, directly reducing the addressable market for soil-applied micronutrient products. This constraint forces the industry toward value-added solutions that maximize nutrient efficiency per hectare rather than expanding total application volumes. Coastal provinces experience the most severe land pressure, driving consolidation of remaining farmland into larger, more efficient operations that favor bulk purchasing and precision application technologies. The land constraint paradoxically supports premium micronutrient products as farmers seek maximum yield from reduced acreage, but ultimately limits total market expansion potential.
Trace-Metal Contamination Limits Application Rates
Provincial restrictions on cadmium-bearing zinc fertilizers and other trace metal contaminants increasingly limit application rates and product formulations across key agricultural regions. Guangdong and Jiangsu provinces have implemented the strictest contamination thresholds, effectively banning certain imported micronutrient products that exceed heavy metal limits. These regulations create supply chain disruptions as manufacturers reformulate products to meet tightening standards, often increasing production costs and reducing profit margins. Compliance requirements favor domestic producers with access to cleaner raw materials, while creating barriers for international suppliers accustomed to less stringent contamination standards. The regulatory trend toward stricter trace metal limits supports long-term soil health but constrains near-term market growth as product availability decreases and prices rise.
*Our forecasts treat driver/restraint impacts as directional, not additive. The impact forecasts reflect baseline growth, mix effects, and variable interactions.
Segment Analysis
By Product: Zinc Leads Demand While Boron Records the Fastest Growth
Zinc accounted for the largest China micronutrient fertilizer market share, 34.6% in 2025, supported by widespread zinc deficiencies in agricultural soils and its essential role in enhancing crop growth, nutrient uptake, and yield performance. Demand for zinc remains particularly strong in cereals, oilseeds, and horticultural crops. Additionally, the increasing adoption of chelated and water-soluble zinc formulations is improving nutrient-use efficiency. Government-led soil testing initiatives and precision nutrient management programs are further boosting zinc fertilizer consumption across key agricultural regions.
Boron is anticipated to be the fastest-growing product segment, with a projected CAGR of 8.9% during 2026 to 2031. This growth is driven by the expanding cultivation of fruits, vegetables, and other high-value crops, where boron is critical for flowering, pollination, fruit set, and crop quality. The rising adoption of fertigation systems and specialty nutrient programs is further increasing demand for boron-based fertilizers, particularly in intensive horticultural production areas. Meanwhile, other micronutrients such as iron, copper, manganese, and molybdenum continue to address crop-specific nutrient deficiencies, contributing to the overall growth of the China micronutrient fertilizer market.


By Application Mode: Soil Applications Dominate the Market
Soil application methods captured 51.9% of the China micronutrient fertilizer market share in 2025, reflecting traditional broadcasting and incorporation practices that align with mechanized field operations across China's extensive grain production areas. This overwhelming dominance results from operational simplicity, equipment compatibility, and cost-effectiveness for large-scale commodity crop production, where labor costs increasingly constrain the adoption of foliar applications. The application mode distribution reflects China's dual agricultural structure, with extensive field crop systems favoring soil applications while intensive horticultural operations increasingly adopt foliar and fertigation technologies.
Fertigation applications represent the fastest-growing segment, with a 9.8% CAGR through 2031. This growth is primarily driven by fertigation's superior efficiency in delivering nutrients directly to the plant's root zone, particularly beneficial in high-moisture and waterlogging conditions, where certain micronutrients, such as zinc, can become unavailable to plants. The segment's growth is further supported by the increasing adoption of modern irrigation systems and the method's compatibility with water-soluble fertilizers.
By Crop Type: Field Crops Remain the Core Market While Horticulture Drives Growth
Field crops dominated the market, accounting for 53.8% of the China micronutrient fertilizer market share in 2025. This dominance reflects China's grain security priorities and the extensive cultivation of rice, wheat, and corn, which require micronutrient applications to maintain yield stability and support crop productivity. The segment's leadership is reinforced by government policies focused on food self-sufficiency and the vast acreage dedicated to staple grain production across the North China Plain, Northeast China, and the Middle Yangtze region.
Horticultural crops are projected to register the highest growth rate, with a CAGR of 9.1% during 2026–2031. This growth is driven by the expanding production of fruits, vegetables, and other high-value crops that require precise micronutrient management to improve yields, quality, and export competitiveness. The increasing adoption of protected cultivation, fertigation systems, and specialty nutrient formulations is further boosting demand within the segment. Additionally, turf and ornamental crops continue to contribute to market growth, supported by rising landscaping activities, urban greening initiatives, and growing demand for ornamental plants across China's urban areas.
Geography Analysis
China's micronutrient fertilizer market exhibits strong regional concentration in the North China Plain, Yangtze River Delta, and Northeast regions, which collectively account for the majority of consumption due to intensive agricultural production and favorable policy support. The North China Plain leads demand driven by extensive wheat and corn production on soils with documented zinc and iron deficiencies, while government soil testing mandates create structured demand for micronutrient applications across Hebei, Shandong, and Henan provinces. The Yangtze Delta region shows the fastest growth trajectory, supported by greenhouse expansion and high-value horticultural production that requires precise micronutrient management for export quality standards.
The Northeast region maintains steady demand centered on rice production systems where manganese and zinc applications address specific deficiencies in flooded soil conditions. Inner Mongolia and Xinjiang represent emerging growth markets as irrigation expansion and specialty crop development create new demand for micronutrient products tailored to arid and semi-arid conditions. Regional policy variations significantly influence market dynamics, with provinces offering different subsidy structures and environmental compliance requirements that affect product selection and application timing.
Western provinces including Sichuan, Yunnan, and Guangxi show specialized demand patterns linked to unique crop mixes and soil conditions, with mountainous terrain and diverse microclimates creating niche opportunities for customized micronutrient solutions. The regional market evolution suggests continued concentration in established agricultural zones while gradual expansion into developing areas as infrastructure and technical support systems mature.
Competitive Landscape
The market exhibits moderate fragmented, with the top players including Yara International ASA, ICL Group Ltd, Hebei Monband Water Soluble Fertilizer Co. Ltd, Sociedad Quimica y Minera de Chile SA, and Coromandel International Ltd., controlling a substantial portion of the market while numerous smaller local players serve regional markets. Strategic partnerships and collaborations between international and domestic companies are increasingly common, particularly in manufacturing and distribution. Market leaders like Hebei Monband leverage integrated production capabilities and distribution networks to maintain cost leadership, while international players, including Yara and ICL, compete through advanced formulation technologies and technical support services [3]Source: Yara International, “NOK Bond Prospectus – Summary,” yara.com .
Success in the Chinese agricultural micronutrients market increasingly depends on developing innovative, efficient delivery systems and maintaining strong distribution networks. Companies need to focus on creating specialized products for specific crops and soil conditions while ensuring cost-effectiveness. Building strong relationships with agricultural cooperatives and local farming communities has become crucial for market penetration. Investment in research and development, particularly in areas of nutrient efficiency and environmental sustainability, is becoming a key differentiator for market success.
Market players must navigate complex regulatory requirements while adapting to changing environmental regulations and sustainability demands. Companies need to develop comprehensive digital platforms and technical support services to assist farmers in optimal product usage. The ability to provide integrated nutrient management solutions, rather than standalone products, is becoming increasingly important. Success also depends on building robust supply chains that can ensure product availability across China's diverse agricultural regions while maintaining product quality and competitive pricing. Future growth opportunities lie in developing eco-friendly formulations and precision agriculture solutions that align with government initiatives for sustainable agriculture.
China Micronutrient Fertilizer Industry Leaders
Coromandel International Ltd.
Hebei Monband Water Soluble Fertilizer Co. Ltd
ICL Group Ltd
Sociedad Quimica y Minera de Chile SA
Yara International ASA
- *Disclaimer: Major Players sorted in no particular order

Recent Industry Developments
- October 2024: Mixue Bingcheng's agricultural subsidiary Xuewang Agriculture expanded lemon production partnerships covering 150,000 mu in Tongnan, implementing bulk procurement programs for fertilizers, including micronutrient fertilizers, that reduced input costs by 10% for participating farmers
- June 2024: Yara International issued NOK 1.15 billion (USD 108 million) green bonds to fund eligible projects, including advanced fertilizer technologies, with proceeds supporting global operations, including China market development and low-emission production capabilities.
- May 2023: Qingdao Seawin Biotech Group launched advanced enzymatic seaweed extract technology for micronutrient delivery systems, claiming 10-30% improvement in NPK utilization efficiency and 5-15% yield increases in field trials. The innovation addresses growing demand for biostimulant-micronutrient combinations in specialty crop production.


China Micronutrient Fertilizer Market Report Scope
The China Micronutrient Fertilizer Market is Segmented by Product (Boron, Copper, Iron, Manganese, Molybdenum, Zinc, and Others), by Application Mode (Fertigation, Foliar, and Soil), and by Crop Type (Field Crops, Horticultural Crops, and Turf and Ornamental). The Market Forecasts are Provided in Terms of Value (USD) and Volume (Metric Tons).
Product
| Boron |
| Copper |
| Iron |
| Manganese |
| Molybdenum |
| Zinc |
| Others |
Application Mode
| Fertigation |
| Foliar |
| Soil |
Crop Type
| Field Crops |
| Horticultural Crops |
| Turf & Ornamental |
| Product | Boron |
| Copper | |
| Iron | |
| Manganese | |
| Molybdenum | |
| Zinc | |
| Others | |
| Application Mode | Fertigation |
| Foliar | |
| Soil | |
| Crop Type | Field Crops |
| Horticultural Crops | |
| Turf & Ornamental |


Market Definition
- MARKET ESTIMATION LEVEL - Market Estimations for various types of fertilizers has been done at the product-level and not at the nutrient-level.
- NUTRIENT TYPES COVERED - Micronutients: Zn, Mn, Cu, Fe, Mo, B, and Others
- AVERAGE NUTRIENT APPLICATION RATE - This refers to the average volume of nutrient consumed per hectare of farmland in each country.
- CROP TYPES COVERED - Field Crops: Cereals, Pulses, Oilseeds, and Fiber Crops Horticulture: Fruits, Vegetables, Plantation Crops and Spices, Turf Grass and Ornamentals
| Keyword | Definition |
|---|---|
| Fertilizer | Chemical substance applied to crops to ensure nutritional requirements, available in various forms such as granules, powders, liquid, water soluble, etc. |
| Specialty Fertilizer | Used for enhanced efficiency and nutrient availability applied through soil, foliar, and fertigation. Includes CRF, SRF, liquid fertilizer, and water soluble fertilizers. |
| Controlled-Release Fertilizers (CRF) | Coated with materials such as polymer, polymer-sulfur, and other materials such as resins to ensure nutrient availability to the crop for its entire life cycle. |
| Slow-Release Fertilizers (SRF) | Coated with materials such as sulfur, neem, etc., to ensure nutrient availability to the crop for a longer period. |
| Foliar Fertilizers | Consist of both liquid and water soluble fertilizers applied through foliar application. |
| Water-Soluble Fertilizers | Available in various forms including liquid, powder, etc., used in foliar and fertigation mode of fertilizer application. |
| Fertigation | Fertilizers applied through different irrigation systems such as drip irrigation, micro irrigation, sprinkler irrigation, etc. |
| Anhydrous Ammonia | Used as fertilizer, directly injected into the soil, available in gaseous liquid form. |
| Single Super Phosphate (SSP) | Phosphorus fertilizer containing only phosphorus which has lesser than or equal to 35%. |
| Triple Super Phosphate (TSP) | Phosphorus fertilizer containing only phosphorus greater than 35%. |
| Enhanced Efficiency Fertilizers | Fertilizers coated or treated with additional layers of various ingredients to make it more efficient compared to other fertilizers. |
| Conventional Fertilizer | Fertilizers applied to crops through traditional methods including broadcasting, row placement, ploughing soil placement, etc. |
| Chelated Micronutrients | Micronutrient fertilizers coated with chelating agents such as EDTA, EDDHA, DTPA, HEDTA, etc. |
| Liquid Fertilizers | Available in liquid form, majorly used for application of fertilizers to crops through foliar and fertigation. |


Research Methodology
Mordor Intelligence follows a four-step methodology in all our reports.
- Step-1: IDENTIFY KEY VARIABLES: In order to build a robust forecasting methodology, the variables and factors identified in Step-1 are tested against available historical market numbers. Through an iterative process, the variables required for market forecast are set and the model is built on the basis of these variables.
- Step-2: Build a Market Model: Market-size estimations for the forecast years are in nominal terms. Inflation is not a part of the pricing, and the average selling price (ASP) is kept constant throughout the forecast period for each country.
- Step-3: Validate and Finalize: In this important step, all market numbers, variables and analyst calls are validated through an extensive network of primary research experts from the market studied. The respondents are selected across levels and functions to generate a holistic picture of the market studied.
- Step-4: Research Outputs: Syndicated Reports, Custom Consulting Assignments, Databases & Subscription Platforms


