Secondary Macronutrients Market Size and Share
Market Overview
| Study Period | 2021 - 2031 |
|---|---|
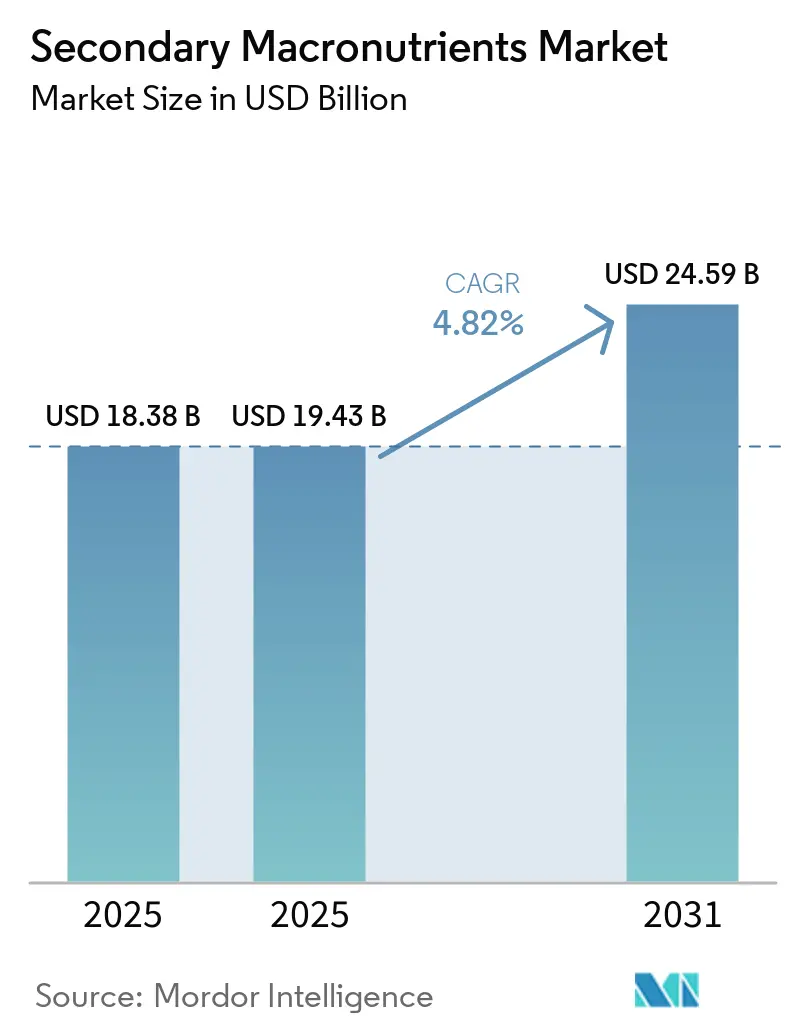
| Market Size (2025) | USD 19.43 Billion |
| Market Size (2031) | USD 24.59 Billion |
| Growth Rate (2026 - 2031) | 4.82% CAGR |
| Fastest Growing Market | Asia-Pacific |
| Largest Market | Asia-Pacific |
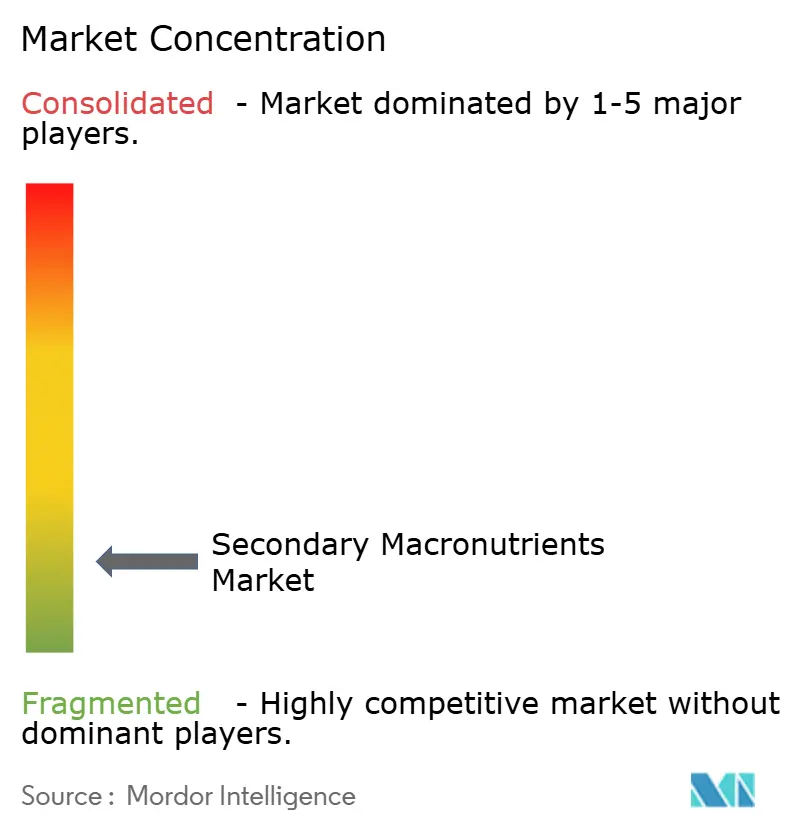
| Market Concentration | Low |
Major Players*Disclaimer: Major Players sorted in no particular order Image © Mordor Intelligence. Reuse requires attribution under CC BY 4.0. | |
Secondary Macronutrients Market Analysis by Mordor Intelligence
The secondary macronutrients market size was valued at USD 18.38 billion in 2025, is estimated at USD 19.43 billion in 2026, and is projected to reach USD 24.59 billion by 2031, expanding at a CAGR of 4.82% during the forecast period (2026–2031). Strong demand for balanced soil nutrition, mandated sulfur recovery by refiners, and co-granulation technologies that reduce field passes are reinforcing this upward trend. Soil fertility declines in high-output wheat, corn, and oilseed belts, coupled with greenhouse expansion in the Asia-Pacific region, are sharpening the focus on calcium, magnesium, and sulfur inputs. Elemental sulfur sourced from diesel desulfurization has lowered raw material costs, while precision application hardware has increased nutrient use efficiency. Together, these factors keep the secondary macronutrients market firmly on a growth track.
Key Report Takeaways
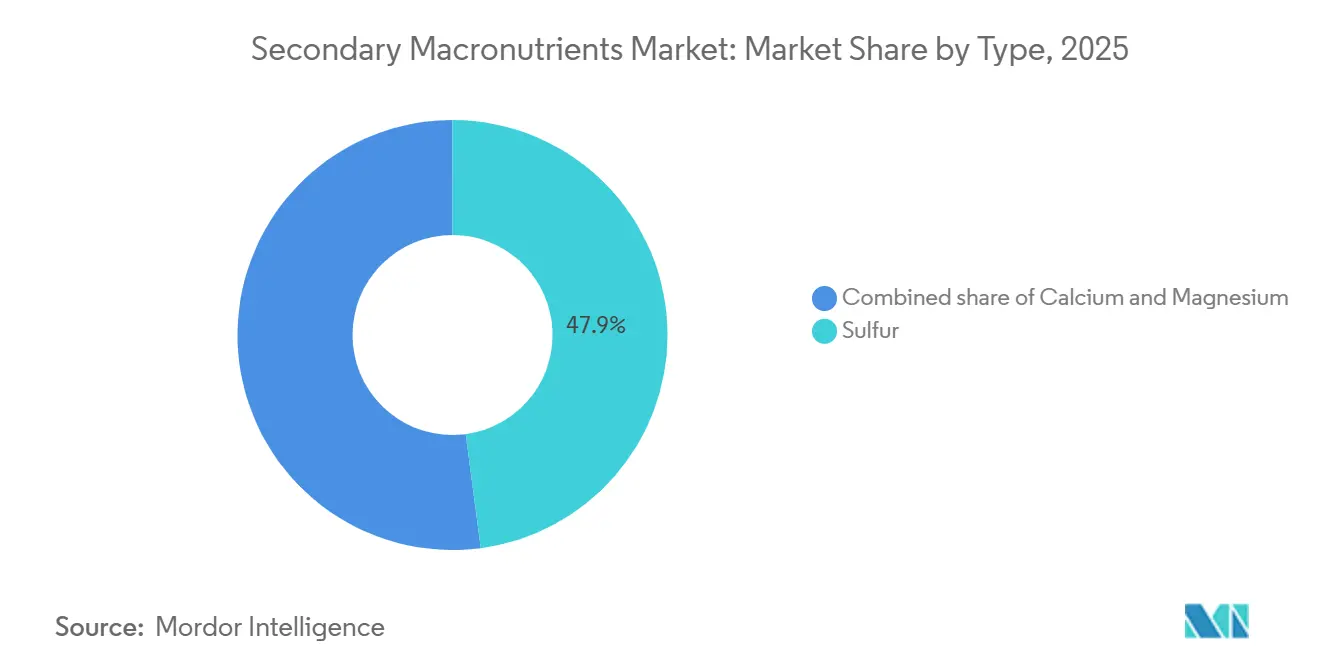
- By type, sulfur accounted for the largest secondary macronutrients market share of 47.9% in 2025, while calcium is projected to be the fastest-growing segment, advancing at a CAGR of 5.8% from 2026 to 2031.
- By application mode, soil application represented 76.5% of the market in 2025, whereas fertigation is forecast to register the highest growth rate at a CAGR of 6.1% through 2031.
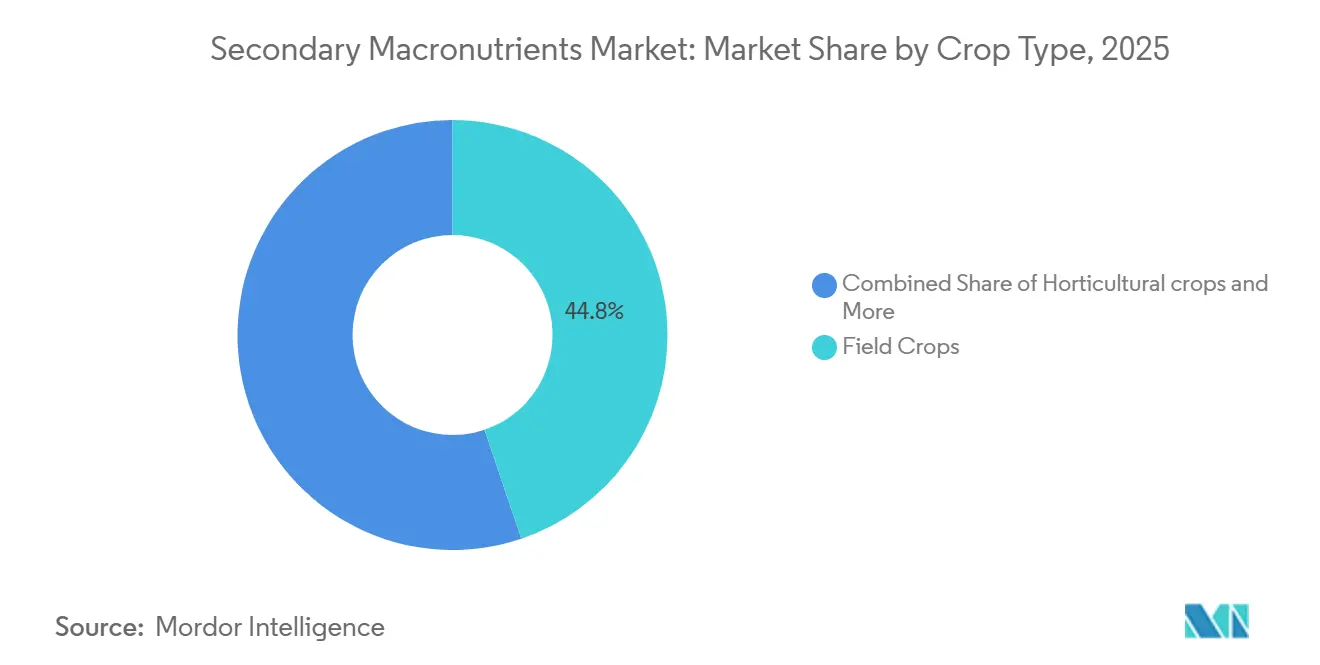
- By crop type, field crops captured the largest secondary macronutrients market size, accounting for 44.8% of the market in 2025, while horticultural crops are projected to be the fastest-growing segment, expanding at a CAGR of 5.9% from 2026 to 2031.
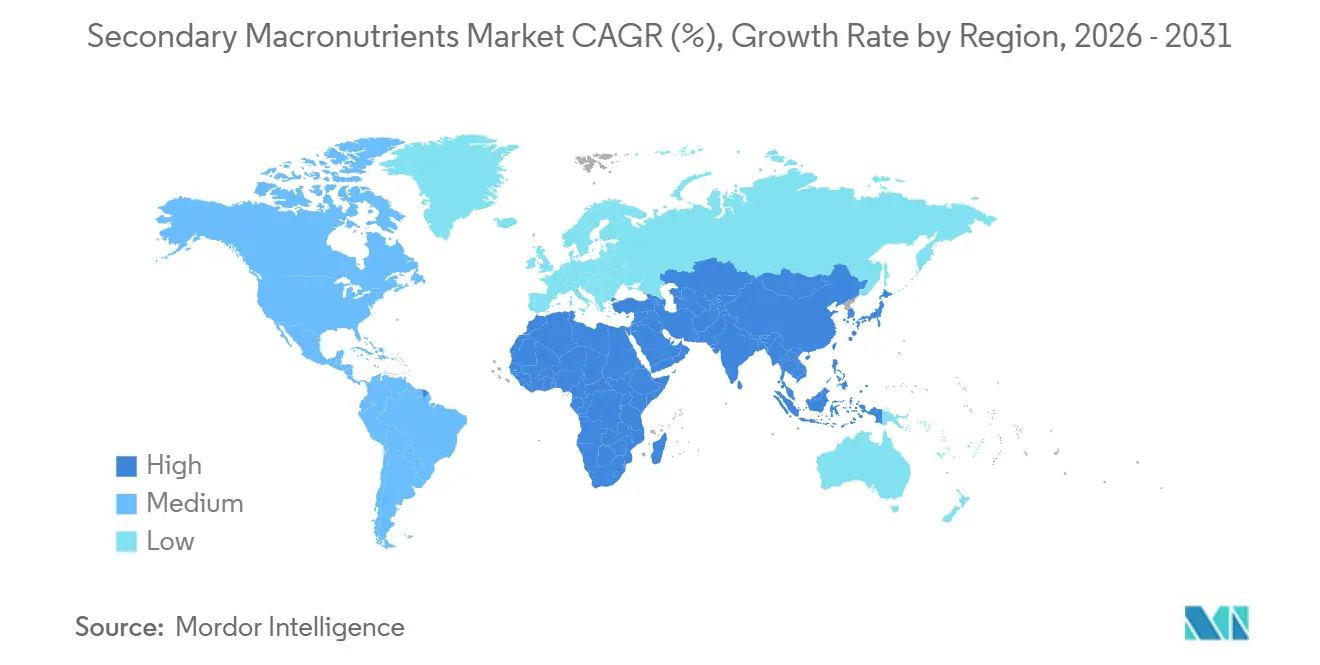
- By geography, Asia-Pacific accounted for 40.0% of the market in 2025 and is also projected to be the fastest-growing regional market, advancing at a CAGR of 5.8% from 2026 to 2031.
Note: Market size and forecast figures in this report are generated using Mordor Intelligence’s proprietary estimation framework, updated with the latest available data and insights as of January 2026.
Global Secondary Macronutrients Market Trends and Insights
Drivers Impact Analysis*
| Driver | (~) % Impact on CAGR Forecast | Geographic Relevance | Impact Timeline |
|---|---|---|---|
| Soil acidity-driven calcium demand in bread-wheat belts | +0.80% | North America and Europe | Medium term (2-4 years) |
| Retrofit of fertigation in drip-irrigated mega greenhouses | +0.60% | Asia-Pacific core, spill-over to Europe and North America | Short term (≤ 2 years) |
| Sugar-crop acreage expansion in Southeast Asia | +0.50% | Asia-Pacific | Medium term (2-4 years) |
| Ultra-low-sulfur diesel rules boosting elemental sulfur supply | +0.70% | Global | Long term (≥ 4 years) |
| Co-granulation that embeds Ca-Mg-S in single prills | +0.40% | Global | Medium term (2-4 years) |
| Secondary nutrient stewardship programs by trader–retail co-ops | +0.30% | North America and Europe | Long term (≥ 4 years) |
| Source: Mordor Intelligence | |||


Soil Acidity-Driven Calcium Demand in Bread-Wheat Belts
Continuous wheat cultivation tied to heavy nitrogen use is accelerating soil acidification. Domestic agricultural lime output in the United States climbed sharply in 2024, indicating a stronger farmer response to falling soil pH[1]Source: United States Geological Survey, “Mineral Commodity Summaries 2024: Lime,” usgs.gov. Calcium nitrate and calcium sulfate are increasingly applied to restore nutrient balance, improve grain quality, and sustain protein premiums in export-oriented supply chains. Because acidification is cumulative, recurring calcium applications create a steady pull-through for suppliers. Premium flour millers who reward higher dough-strength profiles reinforce grower willingness to budget for secondary nutrients. The trend extends across Canada, France, and Poland, aligning with national soil health initiatives that tie payments to improved cation exchange capacity.
Retrofit of Fertigation in Drip-Irrigated Mega Greenhouses
Industrial-scale greenhouse farms across China, the Gulf states, Spain, and Mexico now favor liquid calcium, magnesium, and sulfur delivered through existing drip lines. Converting from granular topdress to fertigation lowers labor by up to 25% per hectare and boosts uptake by synchronizing nutrient flow with plant transpiration. Facilities integrate real-time sensors that guide dosing adjustments, cutting oversupply while lifting yield per square meter. Input distributors respond by launching technical-grade, chloride-free calcium nitrate, fully soluble in cold water. This capital-light retrofit wave lifts premium formulation demand across the secondary macronutrient fertilizer market and prompts equipment suppliers to bundle venturi injectors with subscription nutrient packs.
Sugar-Crop Acreage Expansion in Southeast Asia
Thailand, Vietnam, and the Philippines are allocating fertile plains to sugarcane to meet domestic biofuel targets and export quotas. Government support packages subsidize sulfur-rich single superphosphate and calcium-bearing gypsum, cushioning farmer costs and elevating average nutrient application rates. The Japanese research agency JIRCAS underscores sulfur’s role in sucrose synthesis and calcium’s link to cane strength, both vital for mill throughput[2]Source: Japan International Research Center for Agricultural Sciences, “Fertilizer Price Trends,” jircas.go.jp. Fertilizer blenders are building coastal hubs near refineries to harness elemental sulfur, shortening supply chains and fostering pricing stability in this rapidly scaling segment.
Ultra-Low-Sulfur Diesel Rules Boosting Elemental Sulfur Supply
Refiners worldwide strip sulfur down to 10 ppm to meet road-diesel mandates. Elemental sulfur output has therefore surged, prompting a 26% price slide in 2024[3]Source: World Bank Group, “Fertilizer Prices Edge Lower,” worldbank.org. Fertilizer manufacturers secure long-term offtake contracts with energy firms, slicing raw-material volatility and expanding granulation runs. This plentiful feedstock is a structural cost tailwind for the secondary macronutrient fertilizer market, widening margins and encouraging capacity additions in emerging economies that previously relied on imports.
Restraints Impact Analysis*
| Restraint | (~) % Impact on CAGR Forecast | Geographic Relevance | Impact Timeline |
|---|---|---|---|
| Sea-freight volatility for bulk calcium nitrate | −0.4% | Import-dependent regions | Short term (≤ 2 years) |
| Declining magnesium ore grades in Russia and Israel | −0.3% | Global | Long term (≥ 4 years) |
| Slow EU approvals for recycled gypsum fertilizers | −0.2% | Europe | Medium term (2-4 years) |
| Farmer cash-flow squeeze from tightening ag-credit in South America | −0.5% | South America | Medium term (2-4 years) |
| Source: Mordor Intelligence | |||
Sea-Freight Volatility for Bulk Calcium Nitrate
Transoceanic shipping costs remain above pre-pandemic norms, with spot rates swinging 40% within months. The USDA Freight Dashboard shows fertilizer shipments facing container shortages that prolong the delivery window[4]Source: United States Geological Survey, “Mineral Commodity Summaries 2024: Magnesium,” usgs.gov. Import-reliant markets like South Asia absorb these higher freight fees in landed cost, raising farm-gate prices. Some buyers postpone calcium nitrate orders or substitute lower-grade calcium ammonium nitrate, depressing near-term growth in the secondary macronutrient fertilizer market.
Declining Magnesium Ore Grades in Russia and Israel
Major fertilizer producers are reporting declining ore grades now averaging below 9% which is increasing waste-to-ore ratios and raising energy consumption per ton of processed material. According to assessments by the U.S. Geological Survey (USGS), extraction costs continue to climb as miners are forced to access deeper, lower-yield seams, requiring more intensive drilling and beneficiation[5]Source: USDA, “Fertilizer Transportation Dashboard,” cen-commodities.com. This tightening of upstream supply has led to the giant, which could diversify sourcing toward Australia and China, though most new extraction and processing ventures in these regions involve multi-year development timelines, suggesting that the current supply constraints and pricing pressures are likely to persist through the medium term.
*Our forecasts treat driver/restraint impacts as directional, not additive. The impact forecasts reflect baseline growth, mix effects, and variable interactions.
Segment Analysis
By Type: Sulfur Dominance Reflects Protein Synthesis Priorities
Sulfur held 47.9% of the secondary macronutrients market in 2025, powered by its vital link to amino acid formation and oil development in canola and soybean. The segment grows steadily on abundant refinery-derived elemental sulfur that underpins competitive pricing. Calcium is projected to grow at the fastest pace, with a 5.8% CAGR from 2026 to 2031, as growers address soil acidification and fruit firmness requirements in orchards. Magnesium demand centers on high-value horticulture quotas that reward optimal chlorophyll levels. Sulfur’s cost advantage and broad crop need will keep it firmly in front, but calcium’s accelerated uptake in both open-field and controlled-environment agriculture signals a narrowing gap.
Wider refinery desulfurization across North America, the Middle East, and Asia ensures a structurally long supply of raw sulfur, supporting the expansion of granular and pastille capacity. Precision fertigation unlocks calcium and nitrate potential in tomato and pepper glasshouses, reinforcing margins for soluble product lines. Magnesium maintains its specialty role in leafy greens and tropical fruit, where color retention is non-negotiable for export markets.


By Application Mode: Soil Applications Dominate Despite Fertigation Growth
Soil delivery accounted for 76.5% share of the secondary macronutrients market in 2025, reflecting farmer familiarity and machinery compatibility. Established broadcasters and air-seeders accommodate co-granulated Ca-Mg-S prills without workflow changes. Yet fertigation is the fastest-growing channel, with a 6.1% CAGR during 2026 to 2031, driven by greenhouse proliferation and drip retrofit incentives. Foliar sprays fill niche gaps when rapid deficiency correction is essential, particularly for premium table grape blocks.
Liquid secondary macronutrients achieve uptake efficiencies up to 20% higher than equivalent field applications, persuading investors in high-tech greenhouses to integrate in-line injectors. Soil application developers counter by adding urease inhibitors and polymer coatings that moderate nutrient release, sustaining relevance in field crops. Foliar formulations contain surfactants and chelating agents that accelerate leaf absorption, though their volumes remain modest compared with those of granules and liquids.
By Crop Type: Field Crops Dominate While Horticulture Leads Growth
Field crops commanded 44.8% of the secondary macronutrients market size in 2024, owing to vast hectare coverage in wheat, corn, soybean, and rapeseed. Stable raw-material supply and well-defined recommendations drive predictable year-on-year offtake. Horticulture Crops is projected to be the fastest-growing segment, with a 5.9% CAGR, from 2026 to 2031, driven by rising disposable incomes that boost demand for high-quality fruits and vegetables. Turf and ornamental niches rely on visual quality premiums that tolerate specialized, higher-grade inputs.
Soil protein contracts in wheat incentivize sulfur topdressing, while canola processors pay oil-content bonuses that justify incremental Mg-S blends. Greenhouse bell pepper producers in Turkey and Spain adopt calcium and nitrate via fertigation to prevent blossom-end rot, propelling horticultural demand. Golf courses in the Sun Belt apply magnesium sulfate to sustain turf color under high evapotranspiration, underlining micro-segment opportunities.
Geography Analysis
Asia-Pacific retained a 40.0% share of the secondary macronutrients market in 2025 and is projected to expand at a 5.8% CAGR during 2026-2031. Government-backed modernization in China, India, and Southeast Asia couples soil-health subsidies with extension services that champion balanced nutrient programs. Sugarcane area in Thailand and Vietnam alone lifts sulfur offtake by double digits, while greenhouse acreage in Shandong province drives liquid calcium imports. The region’s diverse agro-climatic zones create multifaceted demand pockets that global suppliers serve through region-specific grade portfolios.
North America enjoys mature adoption and focuses on efficiency gains. Ultra-low-sulfur diesel rules ensure a steady supply of elemental sulfur, reducing price volatility. Farmers integrate variable-rate applicators to match secondary nutrient prescriptions with yield maps. Europe prioritizes circular-economy sourcing but wrestles with extended REACH timelines for recycled products. Calcium applications feature prominently as growers neutralize acidifying nitrogen inputs, especially in Germany and Poland.
South America presents a dichotomy: Brazil, the continent’s powerhouse, increases secondary macronutrient usage as soybean and sugar mills demand higher protein and sucrose; Argentina lags under credit restrictions that dampen discretionary spending. The Middle East and Africa demonstrate rising interest in calcium nitrate for protected farming; Saudi food-security projects and Egyptian greenhouse clusters spur growth from a small base. These emerging corridors are gradually adding heft to the secondary macronutrients market.

Competitive Landscape
The secondary macronutrients market is highly fragmented; the top five suppliers holding a minimum combined share, translating to ample room for regional specialists. Major players such as Yara International, and Mosaic lean on extensive distribution logistics and proprietary crop-nutrition advisory platforms. They reinforce portfolios through backward integration. Yara’s expansion in refinery sulfur handling is one recent instance.
Regional firms thrive by tailoring grades to local soil chemistries and by offering bundled services that integrate testing, custom blending, and micro-logistics. Co-granulation capabilities are becoming defining assets, with technology licensors signing multi-plant agreements across South America and Africa. Patent filings climb in controlled-release and surfactant-enhanced liquid blends, underscoring ongoing R&D rivalry even at modest market-share levels.
Sustainability mandates accelerate interest in waste-derived gypsum and magnesium from desalination brines, areas where nimble newcomers challenge incumbents. However, prolonged regulatory pathways in Europe temper quick scale-up. Strategic alliances between energy refiners supplying elemental sulfur and fertilizer converters remain central to cost leadership. As cost curves flatten, technical advisory proficiency is emerging as the primary differentiation lever.
Secondary Macronutrients Industry Leaders
ICL Group Ltd
K+S Aktiengesellschaft
Koch Industries Inc.
The Mosaic Company
Yara International ASA
- *Disclaimer: Major Players sorted in no particular order

Recent Industry Developments
- March 2025: Coromandel International doubled sulfur pastille capacity in Visakhapatnam to 50,000 metric tons to secure steady feedstock for bentonite sulfur products.
- April 2023: K+S acquired a 75% share of the fertilizer business of a South African trading company, Industrial Commodities Holdings (Pty) Ltd (ICH). In addition to expanding the core business, K+S is strengthening its operations in southern and eastern Africa as a result of this acquisition. The newly acquired fertilizer business in the future is to be operated in a joint venture under the name of FertivPty Ltd.


Global Secondary Macronutrients Market Report Scope
The Secondary Macronutrients Fertilizer Market Report Segments the Industry Into Type (Calcium, Magnesium, and Sulfur), Application Mode (Fertigation, Foliar, and Soil), Crop Type (Field Crops, Horticultural Crops, and Turf & Ornamental), and Region (Asia-Pacific, Europe, Middle East & Africa, North America, and South America). The Report Includes Market Size in Value in USD and Volume.
| Straight | Secondary Macronutrients | Calcium |
| Magnesium | ||
| Sulfur |
| Fertigation |
| Foliar |
| Soil |
| Field Crops |
| Horticultural Crops |
| Turf & Ornamental |
| Asia-Pacific | Australia |
| Bangladesh | |
| China | |
| India | |
| Indonesia | |
| Japan | |
| Pakistan | |
| Philippines | |
| Thailand | |
| Vietnam | |
| Rest of Asia-Pacific | |
| Europe | France |
| Germany | |
| Italy | |
| Netherlands | |
| Russia | |
| Spain | |
| Ukraine | |
| United Kingdom | |
| Rest of Europe | |
| Middle East & Africa | Nigeria |
| Saudi Arabia | |
| South Africa | |
| Turkey | |
| Rest of Middle East & Africa | |
| North America | Canada |
| Mexico | |
| United States | |
| Rest of North America | |
| South America | Argentina |
| Brazil | |
| Rest of South America |
| Type | Straight | Secondary Macronutrients | Calcium |
| Magnesium | |||
| Sulfur | |||
| Application Mode | Fertigation | ||
| Foliar | |||
| Soil | |||
| Crop Type | Field Crops | ||
| Horticultural Crops | |||
| Turf & Ornamental | |||
| Region | Asia-Pacific | Australia | |
| Bangladesh | |||
| China | |||
| India | |||
| Indonesia | |||
| Japan | |||
| Pakistan | |||
| Philippines | |||
| Thailand | |||
| Vietnam | |||
| Rest of Asia-Pacific | |||
| Europe | France | ||
| Germany | |||
| Italy | |||
| Netherlands | |||
| Russia | |||
| Spain | |||
| Ukraine | |||
| United Kingdom | |||
| Rest of Europe | |||
| Middle East & Africa | Nigeria | ||
| Saudi Arabia | |||
| South Africa | |||
| Turkey | |||
| Rest of Middle East & Africa | |||
| North America | Canada | ||
| Mexico | |||
| United States | |||
| Rest of North America | |||
| South America | Argentina | ||
| Brazil | |||
| Rest of South America | |||


Market Definition
- MARKET ESTIMATION LEVEL - Market Estimations for various types of fertilizers has been done at the product-level and not at the nutrient-level.
- NUTRIENT TYPES COVERED - Secondary Macronutrients: Ca, Mg and S
- AVERAGE NUTRIENT APPLICATION RATE - This refers to the average volume of nutrient consumed per hectare of farmland in each country.
- CROP TYPES COVERED - Field Crops: Cereals, Pulses, Oilseeds, and Fiber Crops Horticulture: Fruits, Vegetables, Plantation Crops and Spices, Turf Grass and Ornamentals
| Keyword | Definition |
|---|---|
| Fertilizer | Chemical substance applied to crops to ensure nutritional requirements, available in various forms such as granules, powders, liquid, water soluble, etc. |
| Specialty Fertilizer | Used for enhanced efficiency and nutrient availability applied through soil, foliar, and fertigation. Includes CRF, SRF, liquid fertilizer, and water soluble fertilizers. |
| Controlled-Release Fertilizers (CRF) | Coated with materials such as polymer, polymer-sulfur, and other materials such as resins to ensure nutrient availability to the crop for its entire life cycle. |
| Slow-Release Fertilizers (SRF) | Coated with materials such as sulfur, neem, etc., to ensure nutrient availability to the crop for a longer period. |
| Foliar Fertilizers | Consist of both liquid and water soluble fertilizers applied through foliar application. |
| Water-Soluble Fertilizers | Available in various forms including liquid, powder, etc., used in foliar and fertigation mode of fertilizer application. |
| Fertigation | Fertilizers applied through different irrigation systems such as drip irrigation, micro irrigation, sprinkler irrigation, etc. |
| Anhydrous Ammonia | Used as fertilizer, directly injected into the soil, available in gaseous liquid form. |
| Single Super Phosphate (SSP) | Phosphorus fertilizer containing only phosphorus which has lesser than or equal to 35%. |
| Triple Super Phosphate (TSP) | Phosphorus fertilizer containing only phosphorus greater than 35%. |
| Enhanced Efficiency Fertilizers | Fertilizers coated or treated with additional layers of various ingredients to make it more efficient compared to other fertilizers. |
| Conventional Fertilizer | Fertilizers applied to crops through traditional methods including broadcasting, row placement, ploughing soil placement, etc. |
| Chelated Micronutrients | Micronutrient fertilizers coated with chelating agents such as EDTA, EDDHA, DTPA, HEDTA, etc. |
| Liquid Fertilizers | Available in liquid form, majorly used for application of fertilizers to crops through foliar and fertigation. |


Research Methodology
Mordor Intelligence follows a four-step methodology in all our reports.
- Step-1: IDENTIFY KEY VARIABLES: In order to build a robust forecasting methodology, the variables and factors identified in Step-1 are tested against available historical market numbers. Through an iterative process, the variables required for market forecast are set and the model is built on the basis of these variables.
- Step-2: Build a Market Model: Market-size estimations for the forecast years are in nominal terms. Inflation is not a part of the pricing, and the average selling price (ASP) is kept constant throughout the forecast period for each country.
- Step-3: Validate and Finalize: In this important step, all market numbers, variables and analyst calls are validated through an extensive network of primary research experts from the market studied. The respondents are selected across levels and functions to generate a holistic picture of the market studied.
- Step-4: Research Outputs: Syndicated Reports, Custom Consulting Assignments, Databases & Subscription Platforms


